TXN - SOXX: Technical Analysis And Outlook For Semiconductors
2024-01-18 02:14:56 ET
Summary
- Chip stocks have been performing well in the market for the past decade, attracting investors.
- I discuss several technical indicators that I am watching to evaluate taking a position in iShares Semiconductor ETF.
- SOXX presents favorable momentum and oscillating indicators but may possess too much volatility.
- I am taking a position in the Fund based on these bullish indicators but urge caution from investors who may not be able to stomach the volatility.
- I highlight some threats to the technical thesis that include a divergence from trends, reversal of momentum, and a high RSI showing buyers near exhaustion.
Introduction
"Chip stocks," or companies that produce semiconductors and computer hardware, are very hot on Wall Street and have been for the last decade with seemingly no stopping in sight.
It's no wonder then that the iShares Semiconductor ETF ( SOXX ) has also been on a tear and has made investors eager to "invest in the future."
Here are the index's top holdings and their 10yr performance.
The index itself has done admirably over its lifetime, which has spurred a lot of speculators to pile in on the trade.
Brief Overview
SOXX is a passive index that holds US companies engaged in semiconductor manufacturing. Because of the high barriers to entry to the business, the index is very small -- at only 36 holdings.
It has a modest expense ratio of 0.35% p.a. and pays an annualized 0.80% dividend.
These companies are inherently "high-flying" tech businesses working in a field with ultra-high capital investment requirements , some of the most expensive R&D in the world, and the biggest payoffs for the winners.
See NVDA in the chart above for a reminder of what winning looks like.
My equity exposure is usually limited to broad-market index funds, but I tend to overweight sector funds from time to time if the technicals line up correctly. As the chart shows above, we are at an inflection point testing the old highs of 2021 and investors must decide to get in or get out before the trend is decided.
Let's take a look at the various technicals I watch and determine SOXX's outlook.
For reference, I will be standardizing the candles I use to 30m and will be looking at most indicators in a 30-day window when I show charts.
Moving Averages & Momentum
There is no shortage of momentum going into the semiconductor trade, and this is one of the largest factors in my recommendation. SOXX's moving average has been trending up for the last 200 days.
Seeking Alpha's Quant system has also picked up on this momentum and has issued an overall A+ for its momentum score.
Figure 4 (Seeking Alpha)
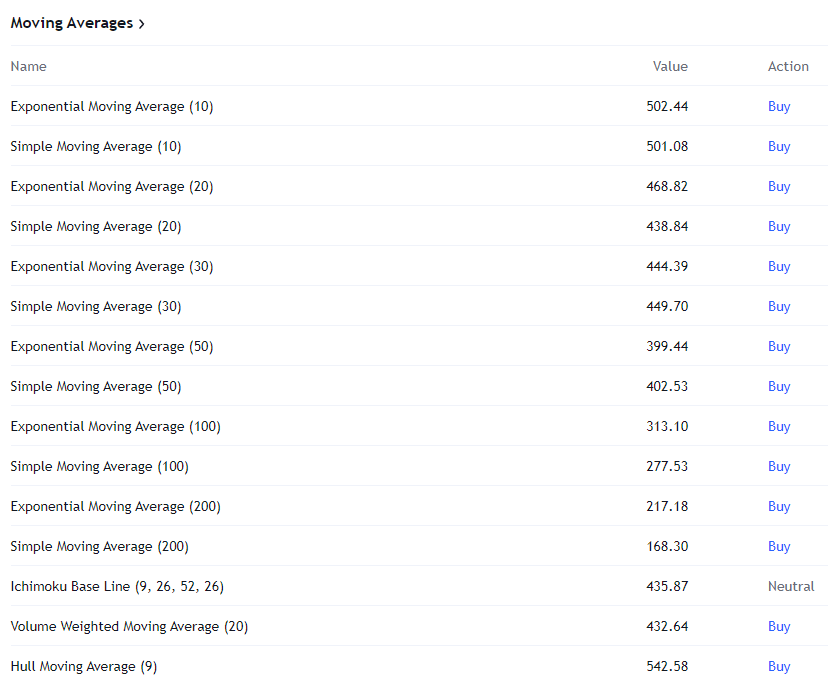
Looking at a larger sample of technical indicators for momentum and moving averages, we see that SOXX passes 14/15 of the indicators that TradingView tracks.
As far as momentum is concerned, SOXX is a buy. That's not the whole story, however.
Oscillators
Momentum is helpful, but not a complete outlook. I use several oscillating indicators as well. All of them currently point toward a strong buying opportunity right now for the short, medium, and long term.
Keep in mind here that these terms are very relative, with "short term" being accompanied by the 20-day average volume and "long term" with the 100-day average.
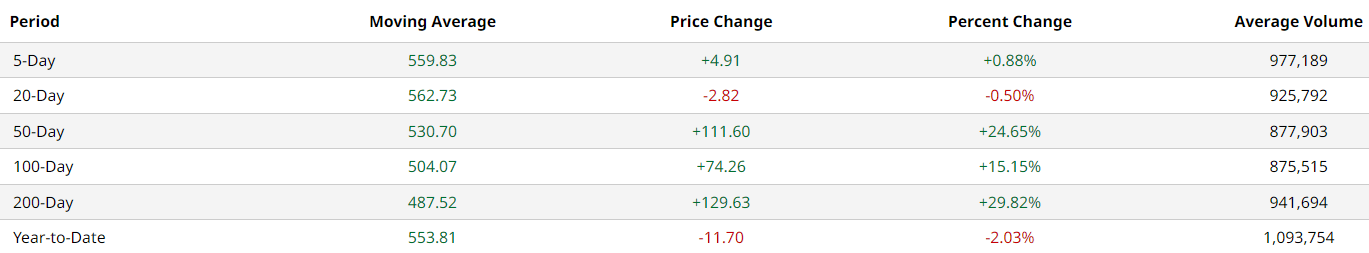
Figure 6 (Barchart)
That being said, I only evaluate holdings quarter to quarter and would not recommend holding for less than that based on these indicators.
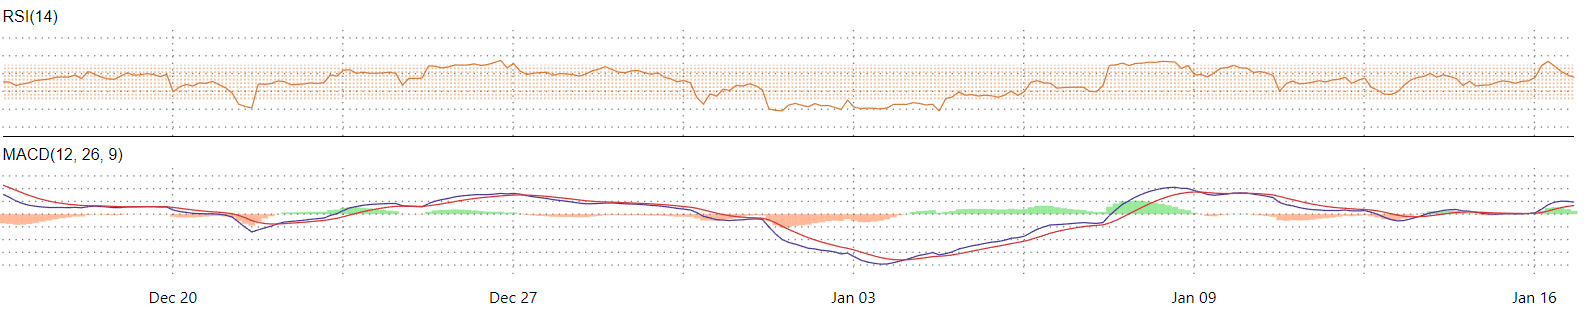
We are in positive territory on the MACD (12, 26, 9) indicator for now, but it is not a clearly bullish sign yet. It is still the most bullish indicator we have in this category, falling in line with the other indicators above.
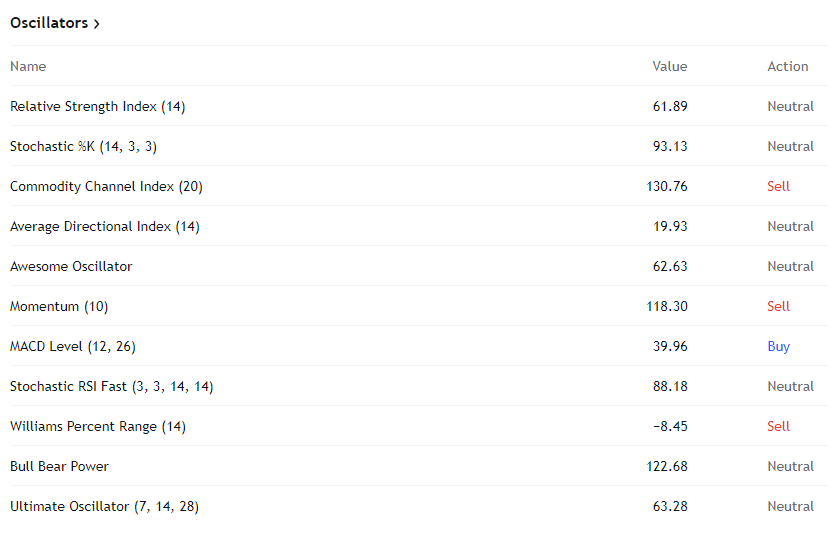
Other oscillating indicators do not show as favorable a view of SOXX, mostly presenting as neutral. Most notable among the indicators shown below is the Williams Percent Range (%R), which uses the relative strength index ((RSI)) to determine overbought or oversold conditions.
Currently, SOXX is approaching overbought, which could mean a slowing of momentum going forward as buyers are slowing their purchases. The %R shows a sell rating and is the most prominent bearish indicator for SOXX.
It has been rare in the last month for SOXX to trade below RSI 30, which would signal the stock being oversold. SOXX tends to trade at the higher end of its RSI, closer to 70, which is the threshold for being overbought. This means that we should expect to see poor %R indicators in a typical environment, so at least this doesn't come as a surprise to us.
The takeaway from the %R indicator is that we should be wary of buyers' exhaustion and be ready to exit the trade if buying dries up and the indicator turns to a strong sell or goes further into the negative territory, lower than -15.
Volatility
It should come as no surprise that SOXX is far more volatile than the general market, which is indicated by its abysmally low risk score in the Seeking Alpha Quant system.
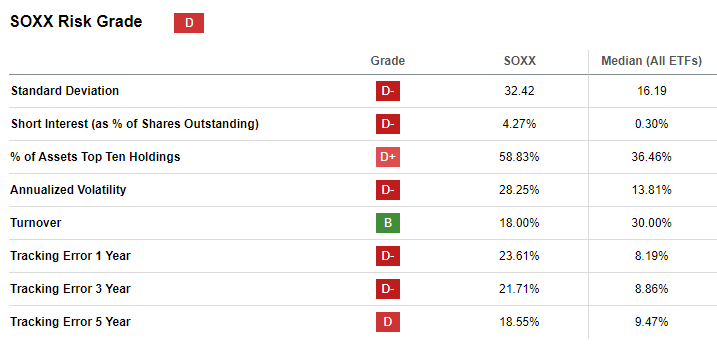
That being said, we've seen a convergence of the Bollinger bands recently, which should indicate lower volatility ahead. This is what I'm looking for as a contrarian indicator of the high standard deviation and annual volatility the fund endures.
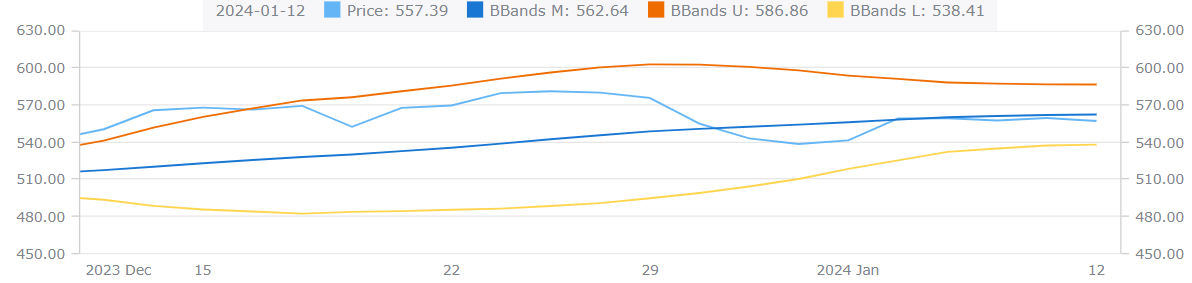
This volatility should be worrying, even if the indicator tells us that it's receding, as it comes back just as quickly as it goes.
Semiconductors are inherently more volatile than the rest of the market, so investors should note this going into the trade. The market has a lot of idiosyncratic risks due to the specialized nature of the business. This is easily seen in its volatility divergence from the broader market at times.
Conclusion
SOXX's technicals present it as a buy, both on the volatility and on the momentum fronts. There is still risk present in the form of poor volatility technicals and idiosyncratic risk inherent to the sector, and traders should be aware of this.
For the next quarter, I intend to take a small position in SOXX with no more than 5% of my total equity stake and advise others not to take on more risk than this in their own portfolios, or less if they consider themselves moderately risk-adverse.
The key indicators that could change my thesis:
- A slowdown of momentum, particularly if the price falls below the 50d and 200d simple moving averages and holds there for at least two trading weeks.
- Divergence of the lower Bollinger bands to beyond 480, signaling higher volatility.
- A shift to oversold on the RSI, holding below 30 for at least two trading weeks.
I will be watching this position closely and intend to re-evaluate next quarter.
Thanks for reading.
For further details see:
SOXX: Technical Analysis And Outlook For Semiconductors