CMCSA - SPDV: Yield And Valuation Look Good Performance And Quality Are Not
2023-07-25 14:22:26 ET
Summary
- AAM S&P 500 High Dividend Value ETF selects five S&P 500 stocks in every GICS sector.
- It implements a strategy based on dividends and free cash flow.
- The yield, valuation and dividend growth are attractive.
- However, quality and past performance are underwhelming.
This article series aims at evaluating ETFs (exchange-traded funds) regarding past performance and portfolio metrics. Reviews with updated data are posted when necessary.
SPDV strategy and portfolio
AAM S&P 500 High Dividend Value ETF ( SPDV ) started investing operations on 11/28/2017 and tracks the S&P 500 Dividend and Free Cash Flow Yield Index (SPDV5UP). It has a portfolio of 53 stocks, a 12-month distribution yield of 3.77% and a total expense ratio of 0.29%. Distributions are paid monthly.
As described on AAM website , to be eligible in the index, a company must be in the S&P 500 (SP500) and have positive dividend yield and free cash flow yield. Eligible companies are ranked on a score based on these two yields, then the top five companies in each GICS sector are included in the index. There may be less than five companies in a sector if less than five have both yields above zero. The index is reconstituted twice a year with all constituents in equal weight.
The fund invests almost exclusively in U.S. companies (98% of asset value). About 55% of the portfolio is in mid-cap stocks, and 42% in large caps. The portfolio turnover in the most recent fiscal year was 68%, which is quite high.
By definition of the underlying index, the 11 sectors are in equal weight at 9.09% after every rebalancing, except when less than 5 companies in a sector pass the selection rules. There are only 3 eligible stocks in utilities now, and the portfolio has 53 holdings on a theoretical maximum of 55. As a result of sector trends since the last rebalancing, 6 sectors are above the target weight now. The heaviest one is information technology with 11%. Consumer staples, industrials, healthcare, consumer discretionary and real estate are between 9.3% and 9.9%. Other sectors are underweight between 8% and 9%, except utilities, which is at 5.8%.
Positions are set in equal weight on each rebalancing, but they drift with price action. The current top 10 holdings are listed in the next table with fundamental ratios. These are the constituents with the highest momentum since the last rebalancing. They represent 22.9% of asset value and the largest holding weighs less than 3%, so risks related to individual stocks are low.
| Ticker |
| Name |
| Weight% |
| EPS growth %TTM |
| P/E TTM |
| P/E fwd |
| Yield% |
| Broadcom Inc. |
| 2.98 |
| 56.85 |
| 28.49 |
| 21.45 |
| 2.04 |
| Molson Coors Beverage Co. |
| 2.62 |
| -123.95 |
| N/A |
| 14.23 |
| 2.35 |
| Cardinal Health, Inc. |
| 2.4 |
| 149.12 |
| 53.36 |
| 16.20 |
| 2.15 |
| NRG Energy, Inc. |
| 2.22 |
| -149.57 |
| N/A |
| 7.03 |
| 3.99 |
| HP Inc. |
| 2.21 |
| -52.66 |
| 12.30 |
| 9.64 |
| 3.24 |
| Snap-on Inc. |
| 2.2 |
| 13.10 |
| 15.22 |
| 14.84 |
| 2.36 |
| Ford Motor Co. |
| 2.12 |
| -74.93 |
| 19.57 |
| 7.40 |
| 4.30 |
| Comcast Corp. |
| 2.1 |
| -57.53 |
| 32.82 |
| 11.94 |
| 2.68 |
| Hewlett Packard Enterprise Co. |
| 2.07 |
| -72.21 |
| 22.45 |
| 8.22 |
| 2.77 |
| United Parcel Service, Inc. |
| 2.02 |
| 1.02 |
| 15.22 |
| 17.62 |
| 3.44 |
Historical performance
Since 1/1/2018, SPDV has underperformed its parent index S&P 500 ( SPY ) by 6.1 percentage points in annualized return (see next table). Moreover, SPDV shows a higher risk measured in drawdown and volatility (standard deviation of monthly returns).
| Total Return |
| Annual.Return |
| Drawdown |
| Sharpe ratio |
| Volatility |
| SPDV |
| 35.68% |
| 5.64% |
| -43.84% |
| 0.23 |
| 20.94% |
| SPY |
| 85.45% |
| 11.75% |
| -33.72% |
| 0.55 |
| 18.32% |
Data calculated with Portfolio123
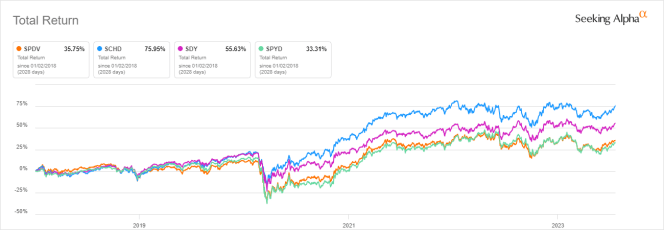
The next chart compares total returns since 1/1/2018 of SPDV and three popular large cap dividend ETFs:
- Schwab U.S. Dividend Equity ETF ( SCHD ),
- SPDR S&P Dividend ETF ( SDY ),
- SPDR Portfolio S&P 500 High Dividend ETF ( SPYD ).
SPDV lags SCHD and SDY in the same yield category (3-4%), and it is shortly ahead of SPYD, which has a higher yield (5.6%).
SPDV vs competitors since 2018 (Seeking Alpha)
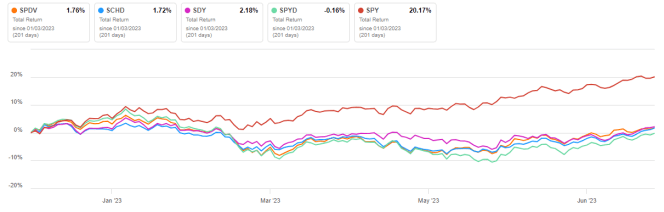
In 2023 to date, SPDV is on par with SCHD and lags the S&P 500 by over 18%.
SPDV vs competitors and SPY, year-to-date (Seeking Alpha)
The annual sum of distributions per share has increased from $0.86 in 2018 to $1.09 in 2022. This 26.7% growth beats the cumulative inflation in the same time: about 18%, based on CPI.
SPDV distribution history (Seeking Alpha)
Comparing SPDV with a reference strategy
In previous articles, I have shown how three factors may help cut the risk in a dividend portfolio: Return on Assets , Piotroski F-score , Altman Z-score , Payout Ratio.
The next table compares SPDV since inception with a subset of the S&P 500: stocks with an above-average dividend yield, an above-average ROA, a good Altman Z-score, a good Piotroski F-score and a sustainable payout ratio. The subset is rebalanced annually to make it comparable to a passive index.
| Total Return |
| Annual.Return |
| Drawdown |
| Sharpe ratio |
| Volatility |
| SPDV |
| 35.68% |
| 5.64% |
| -43.84% |
| 0.23 |
| 20.94% |
| Dividend & quality subset |
| 76.85% |
| 10.80% |
| -34.95% |
| 0.5 |
| 18.55% |
Past performance is not a guarantee of future returns. Data Source: Portfolio123
SPDV underperforms this dividend quality benchmark by a wide margin. However, ETF performance is real and the subset is simulated. My core portfolio holds 14 stocks selected in this subset (more info at the end of this post).
Scanning the current portfolio
SPDV is much cheaper than the S&P 500 regarding aggregate valuation ratios, as reported in the next table.
| SPDV |
| SPY |
| Price / Earnings TTM |
| 12.75 |
| 22.83 |
| Price / Book |
| 1.78 |
| 4.02 |
| Price / Sales |
| 0.71 |
| 2.55 |
| Price / Cash Flow |
| 7.75 |
| 16.12 |
I have scanned SPDV holdings with the quality metrics described in the previous paragraph. In my ETF reviews, risky stocks are companies with at least 2 red flags among: bad Piotroski score, negative ROA, unsustainable payout ratio, bad or dubious Altman Z-score, excluding financials and real estate where these metrics are unreliable. Regarding these criteria, 12 stocks out of 53 are risky. They weigh about 22.8% of asset value, which is a bad point.
Based on my calculations reported in the next table, aggregate quality metrics are inferior to the benchmark.
| SPDV |
| SPY |
| Atman Z-score |
| 2.5 |
| 3.55 |
| Piotroski F-score |
| 5.6 |
| 5.9 |
| ROA % TTM |
| 5.83 |
| 7.33 |
Takeaway
AAM S&P 500 High Dividend Value ETF selects five S&P 500 stocks in every GICS sector, based on dividend yield and free cash flow. It implements an equal-weight methodology, resulting in a well-diversified portfolio across holdings and sectors. The yield, valuation and dividend-growth metrics are attractive, but quality and past performance are underwhelming.
For further details see:
SPDV: Yield And Valuation Look Good, Performance And Quality Are Not