SCHG - SPGP Looks Less Attractive Than QQQM And SCHG
2023-05-22 12:39:28 ET
Summary
- Invesco S&P 500 GARP ETF is likely to underperform the S&P 500 in 2023; SCHG or QQQM are preferable alternatives.
- I believe there is a strong likelihood that the stock market will emerge from a bear market, with expectations that a bull run will develop in the second half of the year.
- Consider investing in high-beta ETFs for maximum gains during a potential bull market.
As the markets are in recovery mode and have a high chance of forming a bull trend, now is not the time to chase Invesco S&P 500 GARP ETF ( SPGP ). Instead, ETFs with a high beta, such as the Schwab U.S. Large-Cap Growth ETF ( SCHG ) and the Invesco Nasdaq 100 ETF ( QQQM ), may be a better bet. SPGP is expected to underperform the broader market index and high-beta ETFs for a variety of reasons, including its significant portfolio exposure to the struggling financial and healthcare sectors, as well as a lack of emphasis on high-growth sectors such as technology and consumer cyclical.
US Stock Market Is In a Recovery Mode
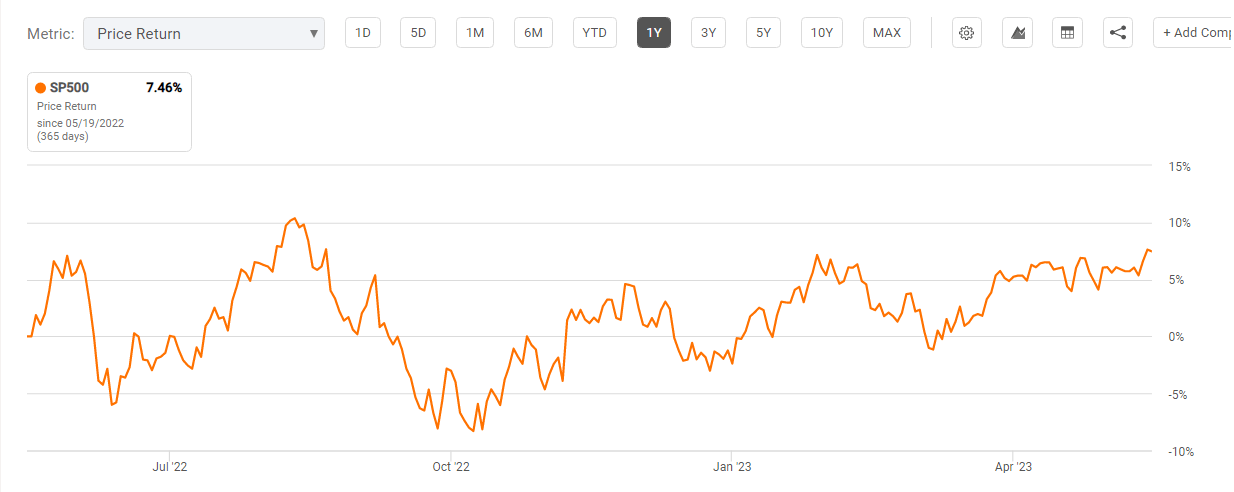
S&P 500 price change in twelve months (Seeking Alpha)
Let's first determine whether the market has already bottomed or if the current uptrend is a bear market rally before we look at the best ETF for 2023 and the years to come. I believe the US stock market has bottomed out in 2022 and has already taken into account the effects of rising interest rates, an impending recession, and dim prospects for earnings growth.
The current uptrend isn't a bear market rally therefore, since it is being supported by fundamental factors like the Fed's potential soft landing, better-than-expected earnings, and faster-than-expected economic growth. As for the Fed, I think it has either reached its terminal level or is very close to it. Fed Chairman Powell also stated that the central bank is on the verge of or has already reached its rate-hike target. Furthermore, with the financial system under pressure and inflation at its lowest level in two years, there is a good chance that the Fed will either pause or raise rates only slightly in June. 82% of traders also expect the Fed to leave interest rates unchanged in June, with the majority expecting a rate cut in the second half. Fortunately, given a strong labor market with the unemployment rate at the lowest level in 53 years, there are also strong odds of a soft landing and a brief economic contraction. Fed Chairman Powell also stated that instead of job losses, the labor market could achieve a better balance by reducing the number of open positions.
Another bullish sign is better-than-expected earnings. S&P 500’s earnings, which fell only 2.5% in the first quarter compared to last year, were initially expected to fall in high single-digit to double-digit percentages. Earnings are expected to remain under pressure in the second quarter, but they are expected to rise in the high single-digit percentage in the second half. The stronger-than-expected earnings growth is attributed robust performance of consumer cyclical, technology, and a few other sectors.
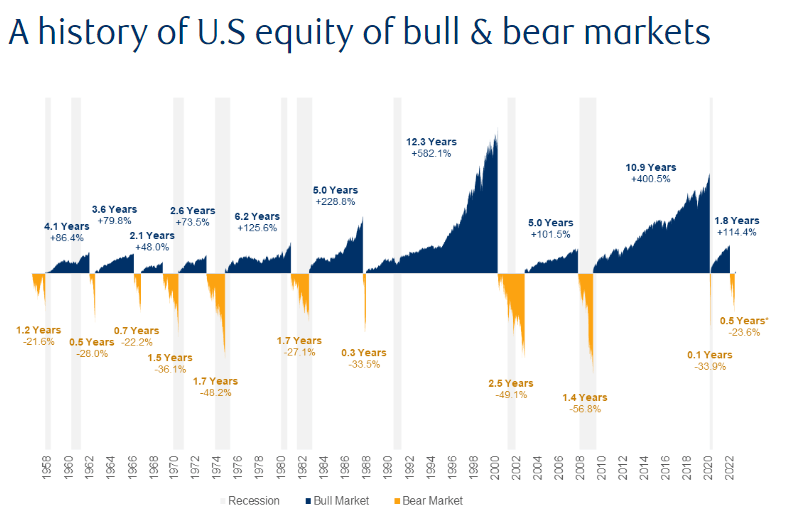
Bear and bull market history (rbcgam.com)
Furthermore, history shows that stocks always experience long-term bull runs after a bear market. The longest bull market occurred in the 1990s, when the S&P 500 surged around 580% in 12 years, while the second largest occurred in the last decade. The graph above also shows a pattern in which the market always recovers significantly the year following a bear market. Therefore, if the Fed decides to pause rates in the near future and make a cut in late 2023, there is a good chance that the US stock market will experience a strong bull run in 2023 and beyond in my view.
Why Doesn't SPGP Look Like a Solid Play in 2023?
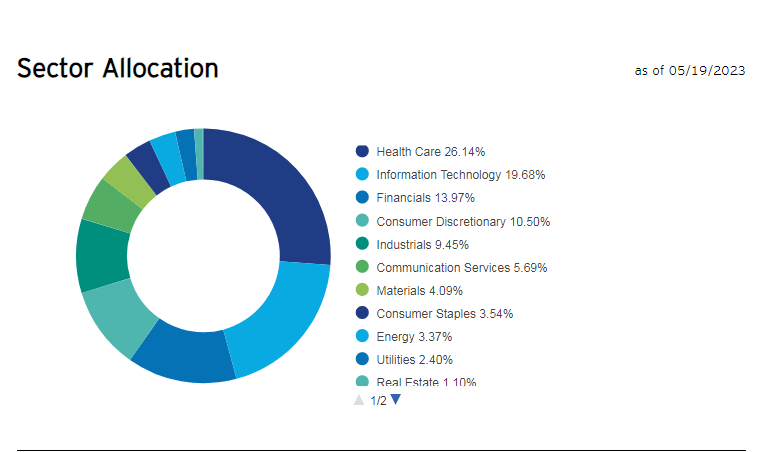
SPGP portfolio breakdown (invesco.com)
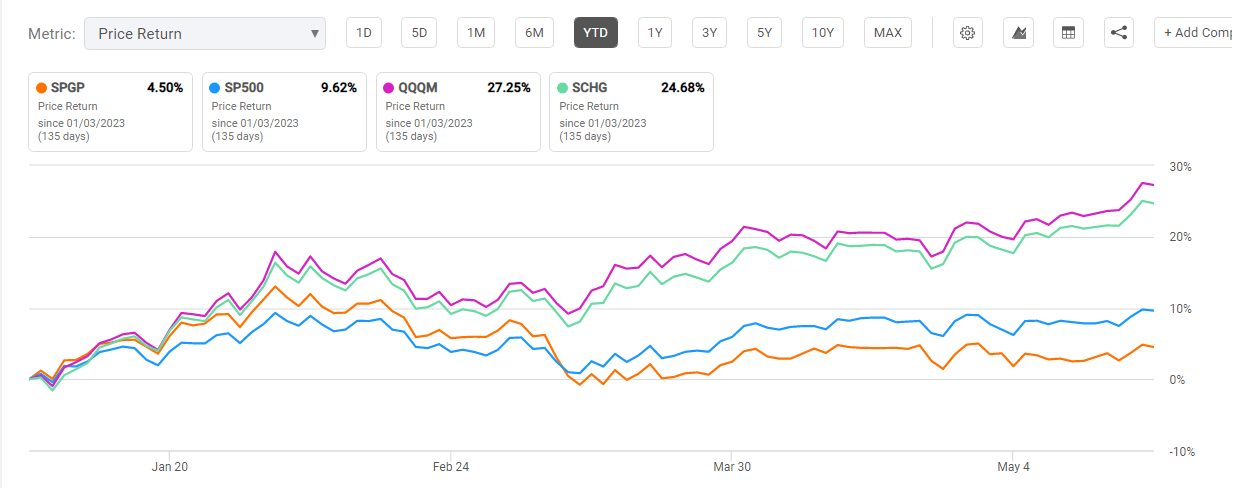
SPGP is a top-tier ETF with a solid methodology that begins by identifying the top 150 S&P 500 stocks with higher earnings and growth potential. The top 75 stocks with higher quality and value characteristics from among the 150 are then selected based on the Quality & Value (QV) Composite Score. When it comes to price performance, the ETF outperformed the broader market index by 5% and high-beta tech-focused ETFs by a large percentage in 2022. However, it has continued to underperform the broader market index and high-beta ETFs by a significant margin since the beginning of this year.
SPGP price change vs. S&P 500, QQQM and SCHG (Seeking Alpha)
The outperformance in 2022 was attributed to the portfolio's exposure to the finance and healthcare sectors, which accounted for roughly 40% of the total portfolio. In 2023, both of these sectors faced challenges, and they lagged behind the S&P 500 index in terms of earnings and share price performance. The S&P 500 financial sector index, which has lost about 5% of its value so far in 2023, has been under pressure as a result of the Federal Reserve's rate hike policy. In the first quarter of 2022, a number of regional banks already failed , and numerous other financial services firms announced significant provisions for credit losses. Additionally, tight market conditions and declining liquidity have decreased their lending ability. For a detailed analysis of the financial sector, please read my article, “ Vanguard Financials ETF: A Gamble For Dip Buyers .” On the other hand, due to dwindling potential for earnings growth, the S&P 500 healthcare index is also in the red so far in 2023. According to FactSet data, the healthcare sector’s earnings plunged 16% in the first quarter, and Wall Street analysts anticipate a 9.7% decline for the full year.
2023 earnings forecast (FactSet)
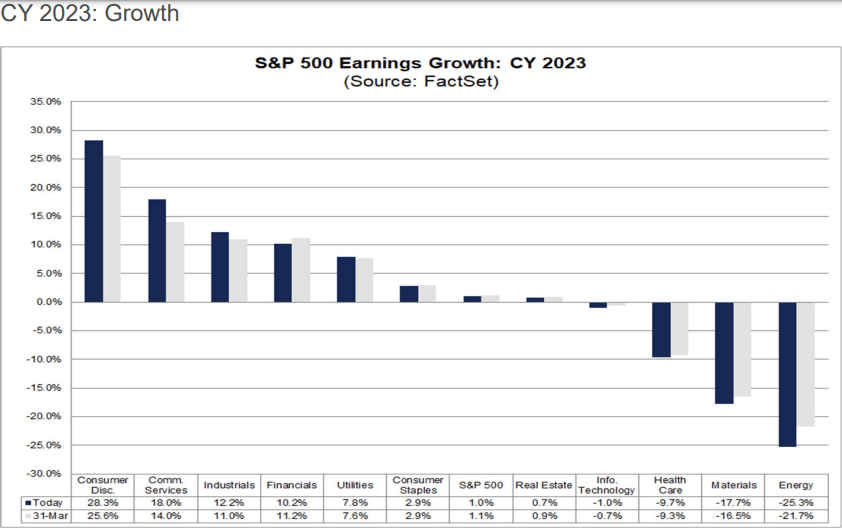
Furthermore, the ETF's portfolio is also concentrated in the basic materials, energy, utility, and real estate sectors, which account for approximately 10% of the portfolio weight. According to FactSet data, the materials and energy sectors are also expected to be the worst performers in terms of earnings growth in 2023. Data shows that the energy sector is likely to experience a 25% year-over-year decline in earnings in 2023 while the materials sector is expected to see a 17% decline. You can learn about the fundamentals of the energy sector by reading my article, " VDE: A Major Share Price Correction Could Be On The Way ." Although about 20% of its portfolio weight is allocated to technology stocks, the portfolio does not include stocks from the consumer cyclical sector, which is likely to outperform all other S&P 500 sectors in terms of share price and earnings growth in 2023.
Why SCHG and QQQM are Solid Bets
SCGH and QQQM could be the best long-term ETFs to profit from the recovery and potential bull run. This is due to their emphasis on high beta large-cap stocks from the technology, consumer cyclical, and communication sectors. In the case of SCHG, the tech sector makes up about 45% of the company's portfolio, while the consumer cyclical and communications sectors collectively make up 23%. On the other hand, QQQM's portfolio is more heavily weighted toward large-cap technology, consumer cyclical, and communication stocks, which together make up close to 80% of the total holdings.
These two ETFs were hit hard in 2022, but they have outperformed the broader market index by a significant margin so far in 2023. In fact, both ETFs are technically in bull territory, having risen more than 25% from their recent lows. Strengthening fundamentals are supporting the development of a strong bull run. For instance, large-cap tech stock earnings have not only exceeded analyst expectations but have also been the main factor in slowing the decline in S&P 500 earnings. For instance, the earnings per share surprises from Microsoft ( MSFT ), Apple ( AAPL ), NVIDIA ( NVDA ) and Intel ( INTC ) have all significantly slowed the decline in the index's earnings. The unexpected increase in Amazon's ( AMZN ) earnings per share ($0.31 vs. $0.21) also had a significant impact on the sector's and the S&P 500's performance.
Quant Rating
Quant score SPGP (Seeking Alpha)
Invesco S&P 500 GARP ETF received a quant score of 3.91 and a buy recommendation. Its momentum grade fell from A+ to A- in the last three months likely due to underperformance versus the S&P 500. Technically, a low momentum score indicates a lower likelihood of outperforming market indices. Another factor that makes SPGP less appealing is the expense ratio. Its expense ratio of 0.33% is significantly higher than QQQM's 0.15% and SCHG's 0.04%.
Quant rating QQQM (Seeking Alpha)
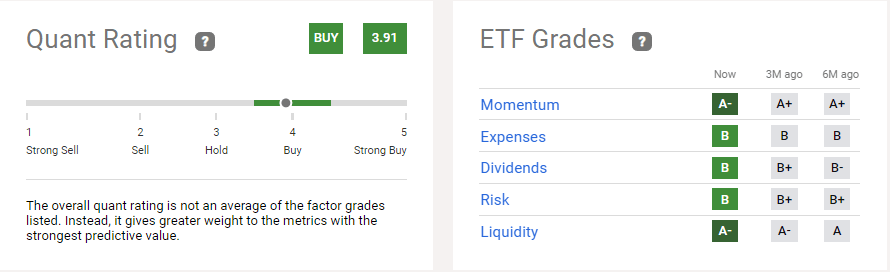
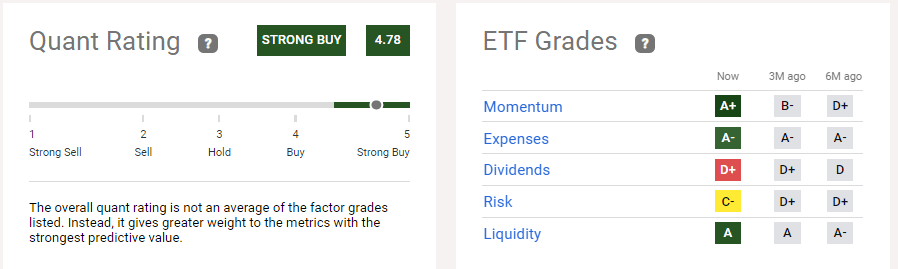
On the other hand, QQQM and SCHG have nearly similar quant ratings. With a quant score of 4.78 for QQQM and 4.68 for SCHG, both stocks received a strong buy recommendation. Both ETFs received an A plus on momentum, indicating that they have a greater chance of outperforming the broad market index. They also receive high marks on the expense factor because of their low expense ratios. Another aspect that favors QQQM and SCHG over SPGP is their greater liquidity.
In Conclusion
Investing in ETFs with the potential to generate higher returns may be a good idea when stocks are expected to rebound and start a bull trend. ETFs made up of value stocks typically outperform the market during bear markets, but underperform during bull runs. Therefore, it may be wise to favor high-beta ETFs like QQQM and SCHG in order to take full advantage of the recovery period and a potential long-term bull market.
For further details see:
SPGP Looks Less Attractive Than QQQM And SCHG