EQRR - SPHB: High Risk Low Returns And Questionable Quality
2023-11-21 06:04:06 ET
Summary
- SPHB tracks 100 high-beta S&P 500 stocks. Launched in May 2011, the ETF has a reasonable 0.25% expense ratio, but has failed to gain much interest from an AUM perspective.
- Despite an upward-trending market over the last ten years, SPHB has lagged behind SPY by 30% while featuring, as expected, much higher volatility. Higher risk did not equal higher rewards.
- One likely reason is poor quality. I calculated a 8.26/10 profit score for SPHB, well behind SPY's 9.43/10 score, and backed by significant differences in ROTC and ROE margins.
- Evidently, the market's bread-and-butter stocks are neither high- or low-beta. By avoiding them, SPHB and SPLV, its low-volatility counterpart, are destined to underperform over the long run.
- Short-term opportunities may still exist, but there currently isn't enough of a safety net to justify a buy rating today.
Investment Thesis
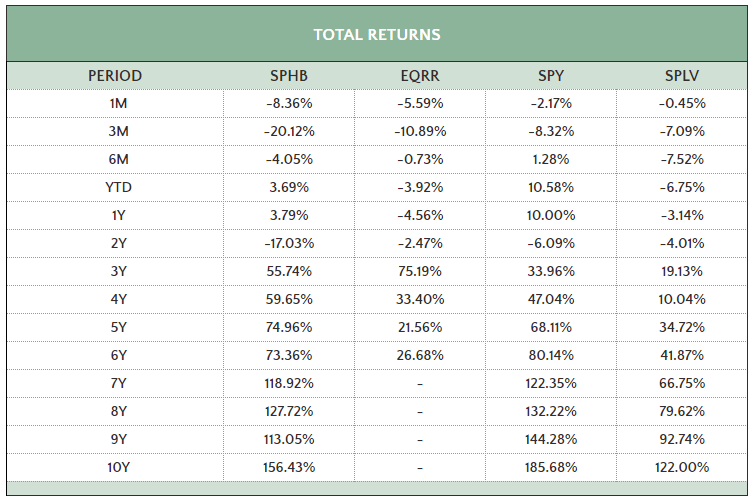
The Invesco S&P 500 High Beta ETF ( SPHB ) has lagged the SPDR S&P 500 ETF ( SPY ) by nearly 30% over the last decade, a surprising statistic, considering how an investment in SPY has almost tripled in value during that period. For the significant amount of extra risk taken on, SPHB shareholders should have seen better returns, hence my previous conclusion that it likely isn't a great long-term option. However, SPHB is currently trading at a cheaper valuation than SPY despite being 38% Technology, so I also wanted to evaluate it from a short-term perspective. I look forward to reviewing the latest numbers in more detail below.
SPHB Overview
Strategy Discussion and Performance
SPHB tracks the S&P 500 High Beta Index, selecting the 100 most volatile stocks in the S&P 500 Index over the previous twelve months, as measured by daily price changes. The Index is volatility-weighted with weights between 0.73% and 1.49%, so although it's not quite an equal-weight portfolio, it doesn't have the same concentration as market-cap-weighted ETFs like SPY. This feature is negative for proponents of the Magnificent Seven ( AAPL , MSFT , GOOGL , AMZN , NVDA , TSLA , META ) and why SPHB has underperformed. In contrast, those concerned about these stocks' valuations may view this composition positively, as SPHB's combined exposure is just 6.56%.
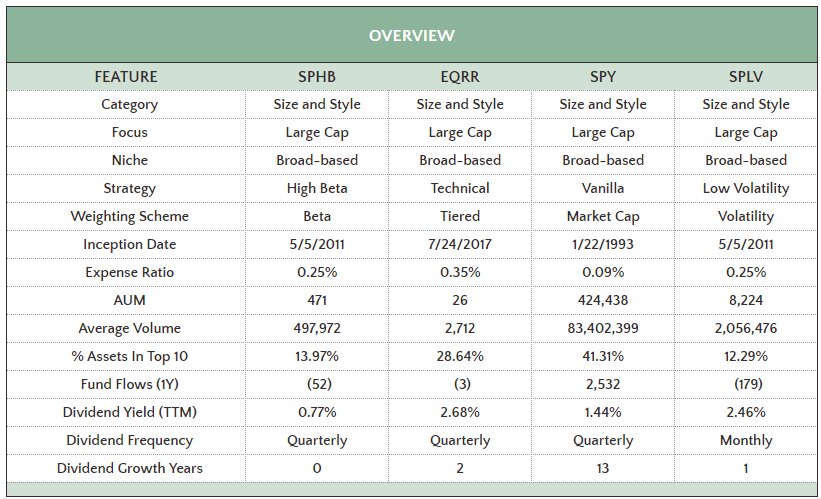
SPHB is the only ETF I track with a High Beta strategy, according to FactSet Research. However, there are some with similar five-year betas. For example, the ProShares Equities for Rising Rates ETF ( EQRR ) has a 1.39 five-year beta compared to SPHB's 1.45. I will also compare SPHB with SPY and the Invesco S&P 500 Low Volatility ETF ( SPLV ) to contrast the blend and low- and high-beta strategies. Here's a quick side-by-side overview of the four ETFs:
As shown, Invesco launched SPHB and SPLV on the same date with the same 0.25% expense ratio. However, the low-volatility strategy has proven more popular, evidenced by SPLV's $8.22 billion in assets under management vs. $471 million for SPHB. EQRR has yet to garner much interest, while SPY is the first U.S.-based ETF launched 30 years ago.
It's logical to think that SPY's returns should fall somewhere between SPHB's and SPLV's. However, a key difference is the weighting scheme. Recall from the first table how SPY is market-cap-weighted, while SPHB and SPLV are beta/volatility-weighted. This difference significantly impacts how well an ETF ranks on other factors, namely quality. Like them or not, the Magnificent Seven are all high-quality, and I don't think avoiding them is the answer.
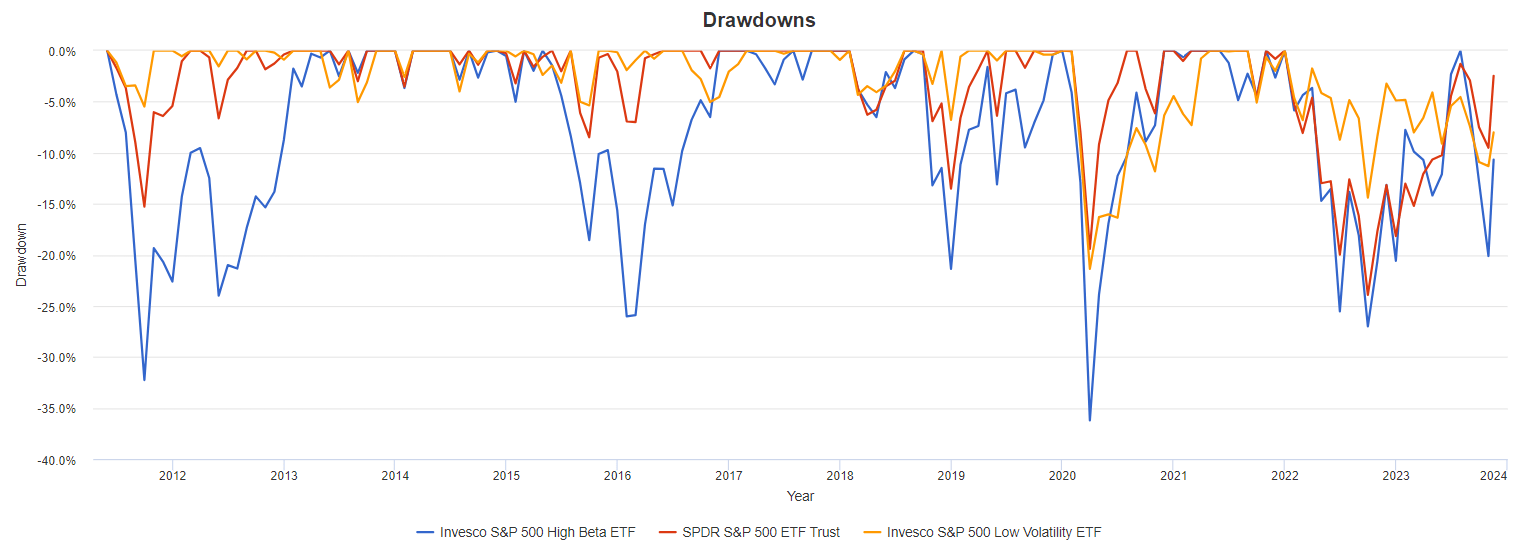
One additional feature to consider is SPHB's large historical drawdowns. The graph below shows six periods when SPHB declined by more than 20%, so I suggest being extremely greedy with this ETF. Currently, it's off 10.68% since August vs. 1.18% and 3.63% for SPY and SPLV, so by that measure, it's probably not the best time to buy.
Portfolio Composition By Sector
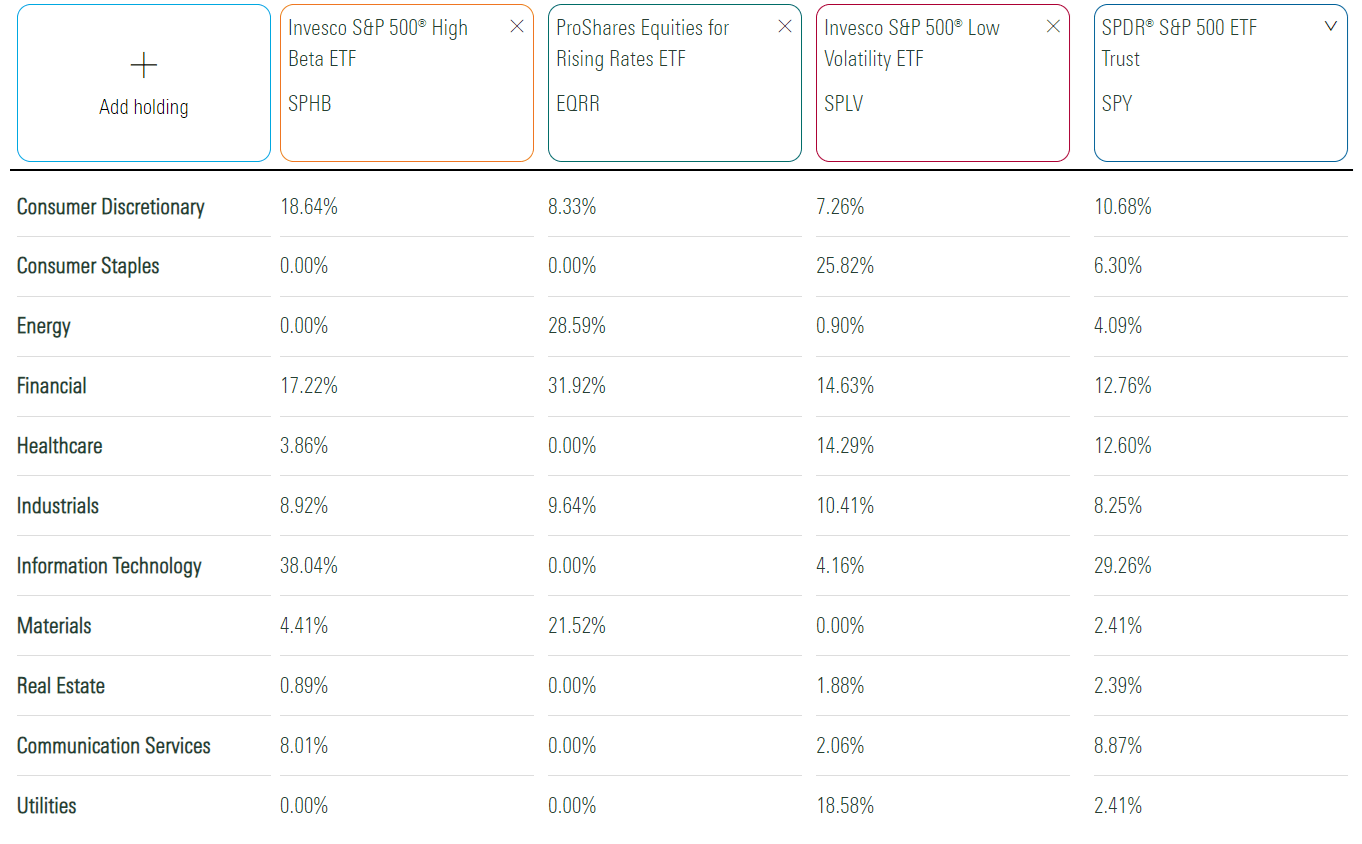
The following table highlights sector exposure differences between SPHB, EQRR, SPLV, and SPY. You can see that SPHB and EQRR achieve their high betas differently. SPHB relies on 38.04% Technology, while EQRR is highly concentrated in Energy, Financials, and Materials.
SPHB only uses one year's worth of price changes to measure volatility, so these allocations are bound to change. However, it's unlikely it will ever overweight defensive sectors like Consumer Staples and Utilities, which are underrepresented in number and market cap in the S&P 500 Index. In contrast, 66 S&P 500 Technology stocks represent 29.20% of the Index, so I expect SPHB to hold many tech stocks for the foreseeable future.
SPHB Analysis
The following table highlights SPHB's fundamentals by its top 25 industries. I chose to analyze this way because SPHB's top 25 holdings only account for 30.47% of the portfolio, so it would give readers little appreciation for how the fund is constructed. This view covers 85.02% of the portfolio, about 3% more than SPLV but 14% less than EQRR.
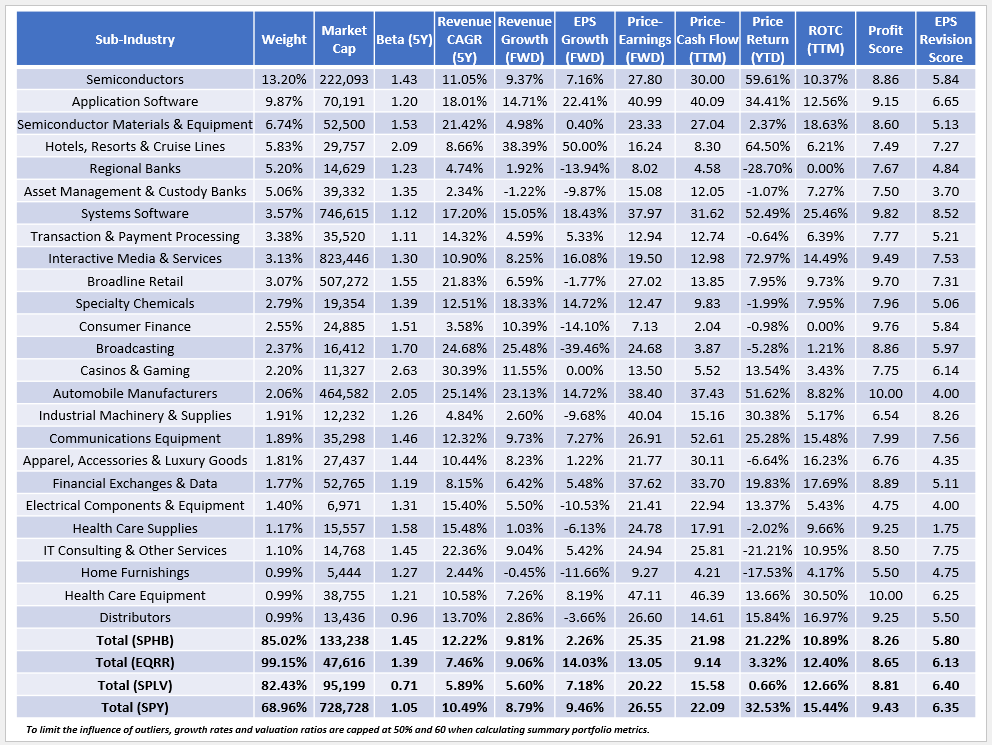
Ironically, by moving away from the Magnificent Seven stocks, SPHB and SPLV are less diversified than SPY, which has only 68.96% of assets in its top 25 industries. However, the five-year beta figures check out. By multiplying SPHB's 1.45 by SPLV's 0.71, we get 1.03, which is very close to SPY's 1.05. Both ETFs do a sufficient job of representing the extremes. Unfortunately, little else reconciles. The average estimated earnings per share growth for the two ETFs is 4.72% vs. 9.46%, and the average profitability score takes a big hit (8.54/10 vs. 9.43/10). Style Indices tracking the S&P 500 ( SPYG , SPYV ) don't have this issue.
Another surprising find was SPHB's low 2.26% estimated earnings per share growth rate. The cause is Financials, with sub-industries like Regional Banks and presenting negative growth. Furthermore, the sub-industry has been a poor performer this year and over the long run. Consider how, since May 2006, the iShares U.S. Regional Banks ETF ( IAT ) lost 0.03% in total return and realized about 65% more volatility than SPY.
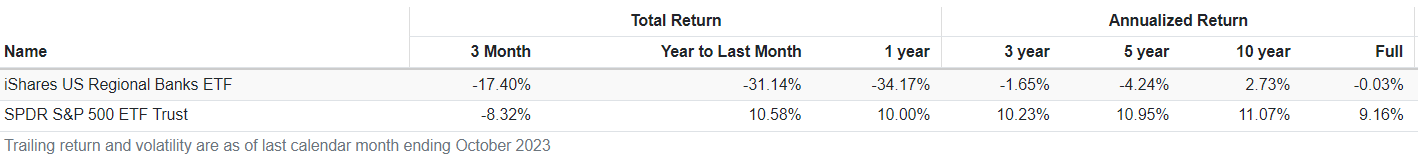
SPHB's 8.26/10 profit score is the most significant deterrent for me. For a large-cap ETF, it's nowhere near my 9.10-9.20/10 minimum score that I use to define high-quality, and I suspect it's why it's underperformed. I've compiled a summary of metrics that go into calculating that score, and it's clear SPHB's ROE and ROTC margins are weak, as is its 0.66 asset turnover ratio, which measures how efficiently its holdings use its assets to generate sales.
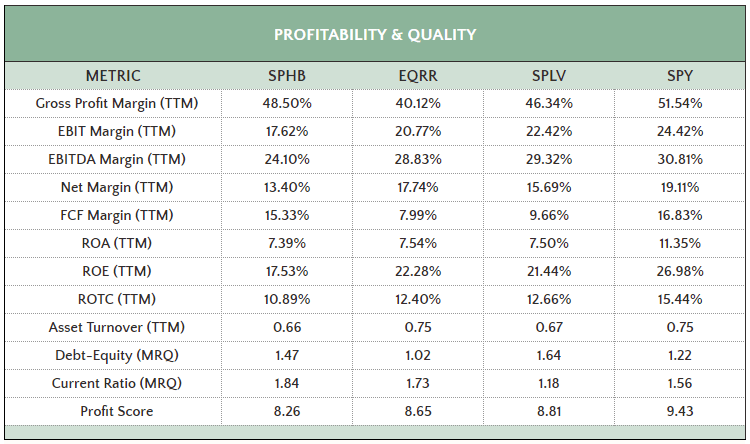
Investment Recommendation
Buying SPHB doesn't make much sense today, either for the short- or long-term. For a large-cap fund, it's poor quality, evidenced by weak ROE and ROTC margins and an 8.26/10 profit score. Furthermore, SPHB has low estimated EPS growth and is only down approximately 10% since August, which isn't enough of a safety net, given its history of 20%+ drawdowns. Therefore, I recommend avoiding SPHB and look forward to continuing the discussion in the comments section below.
For further details see:
SPHB: High Risk, Low Returns, And Questionable Quality