SPHB - SPHB: Risk Adjusted Underperformance Set To Continue
2023-11-21 02:03:36 ET
Summary
- The Invesco S&P 500 High Beta ETF seeks to track the S&P 500 High Beta Index, consisting of the 100 stocks with the highest beta.
- SPHB has underperformed the S&P 500 on both an absolute and risk-adjusted basis, but its exposure to mid-cap and small cap companies has been a key driver.
- SPHB has underperformed a blend of large cap, mid-cap, and small cap companies on a risk adjusted basis since inception.
- Financial research suggests that high beta stocks underperform on a risk adjusted basis.
- I believe SPHB will continue to underperform going forward on a risk adjusted basis.
ETF Overview
The Invesco S&P 500 High Beta ETF ( SPHB ) seeks to provide investment performance that tracks the S&P 500 High Beta Index. The Index consists of the 100 stocks from the S&P 500 Index with the highest beta over the past 12 months.
SPHB has ~$459 million in net assets and charges a total expense ratio of 0.25%. Fund characteristics include a trailing P/E ratio of 18x, a forward P/E ratio of 15.1x, and a 12m trailing distribution rate of 0.76%
Management Fee
SPHB has a fairly low total expense ratio of 0.25%. To put that into context the average equity ETF expense ratio is ~0.16%. Comparably, the SPDR S&P 500 ETF Trust ( SPY ) charges a total expense ratio of ~0.09% while the iShares S&P 500 Growth ETF ( IVW ) charges a total expense ratio of 0.18%. SPHB's fee of 0.25% strikes me as fairly reasonable given these comparisons.
Index Methodology
The S&P 500 High Beta Index consists of the ~100 constituents of the S&P 500 Index that have the highest beta of the past 12 months. The underlying Index then weights each constituent security in proportion to its beta, with the highest beta securities receiving the greatest weights in the Index. The Index is rebalanced and reconstituted quarterly in February, May, August and November.
Historical Performance
SPHB launched in May 2011 and has underperformed the S&P 500 Index since then. Since inception, SPHB has delivered a total return of 247% compared to a total return of 326% delivered by the S&P 500.
SPHB's relative is even worse on a risk adjusted basis. Since inception, SPHB has realized an average 30 day volatility of 24.3% compared to a realized average 30 day volatility of 14.98% for the S&P 500. The result of this is SPHB has delivered significantly worse risk adjusted performance than the S&P 500. Since inception, SPHB has realized an average 3 year trailing sharpe ratio of 0.71. Comparably, over the same period the S&P 500 has realized an average 3 year trailing sharpe ratio of 1.08.
However, the S&P 500 is not the only benchmark to consider for SPHB as the fund has significantly more exposure to mid-cap and small cap companies than the S&P 500 as a result of weighting holdings based on beta and not market cap. SPHB has total exposure to mid-cap companies of 52.9% compared to 17.5% for the S&P 500. SPHB also has 11.6% exposure to small cap companies while the S&P 500 has just 0.35% exposure to small cap companies.
In order to get a sense of market cap adjusted performance, we can consider how a portfolio that was initially allocated 52.9% to mid-caps, 11.6% to small caps, and 35.5% to large caps would have performed since SPHB's inception (assuming no rebalancing.) This hypothetical portfolio would have delivered a total return of ~247.7% which is very close to the 247.4% total return realized by SPHB since inception. However, it should be noted that SPHB's average historical 30 day volatility of 24.3% is still well above the average realized 30 day volatility of mid-cap (16.1%), small cap (19.7%), and large cap (14.98%). Thus, while SPHB performance looks better on an absolute basis when adjusting for market cap exposure, it has underperformed on a risk adjusted basis.
Research Suggests Betting On Beta Is A Bad Idea
A significant amount of financial research to date suggests that beta on beta is a bad idea. In 2014, AQR published a piece in the Journal of Financial Economic showing that historically investors would have benefited by betting against beta across most markets including equity markets. The rationale for why high beta investments tend to underperform on a risk adjusted basis is that investors such as individuals, pension funds, and mutual funds are constrained in the leverage they can take. As a result of this, these investors tend to overweight risky securities to generate higher returns.
SPHB is unique in that it is one of the only ETFs which targets high beta stocks. Comparably, there is a long list of low beta and vol volatility ETFs such as the Invesco S&P 500 Low Volatility ETF ( SPLV ), the iShares MSCI USA Min Vol Factor ETF ( USMV ), the Vanguard U.S. Minimum Volatility ETF ( VFMV ), and many others.
Holdings Analysis
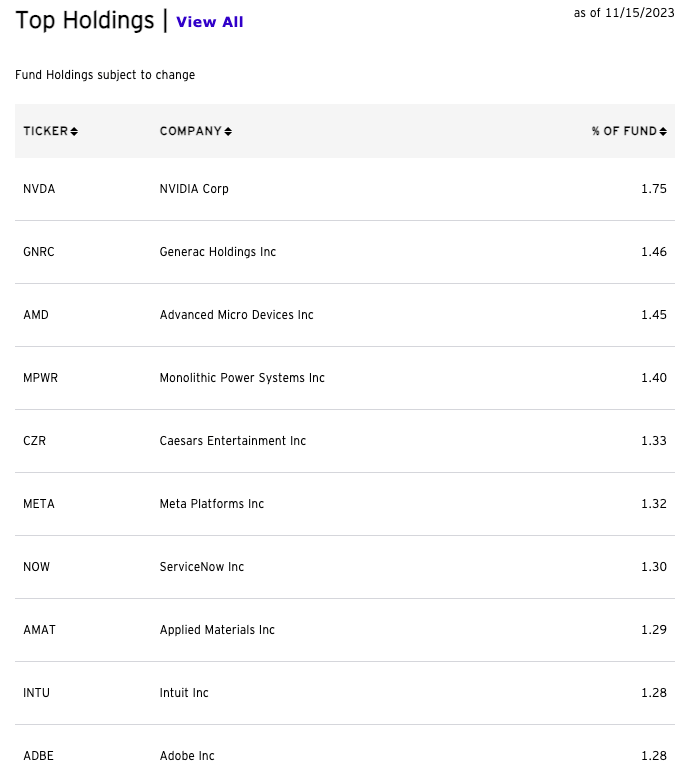
As shown by the table below, SPHB is well diversified with the top 5 holdings accounting for just 7.4% of the fund. Comparably, the top 5 holdings of the S&P 500 account for 23% of the Index. The largest holding in SPHB is Nvidia ( NVDA ) which accounts for 1.75% of the fund.
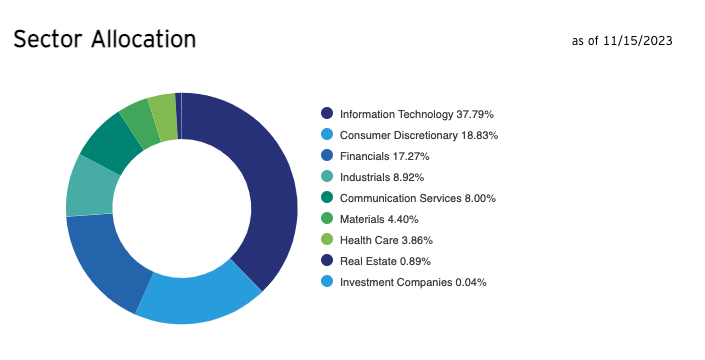
In terms of sector allocation SPHB is significantly overweight technology and consumer discretionary. SPHB has ~37.8% exposure to technology compared to a ~28.5% weighting in the S&P 500. SPHB has ~18.8% exposure to the consumer discretionary sector while the S&P 500 has a weight of 10.7%. These overweights are offset by significant underweights to the health care, consumer staples, utilities, and energy sectors.
While SPHB is overweight the technology sector, it is underweight mega cap tech such as Apple, Microsoft, Amazon, Nvidia, Alphabet, and others. While these 5 companies are all held by SPHB, the combined weight is just 6.05%. Comparably, these 5 companies account for 25.3% of the S&P 500. The reason for this is that the SPHB weights constituents based on beta and not market capitalization. Thus, SPHB tends to have more exposure to higher risk smaller capitalization companies. Evidence for this dynamic can be seen by the fact that SPHB has total exposure to mid-cap companies of 52.9% compared to 17.5% for the S&P 500. SPHB also has 11.6% exposure to small cap companies while the S&P 500 has just 0.35% exposure to small cap companies.
Conclusion
SPHB is a unique fund in that it targets high beta equity exposure. While there are many low volatility / low beta ETFs, SPHB stands out as one of the only ETFs targeting high beta stocks.
SPHB has a reasonable management fee of 0.25%. The fund has posted very poor historical performance relative to the S&P 500 on both an absolute and risk adjusted basis. However, comparing SPHB to the S&P 500 is not a fair comparison as SPHB has considerably more exposure to mid-cap and small cap companies due to its weighting methodology. On an absolute return basis SPHB has delivered a total return which is more inline with its market cap exposures. However, it has done so with significantly higher levels of risk and thus has underperformed on a risk adjusted basis.
SPHB's risk adjusted underperformance is inline with what is to be expected of high beta stocks based on historical research which suggests high beta stocks underperform on a risk adjusted basis.
While SPHB is significantly overweight the technology sector, is significantly underweight the mega cap companies such as Apple, Microsoft, Nvidia, Alphabet, and others. This is a result of the fact that SPHB weights its holdings based on beta. The result of this is that SPHB holdings skew towards the smaller companies in the S&P 500.
I believe that SPHB is poised to continue underperforming on a risk adjusted basis given its bias to high beta stocks. Investors who want to express an overweight to mid-cap and small cap companies would be better served by allocating some S&P 500 exposure to capitalization weighted index products such as IWM and IWR as opposed to owning SPHB.
For further details see:
SPHB: Risk Adjusted Underperformance Set To Continue