HDV - SPHD: Don't Assume This 5.27% Yielding S&P 500 Dividend ETF Is High Quality
2023-10-27 16:52:36 ET
Summary
- Since my cautionary review in February, SPHD has underperformed the broader market by 14%. Investors continue to collect generous monthly dividends, but at the expense of capital appreciation.
- The reason is SPHD's poor methodology which selects only 50 stocks and prioritizes the high-yield factor above all others, including quality, dividend growth, and even low volatility.
- SPHD's latest semi-annual changes resulted in 18 substitutions that increased the portfolio's volatility, which is now on par with SCHD, a high-dividend ETF of significantly higher quality.
- This article highlights several profitability metrics to support this view, including net income and free cash flow margins 6% less than SCHD. It also includes total return and risk-adjusted return metrics for other low-quality ETFs that have historically underperformed.
- The takeaway is simple: long-term investors should aim for high-quality ETFs, and since SPHD ranks poorly in that area, it's not worth the risk.
Investment Thesis
One of the biggest errors dividend investors can make is assuming that just because an ETF holds only S&P 500 stocks, which, by definition, are profitable, that makes it a high-quality ETF. A prime example is the Invesco S&P 500 High Dividend Low Volatility ETF ( SPHD ), which has underperformed its parent Index by 14% since my cautionary review in February. Although I expect SPHD to pay an attractive 5.24% in dividends over the next year, that compensation is insufficient for the additional risk you take by accepting one of the lowest-quality large-cap ETFs trading today. SPHD's recent semi-annual reconstitution didn't change that fact, so I've assigned a "sell" rating on SPHD, and I look forward to explaining why in further detail below.
SPHD Overview
Strategy Discussion
SPHD tracks the S&P 500 Low Volatility High Dividend Index, which comprises 50 S&P 500 Index securities. The process first identifies the top 75 securities by yield and then removes the 25 most volatile ones based on price volatility over the last year. The order of operations is essential. Securing a high yield is the primary objective, while low-volatility is secondary. Furthermore, the Index is yield-weighted with security weights between 0.5% and 3.0% at each rebalancing date. Essentially, SPHD shareholders are guaranteed a high yield throughout the year. Other factors, like profitability, dividend growth, and even low volatility, are not.
Reconstitution Summary
The Index reconstitutes twice yearly at the end of January and July, with no more than ten securities allowed per sector. The most recent reconstitution included 17 additions with current weightings as follows:
- ONEOK ( OKE ): 2.85%
- LyondellBasell Industries ( LYB ): 2.44%
- Phillips 66 ( PSX ): 2.08%
- NRG Energy ( NRG ): 2.03%
- Amgen ( AMGN ): 2.00%
- Iron Mountain ( IRM ): 1.93%
- Viatris ( VTRS ): 1.92%
- Whirlpool ( WHR ): 1.85%
- Pfizer ( PFE ): 1.71%
- Kimco Realty ( KIM ): 1.70%
- Chevron ( CVX ): 1.70%
- American Electric Power ( AEP ): 1.58%
- Conagra Brands ( CAG ): 1.54%
- Tyson Foods ( TSN ): 1.49%
- Bristol-Myers Squibb ( BMY ): 1.45%
- Eastman Chemical ( EMN ): 1.41%
- Kellogg ( K ): 1.24%
Here are a few summary points to consider:
1. The weighted average five-year beta for these additions is 1.03, evidence that the low volatility factor was not emphasized.
2. The weighted average forward dividend yield is 5.94%, indicating the high dividend factor was emphasized.
3. The weighted average Seeking Alpha Profit Score (normalized on a ten-point scale) was 7.33/10, about two points lower than SPY. Given this, I don't expect a quality improvement.
This is what a typical reconstitution looks like. Yield is protected, but that's about it. That works well if you're an income-only investor but not so well if you want to do other things like preserve or grow your capital. My research shows that as you extend your time horizon beyond a couple of years, owning only highly profitable stocks is the best thing you can do, regardless of whether you're a value or growth investor.
The Index also deleted 18 stocks, with weights as of February 10 as follows:
- Boston Properties ( BXP ): 2.67%
- Digital Realty Trust ( DLR ): 2.28%
- Truist Financial ( TFC ): 2.09%
- Huntington Bancshares ( HBAN ): 2.05%
- U.S. Bancorp ( USB ): 2.03%
- Citigroup ( C ): 1.98%
- Equity Residential ( EQR ): 1.98%
- Hasbro ( HAS ): 1.84%
- Organon & Co. ( OGN ): 1.67%
- Omnicom Group ( OMC ): 1.64%
- Clorox ( CLX ): 1.60%
- Medtronic ( MDT ): 1.60%
- Interpublic Group ( IPG ): 1.58%
- Public Service Enterprise Group ( PEG ): 1.58%
- Darden Restaurants ( DRI ): 1.51%
- Corning ( GLW ): 1.50%
- NetApp ( NTAP ): 1.49%
- Kimberly-Clark (KMB): 1.47%
Here are the same three statistics for these deletions:
1. The weighted average five-year beta for these deletions is 0.94, lower than the 1.03 figure for the additions. The result should be a more volatile portfolio than before.
2. The weighted average forward dividend yield for these deletions is 5.10%. The Index swapped out these lower-yielding, better-performing stocks for deeper value plays.
3. The weighted average Seeking Alpha Profit Score was 7.35/10, virtually identical to the additions. On the one hand, it's positive that profits weren't sacrificed even further. However, on the other hand, the score is still poor.
Dividends
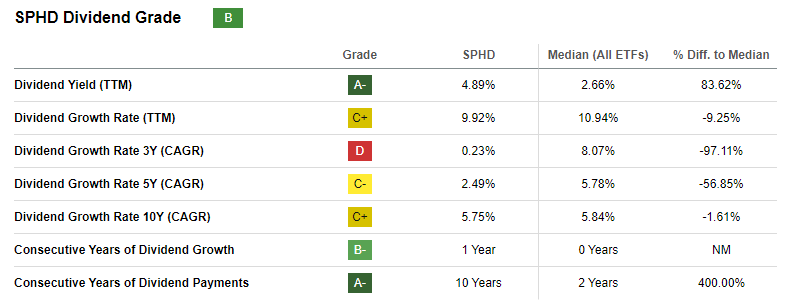
Without profits, it's tough to grow dividends. Over the last five years, that's been the case with SPHD, with a "C-" rated 2.49% dividend growth rate.
Seeking Alpha
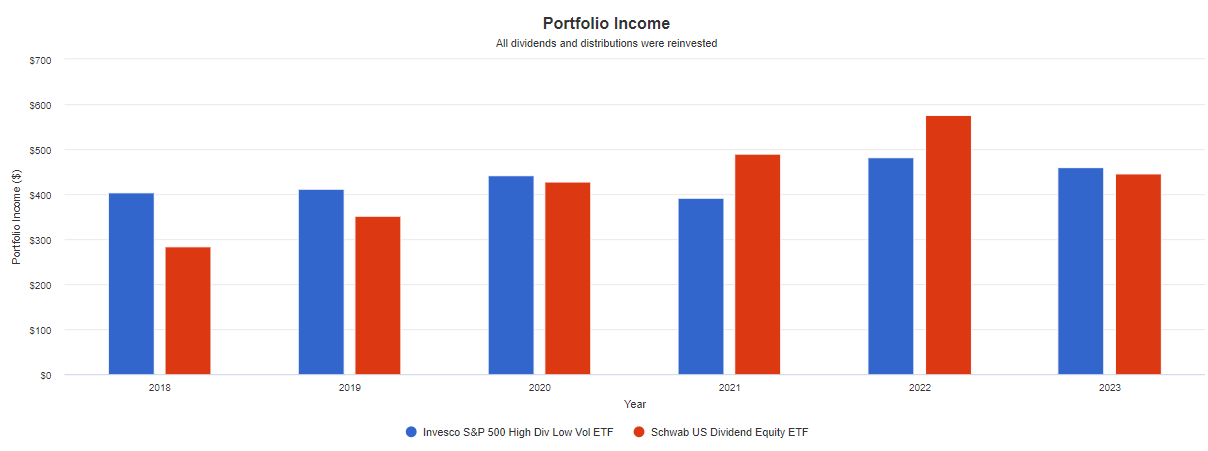
Some of that growth came from rotating into and overweighting the highest-yielding securities at each semi-annual reconstitution. Dividend growth would likely be even less had the Index reconstituted just once per year like the Schwab U.S. Dividend Equity ETF ( SCHD ), which has a 13.69% five-year dividend growth rate and is on an 11-year dividend growth streak. Even with dividend growth rates declining across the board, it won't take long for SCHD's 3.82% to catch up to SPHD's 4.89%. To illustrate, it took about 3-4 years for an investor starting in January 2018, assuming they reinvested dividends.
Portfolio Visualizer
The takeaway on dividends is that if you have a multi-year time horizon, SPHD is the inferior choice. Dividend growth is too small, and as I'll highlight shortly, it might get worse before it gets better. Earnings growth, which is required to support dividend growth, is estimated to be negative over the next year.
Performance
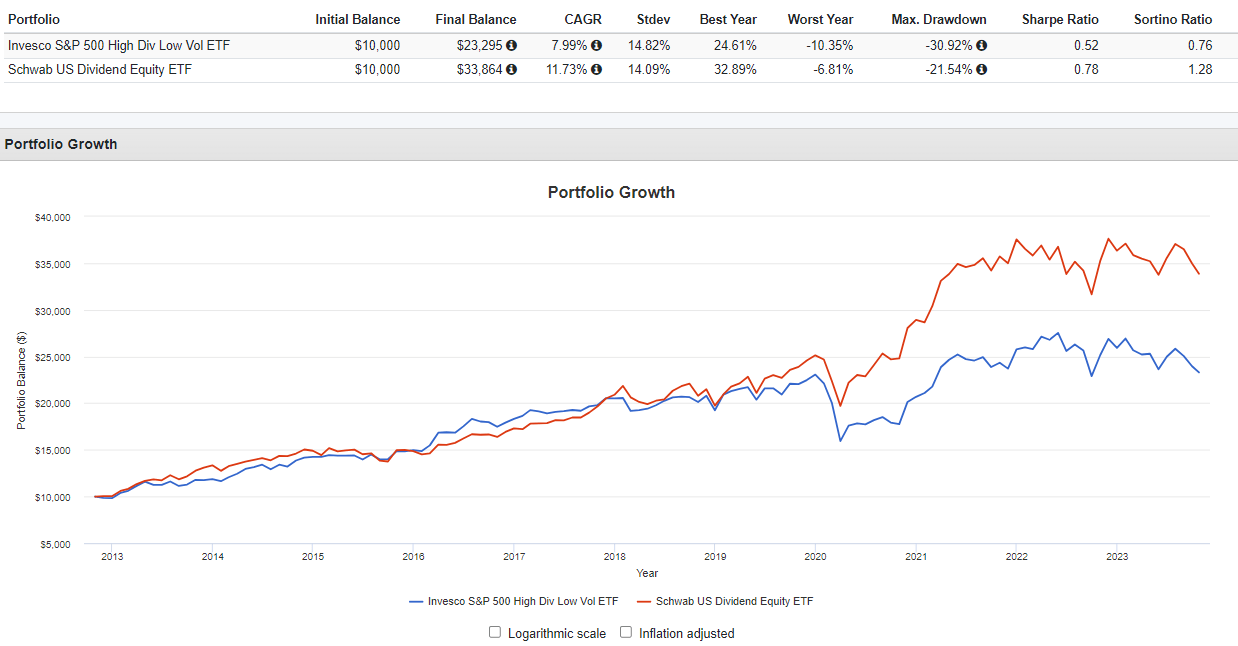
Since November 2012, SPHD has delivered an annualized 7.99% return compared to 11.73% for SCHD. As shown below, performance started reasonably well. Unfortunately, it plummeted 30.92% in Q1 2020 compared to 21.54% for SCHD and took 12 months to recover vs. five for SCHD.
Portfolio Visualizer
It's the opposite of what you want from a low-volatility ETF, which should protect capital in drawdowns and be slower to recover. Furthermore, its best-and-worst-year figures were inferior to SCHD, and volatility, as measured by its 14.82% annualized standard deviation figure, was higher. The result was substantially lower risk-adjusted returns (Sharpe and Sortino Ratios).
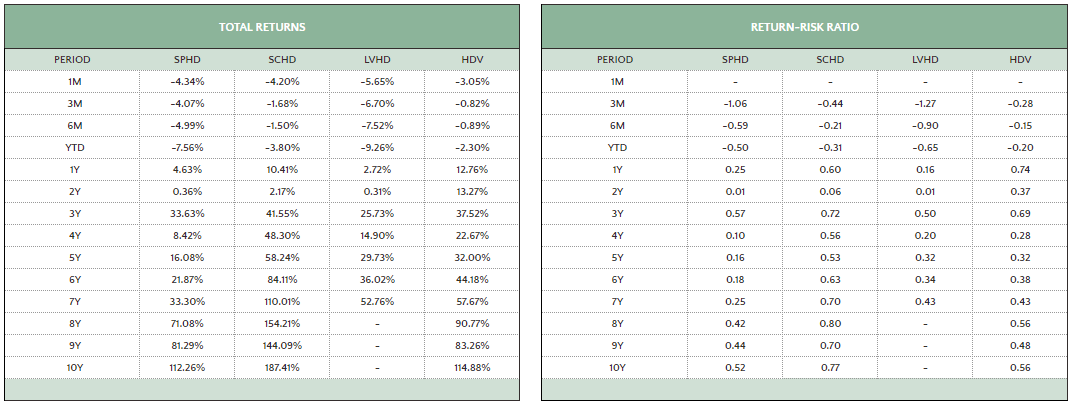
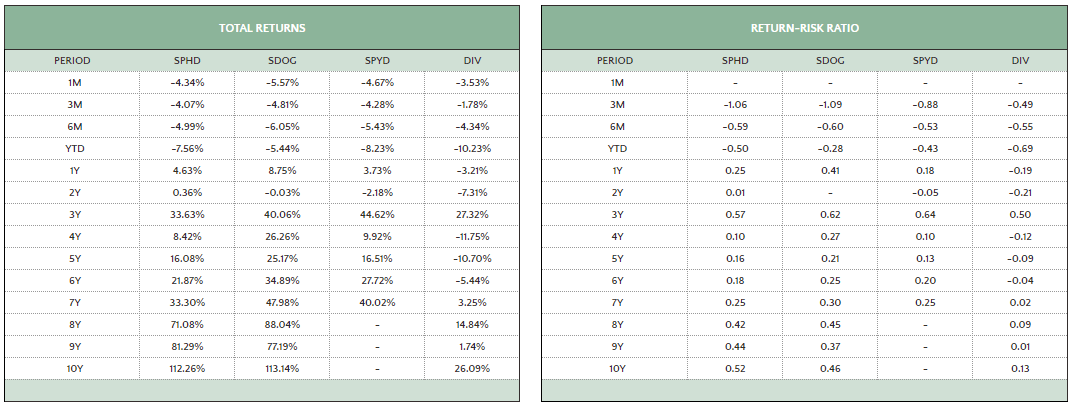
I've highlighted additional total returns and total return-to-risk ratios for SPHD and SCHD in the tables below, alongside the Franklin U.S. Low Volatility High Dividend Index ETF ( LVHD ) and the iShares Core High Dividend ETF ( HDV ). Notice how the metrics were better for SCHD and HDV across the board for all periods, with LVHD's track record mixed over the last four years but still better over the previous five to seven years through September 2023.
The Sunday Investor
The approach to accounting for volatility needs to be revised. What needs to be added is sufficient profitability. Among dividend-focused ETFs with weighted average market capitalizations above $25 billion, SPHD ranks in the bottom quintile (#40/52), only slightly above the ALPS Sector Dividend Dogs ETF ( SDOG ). Near the bottom of the list are the SPDR S&P 500 High Dividend ETF ( SPYD ) and the Global X Super Dividend U.S. ETF ( DIV ), which, like SPHD, have historically underperformed.
The Sunday Investor
It's no coincidence. Dividend ETFs with no quality screen are unreliable from a total returns perspective. However, let's look closer at SPHD's composition and hopefully find some redeeming qualities.
SPHD Analysis
Sub-Industry Composition
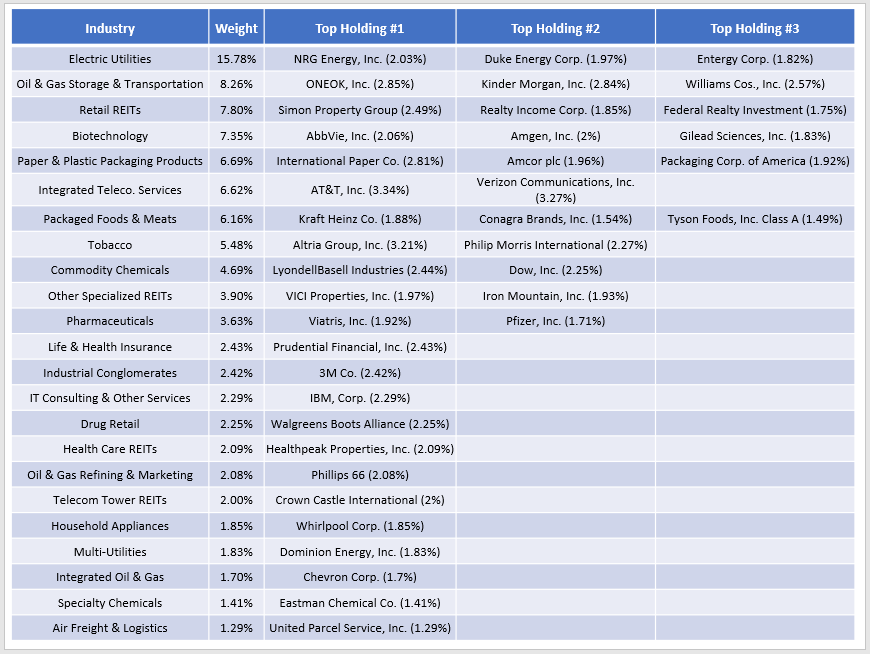
The following table summarizes SPHD by sub-industry and includes each of the top three holdings (where applicable). I prefer this view over the fund's top ten holdings, as it allows a reader to see potential diversification issues. In this case, SPHD overweights Electric Utilities (15.78%), Oil & Gas Storage & Transportation (8.26%), and Retail REITs (7.80%).
The Sunday Investor
AT&T ( T ) and Verizon Communications ( VZ ) are the fund's top two holdings, followed by Altria Group ( MO ), ONEOK ((OKE)), and Kinder Morgan ( KMI ). The top ten holdings total 28.25%, but since SPHD is a 50-stock fund covering only 23 sub-industries, diversification isn't strong.
Fundamental Analysis
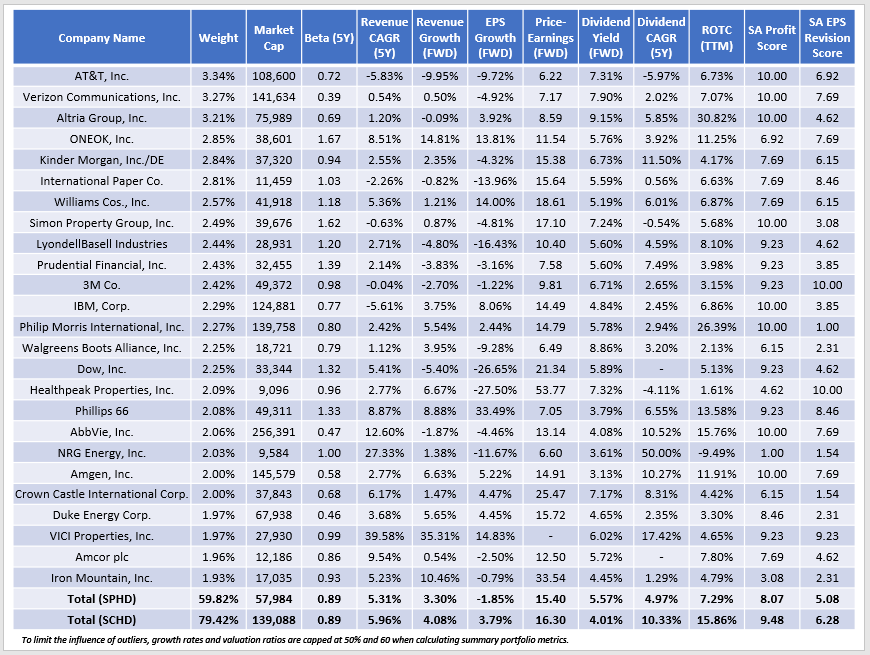
The next table highlights selected metrics for SPHD's top 25 holdings, totaling 59.82% of the portfolio. I've included metrics covering the low volatility and dividend yield factors the Index targets. Still, I also want to emphasize the fund's growth potential and profitability, which I view as critical weaknesses. SCHD is the benchmark, which I recently argued is an excellent value opportunity, though it, too, is weak on growth.
The Sunday Investor
I have five observations:
1. The low volatility factor is not apparent with SPHD, as its 0.89 five-year beta figure is now identical to SCHD and other dividend funds that don't explicitly screen for the factor. High allocations to Oil & Gas Storage & Transportation and Retail REITs are key reasons, with weighted average five-year betas of 1.27 and 1.33, respectively. Examples include ONEOK and Simon Property Group ( SPG ).
2. SPHD's gross dividend yield is 5.57%. However, shareholders must factor in the fund's 0.30% expense ratio, which would drop net distributions down to approximately 5.27% at current prices. It's not perfect, but the table highlights the downward progression in yield, reflecting the fund's yield-weighting scheme. A high dividend yield is SPHD's best feature, as it's challenging to find that among pure U.S. equity ETFs. You could buy covered call funds or expand internationally, but that comes with different risks.
3. SPHD's constituents have raised dividends by a weighted average 4.97% over the last five years. Unfortunately, the -1.85% estimated earnings per share growth rate is a major red flag, indicating that even this relatively meager dividend growth rate will shrink. Regarding declining earnings growth estimates, SCHD and nearly all dividend ETFs are in the same boat. However, SCHD has more leeway. It also beats SPHD on estimated EBITDA growth (3.87% vs. 2.87%), and its constituents have a lower trailing dividend payout ratio (51.39% vs. 56.73%).
4. As discussed earlier, SPHD's profitability metrics are weak for a large-cap fund. I've listed some metrics that support this score, including a weighted average 11.28% free cash flow margins and 12.34% net income margins, each approximately 6% lower than SCHD.
The Sunday Investor
It's fascinating to see SPHD come up short on every one of these key profitability metrics, which is wrapped up nicely in a profit score that's 1.41 points less (8.07/10 vs. 9.48/10). It's no wonder why SPHD doesn't appear to hold up as well in market downturns.
5. SPHD's 5.08/10 EPS Revision score indicates poor Wall Street sentiment, particularly among its Electric Utilities selections. This sub-industry has a 4.92 EPS Revision Score and a 15.78% weighting, but it's mostly a case of SPHD holding the least-favored stocks. Consider how the market-cap-weighted Utilities Select Sector SPDR ETF ( XLU ) has a 5.62/10 EPS Revision Score. Missing are NextEra Energy ( NEE ), Constellation Energy ( CEG ), Consolidated Edison ( ED ), Public Service Enterprise Group ( PEG ), and American Water Works ( AWK ), with EPS Revision Grades of "A-" or better. NEE, ED, and PEG offer solid dividend yields of 3.31%, 3.67%, and 3.76%, so excluding them doesn't seem beneficial. They all have low five-year betas, so at this point, I must blame the Index methodology, which only allows 50 selections.
Investment Recommendation
Despite an eventful semi-annual reconstitution in August that saw 31% of SPHD's portfolio swapped for higher-yielding, more volatile stocks, the same quality issues persist. SPHD's net income margins are 6% less than its higher-quality peer SCHD, its constituents are expected to deliver negative earnings per share growth over the next twelve months, and Wall Street analysts don't expect a turnaround anytime soon. These metrics won't support sufficient dividend growth for long-term investors, meaning all that's left is an estimated 5.27% dividend yield. With three-month U.S. treasuries yielding 5.42%, the risk doesn't make much sense. Therefore, I've rated SPHD a "sell" and recommend long-term dividend investors prioritize profitability above all else. Thank you for reading.
For further details see:
SPHD: Don't Assume This 5.27% Yielding S&P 500 Dividend ETF Is High Quality