JEPI - SPHD Vs. XRLV: Comparing Low-Volatility ETFs
Summary
- The Invesco S&P 500 High Dividend Low Volatility Portfolio ETF (SPHD) is widely followed and reviewed on Seeking Alpha. It invests using the S&P 500 Low Volatility Dividend Index.
- The Invesco S&P 500 ex-Rate Sensitive Low Volatility ETF (XRLV) wasn’t covered until recently after five years. It invests based on the S&P 500 Low Volatility Rate Response Index.
- Here, I review both ETFs and each index, so readers understand how each ETF is driven by its underlying index.
- The lesser-known ETF has shown better returns with lower risk. Yield seekers might stay with the SPHD ETF. That said, two other ETFs are presented that should be considered.
(This article was co-produced with Hoya Capital Real Estate )
Introduction
I came across the Invesco S&P 500 ex-Rate Sensitive Low Volatility ETF ( XRLV ) recently when looking for a more "focused" Low-Volatility ETF. That preference is why I haven't used the Invesco S&P 500 High Dividend Low Volatility Portfolio ETF ( SPHD ), a very popular ETF on Seeking Alpha, since it also goes for yield. Readers will see the single-focused has done better for investors, except for the income produced.
Invesco S&P 500 High Dividend Low Volatility Portfolio ETF review
Seeking Alpha describes this ETF as:
The Invesco S&P 500 High Dividend Low Volatility ETF invests in less volatile stocks of large-cap companies and in dividend paying stocks of companies. The underlying index is the S&P 500 Low Volatility High Dividend Index, which is restricted to the best 50 stocks in the S&P 500 Index. SPHD started in 2012.
Source: seekingalpha.com SPHD
SPHD has $4b in AUM and provides a TTM Yield of 3.75%. Invesco charges 30bps in fees.
Index review
S&P describes their Index as:
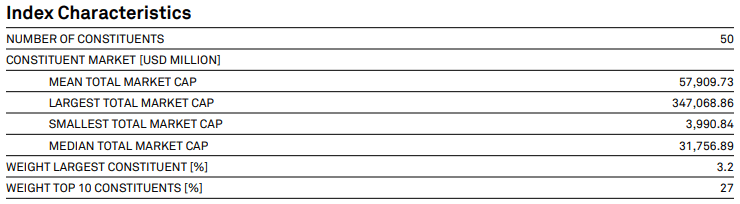
The S&P 500 Low Volatility High Dividend index measures the performance of the 50 least-volatile high dividend-yielding stocks in the S&P 500. Index Attributes The S&P 500 Low Volatility High Dividend Index combines two well-known investing themes-low volatility and income. The index provides the framework where these themes can be combined to obtain a desired investment objective. The goal of the index is to provide a selection of high yield stocks from the S&P 500 and use price volatility as a screen to eliminate dividend traps. Historically, it has been found that high price volatility is a good indicator of companies in stress.
Source: spglobal.com Index
Source: spglobal.com Index
Some of the Methodology rules include the following:
• Universe: All companies must be constituents in the S&P 500.
• Constituent Selection: All S&P 500 constituents are ranked in descending order by their dividend yields over the past 12 months. The 75 stocks with the highest dividend yield are selected, with the number of stocks from each Global Industry Classification Standard (GICS®) sector capped at 10. From those 75 stocks, the 50 with the lowest realized volatility over the trailing 252 trading days are selected to form the index.
• Weighting: At each rebalancing, index constituents are weighted by dividend yield.
• Diversification: The weight for each index constituent is capped at 3.0%, and the weight of each GICS sector is capped at 25%.
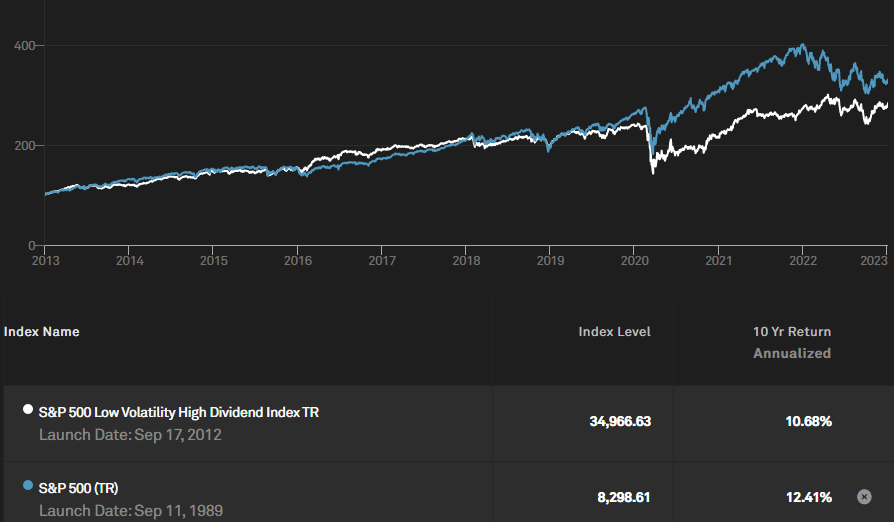
This how this index compares to the S&P 500 TR results over the past 10 years.
S&P provides a complete Methodology PDF for those who are interested.
SPHD holdings review
invesco.com SPHD sectors
Using both a high dividend, low volatility strategy greatly affects the sector allocations compared to a pure S&P 500 Index ETF like the SPDR S&P 500 ETF ( SPY ) as seen next.
ETFRC.com
SPHD is light Technology and heavy into Real Estate and Utilities: investors should agree with that shift to own SPHD over SPY. Since I did this mainly for XRLV, I will include the same chart here: how sectors differ from a year ago.
invesco.com; compiled by Author
While there are shifts, none are as extreme as readers will see XRLV experienced. The portfolio is about 49% Large-Cap (40% Value, 9% Blend, 0% Growth) and 51% Mid-Cap (35%, 16%, 0%).
invesco.com; compiled by Author
SPHD holds about 50 stocks, with the Top 20 accounting for 50% of the portfolio. The lightest weights are still over 1% of the portfolio, making for, as I see it, a balanced allocation across the stocks held.
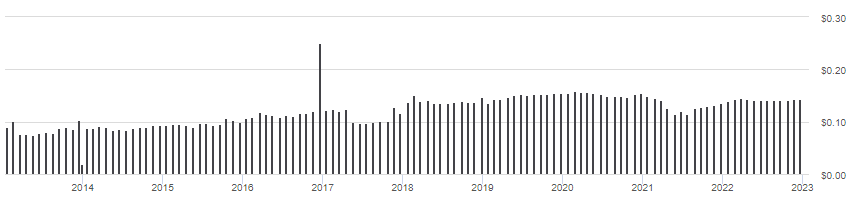
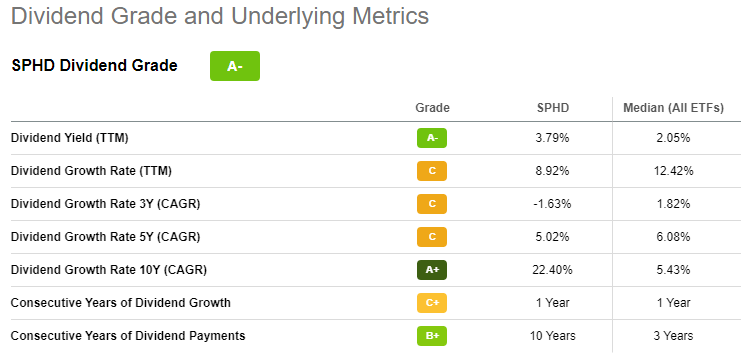
SPHD distribution review
SPHD's payout held up well after COVID struck but then took a hit in mid-2021, with the current monthly payout of $0.1436 at the levels not seen since last winter. Seeking Alpha gives this pattern a "A-" score.
seekingalpha.com SPHD scorecard
Invesco S&P 500 ex-Rate Sensitive Low Volatility ETF review
Seeking Alpha describes this ETF as:
The Invesco S&P 500 ex-Rate Sensitive Low Volatility ETF invests in less volatile stocks of large-cap companies. The underlying index is the S&P 500 Low Volatility Rate Response Index. XRLV started in 2015.
Source: seekingalpha.com XRLV
XRLV is very small at only $61m in AUM. It provides investors with a smaller TTM yield also: 1.93%. Invesco charges only 25bps in fees.
Index review
S&P describes their Index as:
The S&P 500® Low Volatility Rate Response Index is designed to measure the performance of the top 100 companies of the S&P 500 that have exhibited low volatility, while reducing negative exposure to changes in interest rates. Index Attributes Based on historical back-tested data, both in the U.S. and other regional markets, lower volatility stocks have outperformed higher volatility stocks on a risk-adjusted basis over medium- and long-term periods - a phenomenon known as the "low volatility anomaly". As low volatility portfolios may have greater exposure to interest rate risk, this index attempts to protect against a long-term rates increase by first excluding 100 stocks from the S&P 500 that have lowest returns when rates rise and then applying the low volatility screen to the remaining 400 stocks.
Source: spglobal.com Index
These rules were provided:
• Universe: To be considered, stocks must be constituents of the S&P 500 and must have traded on all trading days in the 12 months, in addition to trading in the prior 60 months, leading up to the rebalance reference date.
• Selection Criteria:
- For all companies in the selection universe, the interest rate sensitivity is computed by performing a regression of the prior 60 monthly stock returns to changes in the 10-year U.S. Treasury rate.
- For all companies in the selection universe, the realized volatility of the prior 12 months is computed.
- Companies are then ranked in descending order based on their interest rate sensitivity. The top-ranked stocks are deemed to be the stocks with the highest positive exposure to interest rates (i.e., stocks with the highest positive returns when interest rate rises).
- The top 400 companies as ranked by interest rate sensitivity remain eligible.
- The 100 companies within the remaining universe with the lowest volatility form the index.
• Constituent Weightings: At each rebalancing, the weight for each index constituent is set inversely proportional to its volatility.
Here is how this index compares to the S&P 500 TR over the past decade.
Here, the restricted index outperformed the standard S&P 500 Index, which means it also outperformed the other index used by SPHD. A Methodology PDF is also available for this Index.
XRLV holdings review
invesco.com XRLV sectors
With the rapid rise in interest rates last year, the sector allocations were radically altered.
invesco.com; compiled by Author
Here is how XRLV's strategy changes the sector weights from what SPY hold.
ETFRC.com
It shows the same Technology aversion and overweight in Utilities. The portfolio is about 55% Large-Cap (15% Value, 35% Blend, 5% Growth) and 45% Mid-Cap (11%, 31%, 3%). Compared to SPHD: more Large-Cap; much less Value.
invesco.com; compiled by Author
Here, out of 100 stocks, the Top 20 are 23% of the portfolio, with the smallest weight being 0.8%: another well-balanced allocation by weight.
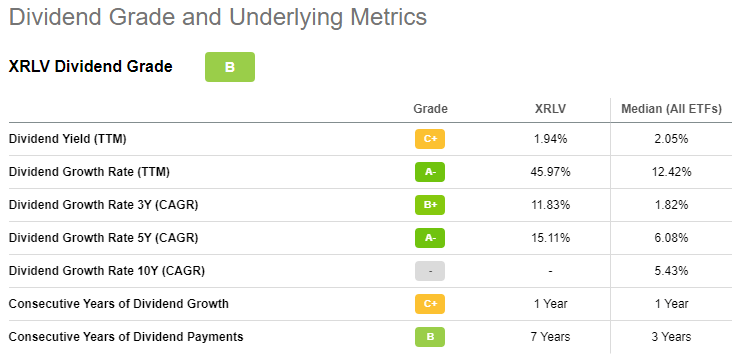
XRLV distribution review
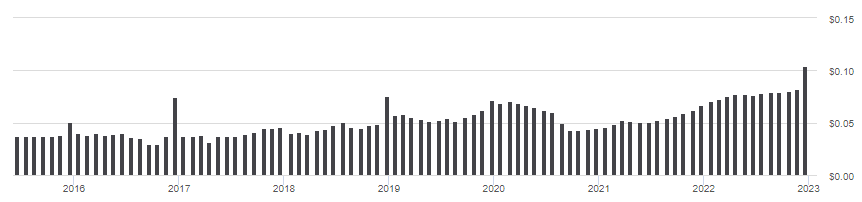
The first thing readers might notice is XRLV's payout pattern is more volatile than SPHD's.
The interest-rate sensitivity selection also seems to impact the income available for payouts, with both the Fed Funds Rate and payouts claiming, though payouts started recovering post-COVID. This has earned XRLV a "B" rating from Seeking Alpha.
seekingalpha.com XRLV scorecard
Comparing ETFs
I would assume most readers would make two comparisons, so I did too by including the SPY ETF.
This confirms what I have seen before, dual strategies seem to emphasize one over the other, as seemed to be the case with SPHD when I last covered it ( article ). With the highest CAGR, lowest StdDev, XRLV has the best risk ratios. It also comes with a better yield than SPY, though on that measure, SPHD provides the most income. With sector differences already covered, next I looked at some important equity ratios. I marked the best value in green, the worst in red.
Fidelity.com
Seeking Alpha ranks and grades all US ETFs on the following factors.
seekingalpha.com; multiple homepages
Portfolio strategy
This next part will assume the investor is looking at these ETFs mostly for their low-volatility strategy. I recently wrote CCOR Vs. JEPI: Trading Income And Some Return For Much Less Risk on a related trade-off of risk and income. Here is how they match up with those covered today. For the added history, I will use the ticker JEPIX instead of JEPI for the JPMorgan Equity Premium Income data. The data shown goes back to September 2018; ends with 2022.
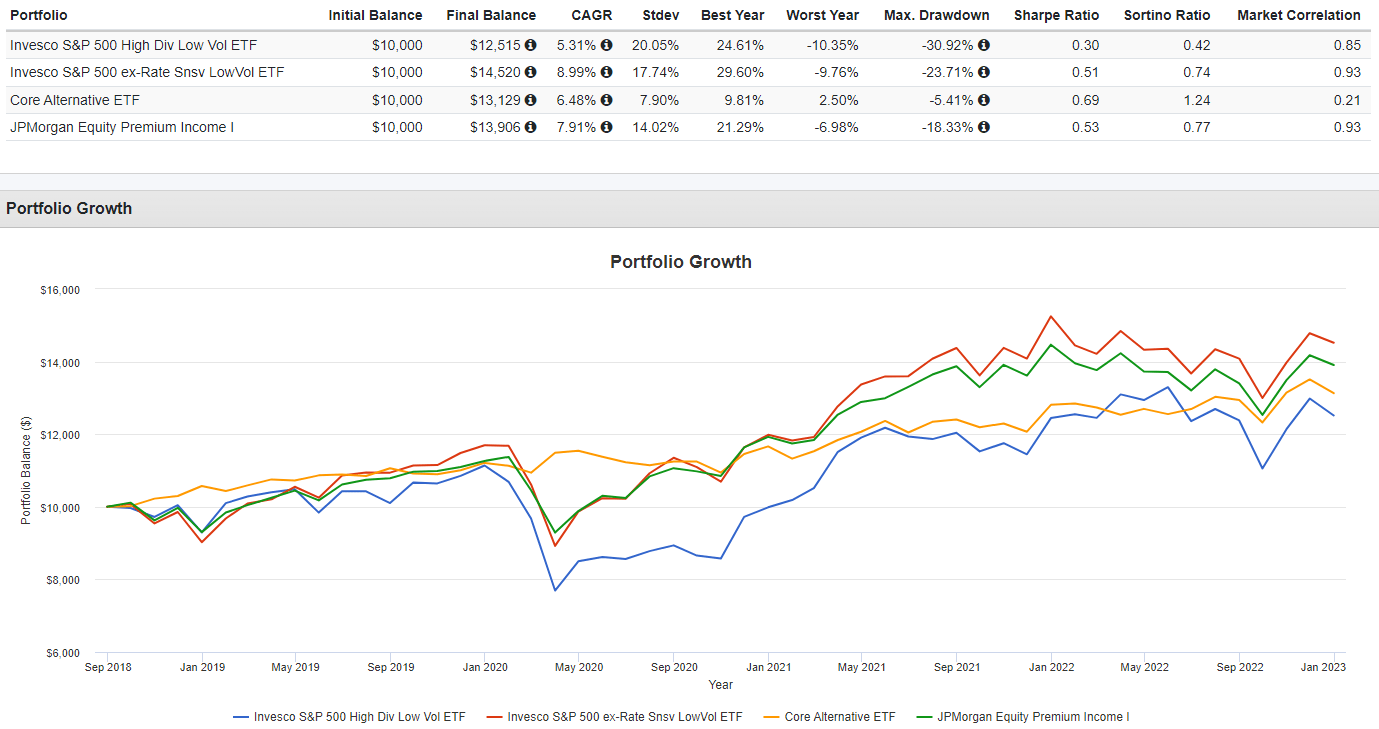
If looking for a smoother ride, the Core Alternative ETF ( CCOR ) would be the best of this breed. For yield and stability, the JEPI ETF is on top here.
Final thought
As with any comparison between funds, even ones with similar strategies, knowing how that ETF or ETFs will fit into the investor's overall portfolio, strategy, and investment goals is beyond what I think any investment information article or column can answer. While guidance is possible, the final decision is upon each individual investor.
For further details see:
SPHD Vs. XRLV: Comparing Low-Volatility ETFs