LGLV - SPLV: 3 Reasons To Avoid This Low-Volatility ETF
2023-10-07 07:22:51 ET
Summary
- SPLV, a well-established low-volatility ETF, has underperformed most peers since its launch. This article evaluates its total returns and fundamentals against three alternatives: USMV, FDLO, and LGLV.
- My analysis reveals SPLV is not well-diversified at either the sector or industry levels. Since every recession is different, investors banking on a highly-concentrated portfolio for protection may be disappointed.
- I'll offer two other reasons why SPLV doesn't belong in your portfolio over the long run, but a short-term value opportunity may exist for traders.
Investment Thesis
The Invesco S&P 500 Low Volatility ETF ( SPLV ) has struggled this year, declining by 6.34% through Q3, and is now 8% behind its larger peer, the iShares MSCI USA Min Vol Factor ETF ( USMV ). As detailed in my last review , SPLV has historically underperformed USMV 75% of the time, and since I had quality concerns with its holdings, there wasn't a compelling buy opportunity. However, SPLV's Index has reconstituted since, so I want to provide an update on its fundamentals and how they compare with USMV and two other leading low-volatility ETFs worth your consideration. I hope you enjoy the analysis.
SPLV Overview
Strategy Discussion and Performance
SPLV tracks the S&P 500 Low Volatility Index, selecting and inversely weighting the 100 least volatile S&P 500 Index stocks. Volatility is measured by the one-year (252 trading days) standard deviation of price returns, and the Index reconstitutes quarterly effective February, May, August, and November. It's a simple process that provides investors pure exposure to the volatility factor but ignores others like quality and value. Lack of diversification is another risk, which I'll evaluate shortly at the sector and industry levels.
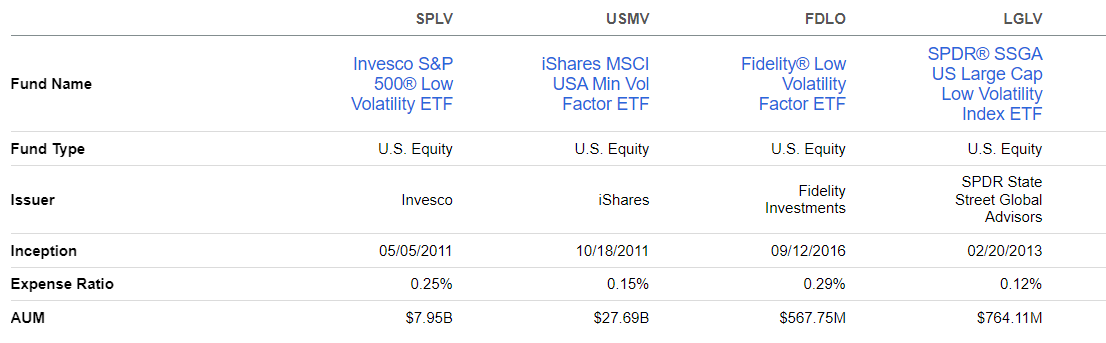
SPLV's expense ratio is 0.25%, with $7.95 billion in assets under management. It launched in May 2011, five months before USMV, which undercut SPLV on fees by ten basis points and now manages $20 billion more in assets. As additional comparisons, I've listed the Fidelity Low Volatility Factor ETF ( FDLO ) and the SPDR SSGA US Large Cap Low Volatility ETF ( LGLV ) in the table below. These ETFs are less popular, with only $1.33 billion in combined assets.
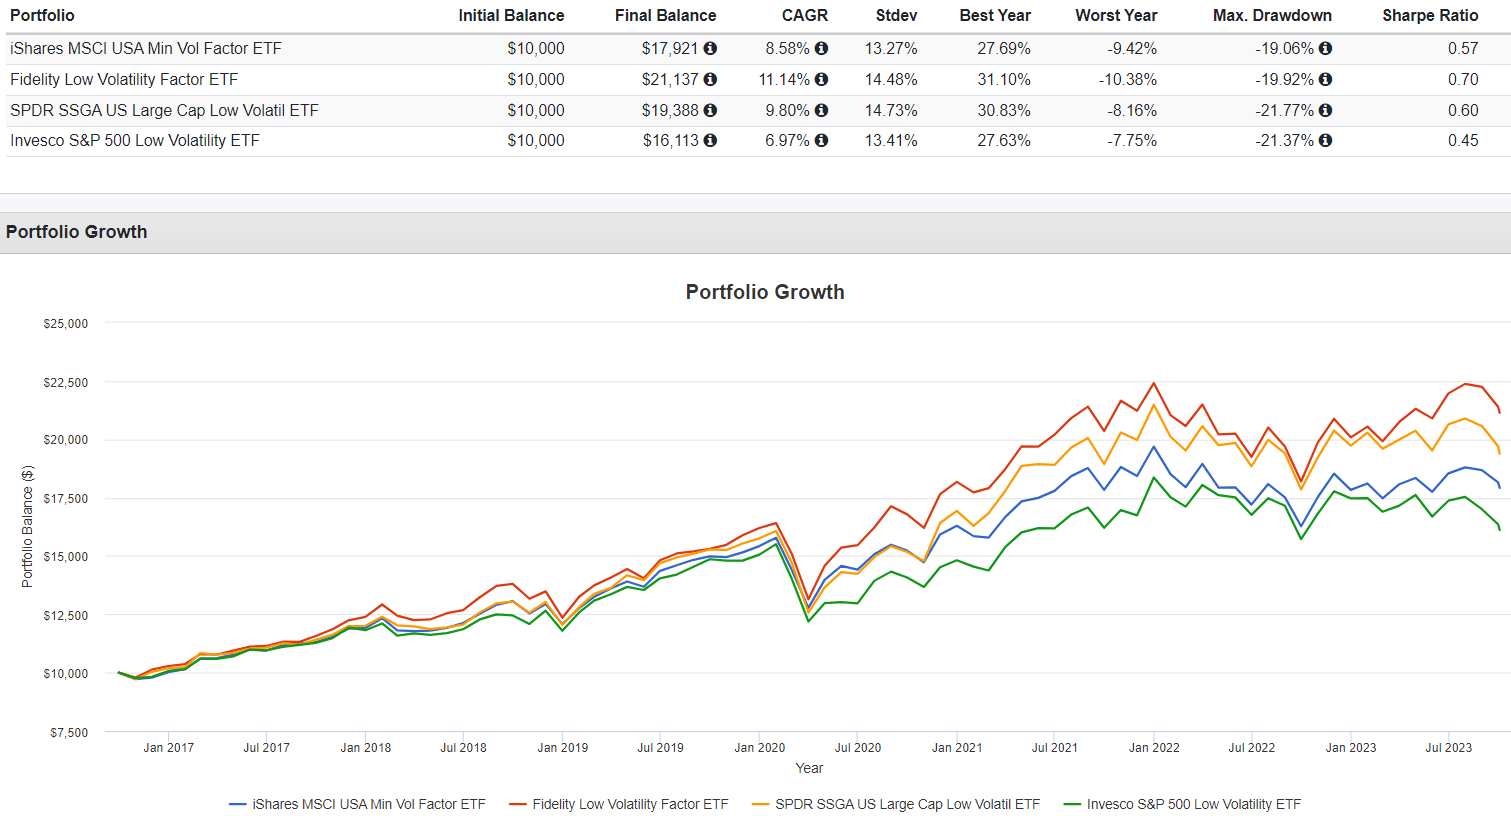
As evidence that size doesn't always matter, consider the following performance chart showing how FDLO and LGLV outperformed SPLV by an annualized 4.17% and 2.83% since October 2016. Both ETFs also beat USMV and provided similar volatility levels, leading to superior risk-adjusted returns (Sharpe Ratio).
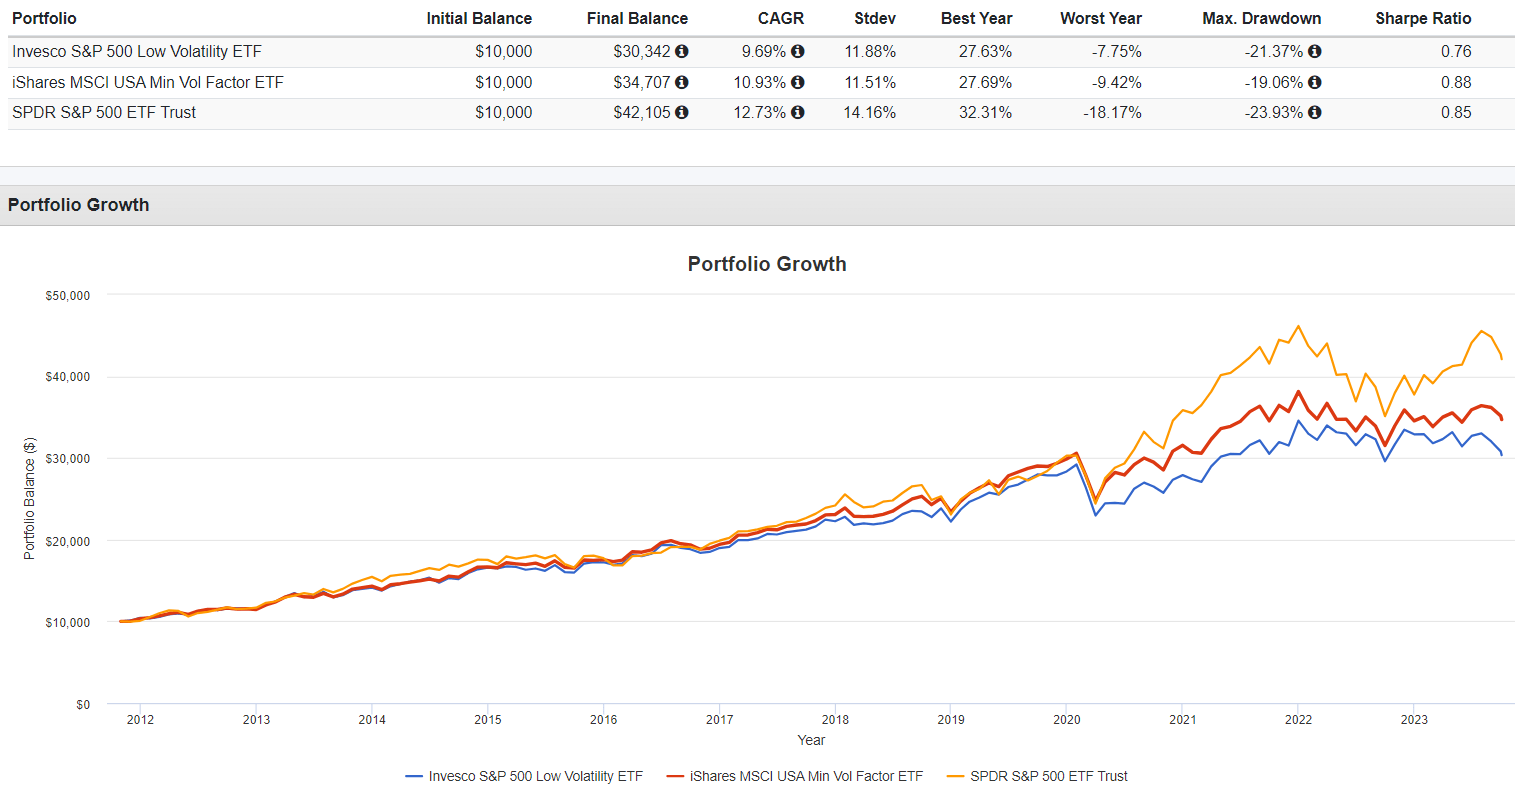
Since November 2011, SPLV gained an annualized 9.69% compared to 10.93% and 12.73% for USMV and the SPDR S&P 500 ETF ( SPY ). Notice how volatility was markedly lower for the low-volatility ETFs, resulting in more favorable risk-adjusted returns for USMV. SPLV's worst year is the current one, down 7.75% through October 3, 2023. Meanwhile, USMV and SPY's worst year was 2022, when they declined by 9.42% and 18.17%.
Sector Exposures and Diversification Scores
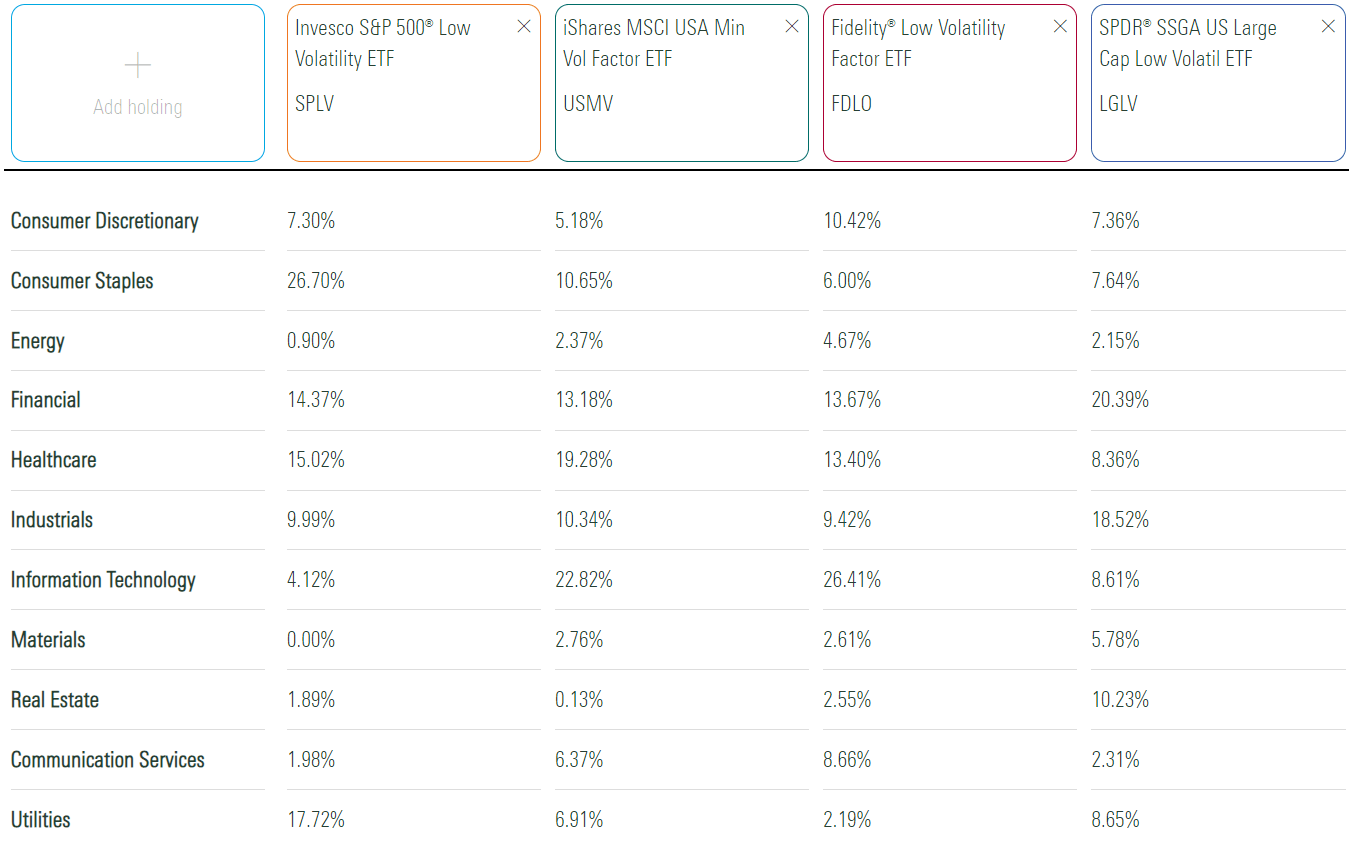
The following table highlights sector exposures for SPLV, USMV, FDLO, and LGLV. Interestingly, the exposure areas are substantially different despite all ETFs purporting to follow a low-volatility strategy. For example, SPLV overweights the Consumer Staples and Utilities sectors, while USMV and FDLO have 20%+ exposure to Technology stocks, perhaps explaining their more robust five-year returns.
One way to measure sector diversification is to add up all of an ETF's absolute variances with a perfectly diversified equal-weight-by-sector fund (9.09% for all 11 sectors) and then scale it from 1-10. In SPLV's case, the calculation is:
- Consumer Discretionary: 7.30% vs. 9.09% = 1.79%
- Consumer Staples: 26.70% vs. 9.09% = 17.61%
- Energy: 0.90% vs. 9.09% = 8.19%
- Financials: 14.37% vs. 9.09% = 5.28%
- Health Care: 15.02% vs. 9.09% = 6.93%
- Industrials: 9.99% vs. 9.09% = 0.90%
- Information Technology: 4.12% vs. 9.09% = 4.97%
- Materials: 0.00% vs. 9.09% = 9.09%
- Real Estate: 1.89% vs. 9.09% = 7.20%
- Communication Services: 1.98% vs. 9.09% = 7.11%
- Utilities: 17.72% vs. 9.09% = 8.63%
- Total: 77.70%
While a perfectly diversified fund would have zero absolute variances, the calculation totals 181.81% for a perfectly undiversified fund with 100% allocation to a single sector. SPLV's position in range would be (77.70% - 0.00%) / (181.81% - 0.00%) = 42.74%. Finally, since lower values are preferred, we subtract this value from 100% to get 57.26%, or 5.73 on a ten-point scale. For the other three ETFs, the scores are as follows:
- USMV: 6.61
- FDLO: 6.93
- LGLV: 7.59
SPY's score is 6.92/10, and there are 19 other low-volatility ETFs with sector diversification scores ranging between 5.28/10 and 8.01/10. I mention this because diversification can act as good insurance if a sector falls out of favor for an extended period. With these figures, we can conclude that SPLV is less diversified than most low-volatility ETFs and SPY. You must have high confidence in the Consumer Staples and Utilities sectors moving forward for an investment to make sense. If you are less convinced which sectors will outperform in the next recession, I suggest more diversified options.
SPLV Analysis: Fundamentals
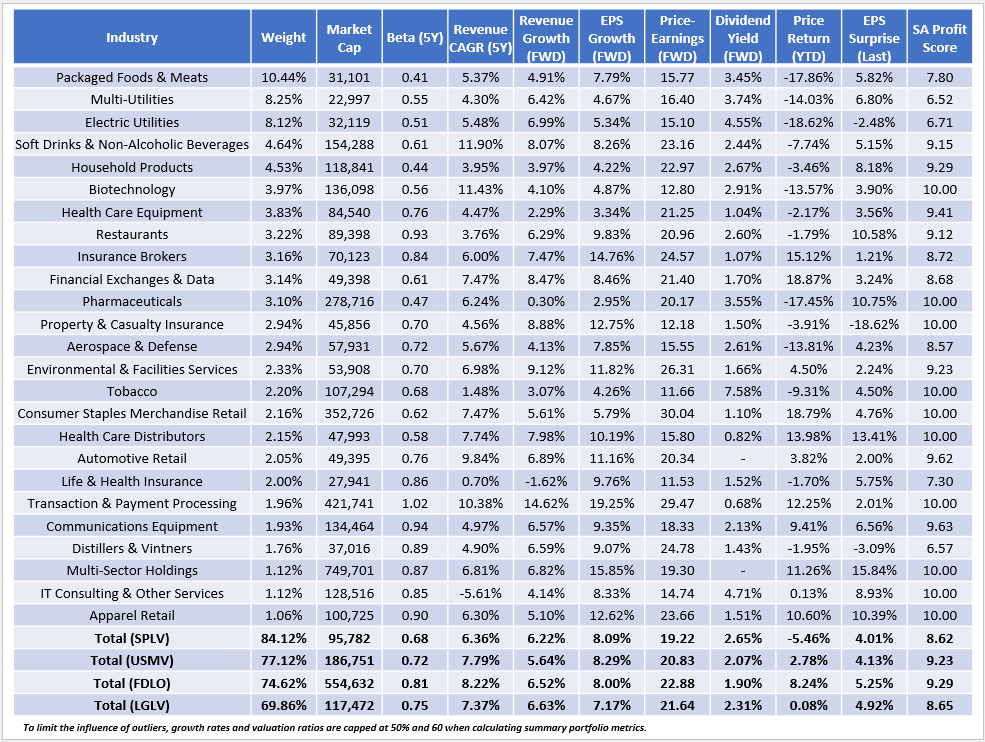
The following table highlights selected fundamental metrics for SPLV's top 25 sub-industries, totaling 84.12% of the portfolio. I've also included summary metrics for USMV, FDLO, and LGLV in the bottom rows.
A few observations:
1. With 84.12% of assets in its top 25 sub-industries, SPLV also appears poorly diversified at this level. Using the same method described above for the 163 GICS sub-industries, SPLV's score is fourth-worst among 23 low-volatility ETFs. USMV, FDLO, and LGLV rank #15, #11, and #7, respectively. These rankings are an additional piece of evidence suggesting that better-diversified funds are more likely to perform well.
2. SPLV, FDLO, and LGLV have similar five-year betas, while FDLO's 0.81 is the outlier. As mentioned, it also has the highest exposure to Technology stocks, which are likely reasons for the outperformance over the last seven years.
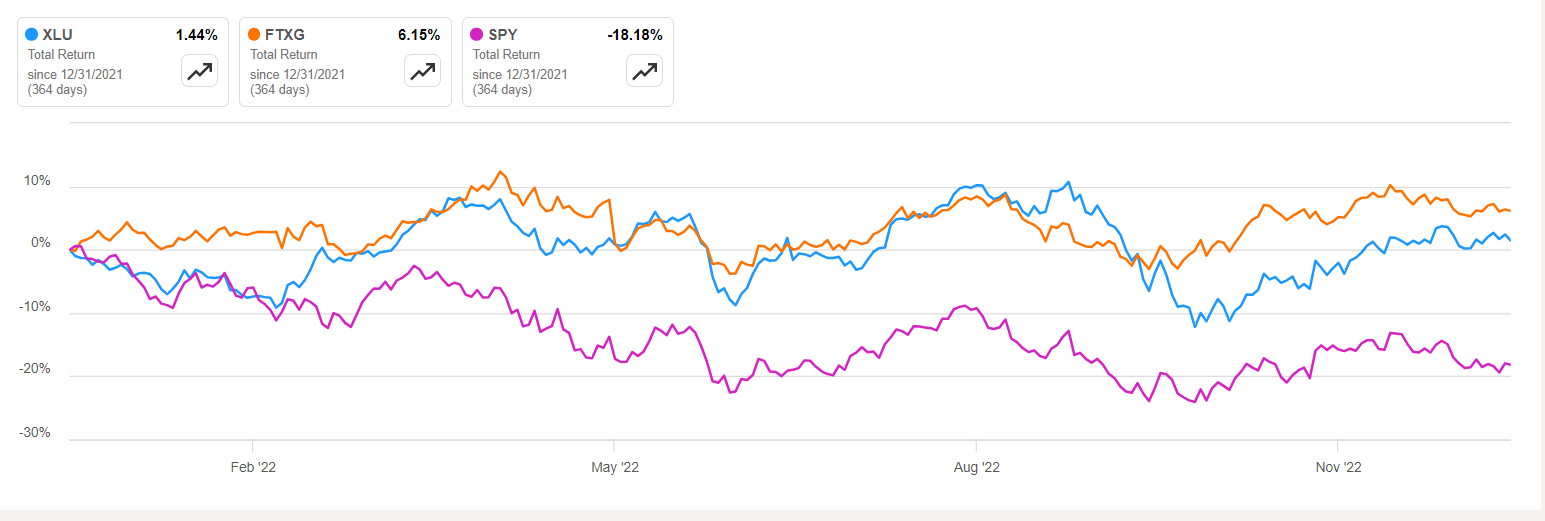
3. SPLV trades at 19.22x forward earnings and has a 2.65% gross dividend yield (2.40% net). Compared to the other three funds, it is the best value opportunity. Furthermore, SPLV's top three industries (Packaged Foods & Meats, Multi-Utilities, and Electric Utilities) are down 17.86%, 14.03%, and 18.62% YTD, far worse than the portfolio's weighted average 5.46% decline. It's easy to blame rising interest rates for these declines, but you may be surprised how these industries held up exceptionally well last year. Consider the following returns of the Utilities Select Sector SPDR ETF ( XLU ) and the First Trust Nasdaq Food & Beverage ETF ( FTXG ) for 2022 in the graph below:
As I wrote several times last year, earnings results better explain these swings. Throughout last year, Consumer Staples and Utilities stocks held up well in terms of earnings surprises but are lagging substantially this year. Our latest information is that each fund's weighted average earnings surprise last quarter, ranging from 4.01% for SPLV to 5.25% for FDLO. FTXG and XLU's figures are each at 5.27%, while SPY is much better at 8.52%. After disappointing broad-market numbers last year, the trend turned positive this year, signaling positive risk sentiment and less demand for defensive stocks. That said, Q3 earnings season is around the corner, and if surprises are in the low-single-digits, that could be beneficial for Consumer Staples and Utilities stocks and, in turn, SPLV.
4. SPLV's 8.62/10 profit score is relatively poor compared to USMV and FDLO, perhaps explaining why it hasn't held up as well as I had hoped in market downturns. To be sure, LGLV's 8.65/10 score is similar, and it has performed reasonably well. However, it's also better diversified by sector and industry, a crucial distinction. If you can develop a well-diversified, high-quality portfolio that scores reasonably well on the volatility factor, you stand a solid chance of outperforming in a market drawdown.
5. SPLV's estimated sales and earnings per share growth rates are similar to USMV, FDLO, and LGLV, and since it trades at a discount on forward earnings, the combination is attractive. Still, that could be temporary, and I remind readers that SPLV's Index reconstitutes quarterly.
Investment Recommendation
I've reiterated my hold rating on SPLV. I don't think it's a great long-term buy, and I offer three reasons to avoid it:
- Its poor long-term track record, including total and risk-adjusted returns.
- Weak diversification, as measured at the sector and industry levels.
- Poor profit score, suggesting its holdings are not "flight-to-quality" worthy.
SPLV over weights Consumer Staples and Utilities stocks, and while this may present a short-term value opportunity, other ETFs like USMV, FDLO, and LGLV appear better equipped to protect your portfolio in case of a downturn. I hope you found this information helpful, and as always, I look forward to the discussion in the comments section below. Thank you for reading.
For further details see:
SPLV: 3 Reasons To Avoid This Low-Volatility ETF