JMOM - SPMO: Simple And Efficient Momentum ETF
2023-12-08 15:32:21 ET
Summary
- Invesco S&P 500® Momentum ETF is invested in 100 stocks of the S&P 500 index with higher volatility-adjusted return.
- The SPMO ETF is less concentrated in technology but more concentrated in the top 10 holdings compared to the S&P 500.
- Valuation and growth metrics are not much different from the parent index, but quality is significantly superior.
- SPMO has performed quite well relative to benchmarks and competitors.
SPMO strategy and portfolio
Invesco S&P 500® Momentum ETF ( SPMO ) started investing operations on 10/09/2015 with the objective of tracking the S&P 500 Momentum Index. It has 102 holdings, a distribution yield of 1.81% and an expense ratio of 0.13%. Dividends are paid quarterly.
As described by S&P Dow Jones Indices , the momentum value for month M is defined as the 12-month price rate of change from the month (M-14) to month (M-2). Then, a momentum score is calculated as the momentum value divided by volatility. Volatility is defined as the standard deviation of daily returns in the same period. S&P 500 constituents are ranked in descending order by momentum score into five quintiles. Securities in the 1st quintile are selected in the index. Constituents are weighted based on the product of the market capitalization and the momentum score, with a limit of 9%. The index is rebalanced semi-annually in March and September. A buffer rule is applied to reduce turnover at each rebalancing.
Technology is the heaviest sector (22.6% of asset value), although not so heavy as in the parent index S&P 500 ( SP500 ), represented on the next chart by SPDR S&P 500 ETF Trust ( SPY ). The next heavy sectors are healthcare (18.1%), industrials (17.2%) and communication (13%). Other sectors are below 9%. Compared to the S&P 500, SPMO overweights healthcare, industrials, communication and materials. It underweights other sectors and almost ignores real estate (0.2%).
Sector breakdown (chart: author; data: Invesco, SSGA)
The portfolio is quite concentrated. The top 10 holdings, listed in the next table, represent 50.7% of asset value. The top 5 names have weights between 6% and 10%, and 36.7% in aggregate. Risks related to other individual companies are low.
| Ticker |
| Name |
| Weight % |
| EPS growth % TTM |
| P/E TTM |
| P/E fwd |
| Yield % |
| Meta Platforms, Inc. |
| 9.59 |
| 7.92 |
| 28.83 |
| 22.74 |
| 0 |
| NVIDIA Corp. |
| 8.24 |
| 222.20 |
| 61.52 |
| 38.18 |
| 0.03 |
| Broadcom Inc. |
| 6.48 |
| 25.64 |
| 28.00 |
| 19.76 |
| 2.00 |
| Eli Lilly & Company |
| 6.28 |
| -18.63 |
| 108.59 |
| 88.96 |
| 0.77 |
| JPMorgan Chase & Co. |
| 6.13 |
| 41.43 |
| 9.36 |
| 9.41 |
| 2.68 |
| Netflix, Inc. |
| 3.26 |
| -10.17 |
| 45.07 |
| 37.21 |
| 0 |
| Oracle Corporation |
| 2.94 |
| 59.63 |
| 33.58 |
| 20.36 |
| 1.42 |
| Merck & Co., Inc. |
| 2.79 |
| -70.05 |
| 57.70 |
| 67.80 |
| 2.97 |
| General Electric Company |
| 2.61 |
| 262.60 |
| 13.69 |
| 44.91 |
| 0.27 |
| Walmart, Inc. |
| 2.44 |
| 86.16 |
| 25.31 |
| 23.58 |
| 1.50 |
Data: Portfolio123.
Fundamentals
As reported in the next table, valuation and growth metrics are not much different from the benchmark, with an exception: the cash flow growth is significantly higher.
| SPMO |
| SPY |
| Price/Earnings TTM |
| 22.74 |
| 22.64 |
| Price/Book |
| 5.15 |
| 4 |
| Price/Sales |
| 2.43 |
| 2.58 |
| Price/Cash Flow |
| 16.79 |
| 15.71 |
| Earnings growth |
| 15.55% |
| 17.47% |
| Sales growth |
| 10.07% |
| 11.41% |
| Cash flow growth |
| 12.44% |
| 7.99% |
The fund holds 100 stocks, of which 13 are risky stocks regarding my preferred quality metrics. In my ETF reviews, risky stocks are companies with at least 2 red flags among: bad Piotroski score, negative ROA, unsustainable payout ratio, and bad or dubious Altman Z-score, excluding financials and real estate where these metrics are less relevant. Here, risky stocks weigh 8.2% of asset value, which is a good point.
According to my calculation of aggregate metrics reported in the next table, portfolio quality is significantly superior to the benchmark.
| SPMO |
| SPY |
| Altman Z-score |
| 8.09 |
| 3.59 |
| Piotroski F-score |
| 6.39 |
| 5.71 |
| ROA % TTM |
| 12.52 |
| 7.23 |
Performance
The next table compares performance and risk metrics since 10/16/2015 of SPMO, SPY, and benchmarks of value and growth styles in the same stock universe:
| Total Return |
| Annual Return |
| Drawdown |
| Sharpe ratio |
| Volatility |
| SPMO |
| 170.65% |
| 13.00% |
| -30.95% |
| 0.73 |
| 16.10% |
| SPY |
| 160.06% |
| 12.45% |
| -33.72% |
| 0.7 |
| 16.02% |
| SPYV |
| 124.70% |
| 10.45% |
| -36.89% |
| 0.59 |
| 16.24% |
| SPYG |
| 183.38% |
| 13.64% |
| -32.67% |
| 0.71 |
| 17.43% |
Data: Portfolio123
The momentum ETF is second to the growth ETF for this period, but SPMO has a marginally better risk-adjusted performance (Sharpe ratio) thanks to a lower volatility. Both beat the broad index, unlike the value ETF. Nevertheless, this 8-year time frame doesn't include a full market cycle, so it may be an optimistic sample of the fund's long-term potential.
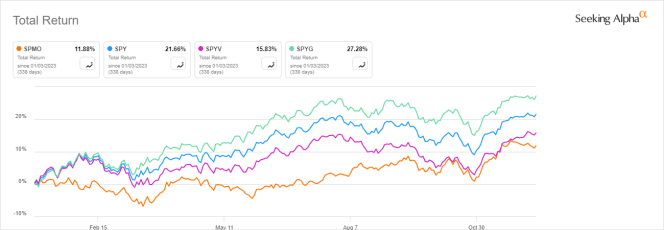
In 2023 to date, SPMO has been lagging behind other investing styles. The explanation is quite simple: the most resilient stocks in the 2022 market downturn have not been among the best performers in the 2023 recovery. A trend-following investing style usually underperforms in reversal situations.
SPMO vs. SPY, SPYV, SPYG, year-to-date (Seeking Alpha)
SPMO vs. competitors
The next table compares the characteristics of SPMO and five other large-cap momentum ETFs:
- iShares MSCI USA Momentum Factor ETF ( MTUM ).
- Invesco Dorsey Wright Momentum ETF ( PDP ).
- JPMorgan U.S. Momentum Factor ETF ( JMOM ).
- Vanguard U.S. Momentum Factor ETF ( VFMO ).
| SPMO |
| MTUM |
| PDP |
| JMOM |
| VFMO |
| Inception |
| 10/9/2015 |
| 4/16/2013 |
| 3/1/2007 |
| 11/8/2017 |
| 2/13/2018 |
| Expense Ratio |
| 0.13% |
| 0.15% |
| 0.62% |
| 0.12% |
| 0.13% |
| AUM |
| $259.43M |
| $8.08B |
| $1.05B |
| $345.21M |
| $337.35M |
| Avg Daily Volume |
| $2.76M |
| $58.98M |
| $3.01M |
| $1.30M |
| $1.39M |
| Number of Holdings |
| 103 |
| 128 |
| 103 |
| 300 |
| 550 |
| Assets in Top 10 |
| 50.74% |
| 41.11% |
| 25.04% |
| 18.91% |
| 11.80% |
| Turnover |
| 124.00% |
| 111.00% |
| 140.00% |
| 43.00% |
| 88.00% |
| YTD Price Performance |
| 8.30% |
| 2.47% |
| 13.58% |
| 15.95% |
| 7.28% |
| 5-Year Price Performance |
| 73.95% |
| 43.62% |
| 59.77% |
| 72.88% |
| 68.23% |
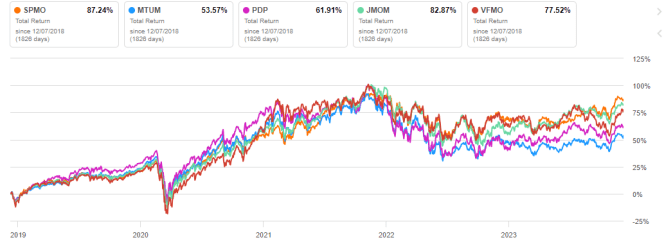
SPMO's expense ratio is on the cheap side, but MTUM has a significantly higher liquidity. SPMO is the most concentrated in the top 10 holdings. It is the best performer in 5-year price return and ranked third in 2023 to date. It is also the best performer in 5-year total return, as reported on the chart below.
SPMO vs competitors, 5-year total return (Seeking Alpha)
Takeaway
Invesco S&P 500® Momentum ETF is invested in 100 stocks of the S&P 500 index with higher 12-month volatility-adjusted return. A 2-month lag is applied to exclude short-term reversals of individual stocks. The fund is less concentrated in technology than the S&P 500, but it is significantly more concentrated in the top 10 holdings. Valuation and growth metrics are not much different from the parent index, but quality is significantly superior. SPMO beats the S&P 500 and the S&P 500 growth index in risk-adjusted return from inception. Thanks to the volatility adjustment of the momentum score, the higher return doesn't come with a higher risk. The fund has also beaten other large-cap momentum ETFs in the last 5 years.
Invesco S&P 500® Momentum ETF may be used as a long-term investment, a swing-trading instrument, or in a tactical allocation strategy switching between various investment styles (for example momentum and value). Please keep in mind that trend-following strategies are usually beaten down in market reversals. Appropriate risk management is required.
For further details see:
SPMO: Simple And Efficient Momentum ETF