SPSM - SPSM: A Good Way To Get Low-Cost Small Cap Exposure
2023-10-30 10:41:37 ET
Summary
- SPSM is an SPDR ETF that invests in the S&P 600 Small Cap Index with an expense ratio of 0.03%.
- Small caps may outperform large caps over the next decade due to attractive valuations, higher growth potential, and favorable economic trends.
- SPSM has advantages over other passive small-cap strategies and has historically outperformed the Russell 2000 by about 1.7% per year.
Overall Objective and Strategy
( SPSM ) is a SPDR ETF that invests in the S&P 600 Small Cap Index
- The expense ratio is only 0.03%.
- The S&P 600 has a profitability requirement. Companies must have positive earnings over the past four quarters.
- The index is float adjusted and market cap weighted.
- There are currently 605 holdings in SPSM with an average P/E ratio of 11.74.
Why Small Caps May Outperform Large Caps Over the Next Decade
Small-cap stocks have historically outperformed large-cap stocks over the very long term, but they can be more volatile in the short term. This is because small-cap companies are typically more sensitive to economic cycles and have less diversified revenue streams. However, there are a number of reasons why small caps may be particularly well-positioned to outperform large caps over the next decade.
Valuations Are Attractive
1. Small cap valuations currently seem more attractive than large caps. The current small cap price-to-book (P/B) trades at a 57% discount to that of the S&P 500 (1.8 versus 4.2) – a figure in the bottom 2nd percentile over the last 20 years.
2. Small-caps may offer investors long term potential in a market where large-caps are trading at stretched valuations (91st percentile over the last 20 years based on P/B)
3. SPSM may have advantages over other passive small-cap strategies because of benchmark construction differences. The S&P Small Cap 600 Index places more emphasis on smaller, more profitable firms than other benchmarks like the Russell 2000. This has resulted in stronger returns on an annualized basis versus the Russell 2000, as the S&P SmallCap 600 has outperformed by about 1.7% per year since 1994.
Higher Growth Potential
Small-cap companies have the potential to grow faster than large-cap companies. This is because small-cap companies are often more innovative and disruptive than their larger counterparts. They also have less competition and more room to grow.
Favorable Economic Trends
The current economic environment is also favorable to some small caps. Higher interest rates and inflation can hurt large-cap companies, which may be more reliant on debt and have higher costs. Small-cap companies, on the other hand, may find it easier to pass on these costs to their customers.
On-Shoring
The trend back towards on-shoring is also a positive for small caps. Small-cap companies are more likely to be based in the United States and have less exposure to overseas markets. This means that they are less likely to be affected by tariffs and other trade disruptions. They are also less likely to be impacted by litigation.
SPSM Portfolio Characteristics (as of October 26, 2023)
Weighted Average Market Cap: $2.34 Billion
Est. 3-5 Year EPS Growth Rate: 7.82%
Price/Earnings Ratio: 11.57
Price/Book Ratio: 1.43
30 Day SEC Yield: 2.15%
Fund Distribution Yield: 1.10%
Assets Under Management= $7.54 Billion
Fund Expenses
The expense ratio for SPSM is 0.03% which was reduced from the original 0.05%. It is now the lowest cost small cap blend ETF offering. Some of its close peers are also listed below:
(SPSM)- 0.03%
( SCHA ) - 0.04%
( VB ) - 0.05%
( IJR ) - 0.08%
( IWM ) - 0.19%
Past Performance
SPSM is classified by Morningstar in the "Small Blend" category. As a well run index fund, SPSM has performed quite well over the longer term periods, although it has underperformed its peers more recently. Some of this recent underperformance may have been caused by growth stocks outperforming value stocks.
Here are the annual performance figures computed by Morningstar as of October 27, 2023.
| SPSM |
| Category (Small Blend) |
| +/- Category |
| Percentile Rank in Category |
| YTD |
| - 6.28% |
| - 4.38% |
| -1.90% |
| 76 |
| 1 Year |
| - 6.99% |
| - 4.37% |
| -2.62% |
| 73 |
| 3 Year |
| + 7.42% |
| + 6.43% |
| +0.99% |
| 39 |
| 5 Year |
| + 4.92% |
| + 4.68% |
| +0.24% |
| 50 |
| 10 Year |
| + 6.22% |
| + 5.57% |
| +0.65% |
| 36 |
Source: Morningstar
Three Year Total Return- SPSM vs. SPY vs. IWM
Here are the top ten SPSM holdings as of October 26, 2023:
Top 10 Holdings % Weight
| Applied Industrial Tech, Inc. ( AIT ) |
| 0.65% |
| SPS Commerce, Inc. ( SPSC ) |
| 0.61% |
| e.l.f. Beauty, Inc. ( ELF ) |
| 0.61% |
| Fabrinet ( FN ) |
| 0.60% |
| Comfort Systems USA ( FIX ) |
| 0.59% |
| Ensign Group, Inc. ( ENSG ) |
| 0.58% |
| Rambus Inc. ( RMBS ) |
| 0.57% |
| ATI Inc. ( ATI ) |
| 0.52% |
| SM Energy Co ( SM ) |
| 0.52% |
| Axcelis Technologies, Inc. ( ACLS ) |
| 0.49% |
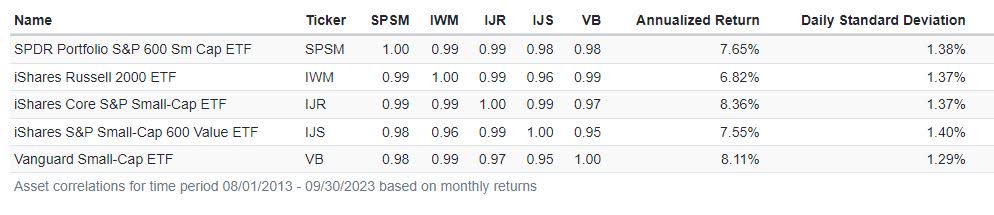
Long Term Fund Correlations Table
The following table of correlations compares SPSM with some other small cap stock ETFs. I have shown the annualized return and daily standard deviation for the time period from August 2013 through September, 2023.
Since these are all small cap index funds, it is not surprising that the correlations are quite high, although there are some differences in the screening criteria used in the various indexes. I was surprised that IJR has had a higher long term annualized return than SPSM, even though its expense ratio is a bit higher. This is likely due to a different tracking method. IJR uses full replication, while SPSM uses representative sampling. IJR also has had a slightly higher weighting to the technology and health care sectors.
ETF Ratings
- Morningstar: 3 Stars
- FactSet: A (10/27/2023)
- Efficiency: 100
- Tradability: 99
- Fit: 81
Volatility Measures (as of 09/30/2023)
1 Year Beta: 1.22 (more volatile than the S&P 500)
1 Year R- Squared: 0.728 (moderate correlation with S&P 500)
1 year Sharpe Ratio: 0.30
3 year Sharpe ratio: 0.53
1 Year Standard Deviation: 22.94
Commission Free Trading
Commission free trading is available for SPSM at most of the major online brokers. This gives you the ability to dollar cost average into SPSM without paying commissions. This can be very useful if you add to your portfolio on a regular basis.
Availability of Options For Hedging
SPSM does have option contracts available, but the liquidity on these is quite limited. For someone who is an active options trader who wants to use options to set up a covered call on a small cap ETF, you may be better off using IWM, which has more option contracts available with better liquidity and lower bid-asked spreads.
Summary
SPSM is a well-diversified fund with a slight small cap value tilt. It has $7.5 billion in assets invested in 601 securities. SPSM pays small distribution yield of about 1.1% and has a 30-day SEC yield of 2.15%. It is quite liquid and trades about 1.25 million shares a day.
SPSM is an excellent fund that can serve as a core holding, especially in a retirement account. It can be a "set and forget" investment for a small cap allocation that does not need much maintenance.
For further details see:
SPSM: A Good Way To Get Low-Cost Small Cap Exposure