SPSM - SPSM: Valuation Spread Between Small Cap Vs. Large Cap Too Big To Ignore
2023-10-26 11:36:20 ET
Summary
- I am increasing my equity exposure despite an imperfect setup due to the low valuation of the S&P 600 and S&P 400 indexes.
- Equal-weighted indexes historically outperform market cap weighted indexes, and I believe the current dominance of large-cap stocks is unusual.
- I recommend using S&P 600 and S&P 400 tracking ETFs for small and mid-cap exposure, respectively.
Introduction
I've been pretty conservatively positioned for most of this year. After the bank runs in March and into the spring, I never could find either comfort nor opportunity to increase my equity exposure. The result is that I punted and took the 5.5% type returns T-Bills offered for the next six months into September/October. That was a good decision but we still didn't have what I consider to be a prime opportunity in the S&P 500 to get invested again. I could have just returned to the T-Bill market for the balance of this year, but instead I did something I don't do that often: I decided to increase my equity exposure despite an optimal setup. It's not a terrible setup, but it's not perfect across the board. Mixed would be the best way to describe it. The factor that tipped the scale for me was this: The absolute forward valuation level for the S&P 600 (small-caps) and S&P 400 (mid-caps) is so low that I couldn't resist getting invested again. This fact coupled with the long historical outperformance of these two indexes versus their counterparts, led me to put my cash to work. Let's take a look at the details.
Valuation and Historical Relative Performance
First thing I'd point out if you haven't read my articles before, then you don't know that I'm a big proponent of equal-weighted indexes. Both as a measure for your own relative performance versus the market, but also because historically the equal-weighted S&P 500, the Invesco S&P 500® Equal Weight ETF ( RSP ) outperforms the market cap weighted version ( SPY ). I hear the opposite claim made often and incorrectly. There are really only two primary periods when market cap outperformed: the late 90s and the QE era. This year's resurgence definitely comes as a big surprise considering last year's performance, but the primary point I want to make here is that this is actually historically unusual.
YCharts
The above is the equal-weighted versus the market cap weighted total return variants. Another way to look at this is in absolute competition.
YCharts
The logic for why this is true is actually pretty simple, and is a derivative of the law of large numbers. Under normal circumstances, it just becomes increasingly more difficult to grow at high rates the larger a company becomes. This year the AI narrative has bucked that trend, and the largest 7-10 stocks have dominated returns for the ( NDX ) and ( SPX ). Here are the year-to-date returns for the S&P 500 market cap, equal weighted, and Russell 2000 (RUT) primary indexes. Yes, if you didn't know, the broad equity market is actually negative on the year through October 20th.
YCharts
I'm giving you breadcrumbs so far to explain that there is a spread between a few and the majority of stocks, and hopefully you understand now why I'm more interested in those 'other' stocks from a long-term historical perspective. That still doesn't explain why I've moved my cash from T-Bills into small and mid-caps though. The bottom line is that the forward P/E ratio on those indexes is very low and the spread versus the large is significant. Ed Yardeni puts out a market valuation overview and the following chart caught my attention in recent months.
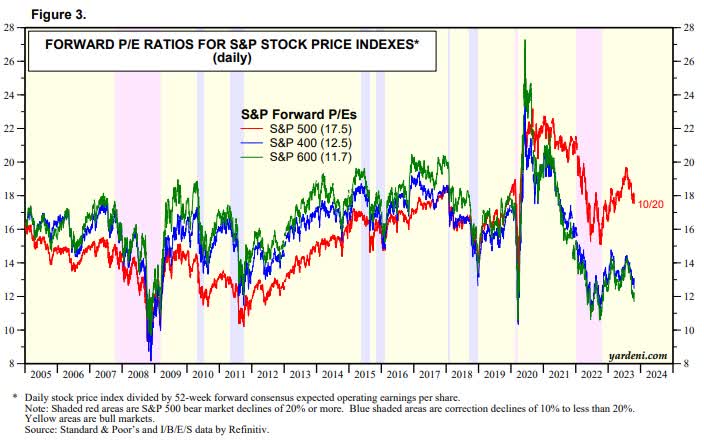
For the S&P 400 and 600 we have a forward P/E ratio slightly above and below 12x. That is comparable to the end of 2022, the pandemic low in 2020, and the financial crisis in 2008-09. Note for how long the 'SMid' caps were valued above large caps, and how much cheaper they are on an absolute basis versus the '05-'07 era. If you're thinking something like 'what about interest rates and how they figure into this analysis,' then take a look at the 10-year treasury rate over this same period of time.
YCharts
The forward P/E ratio is about 4-5x below that '05-'07 time period when the 10-year Treasury rate was right in this neighborhood. Admittedly, the trajectory and pace of increase has to be part of this analysis but that's a massive spread on an index, as well as the relative spread between large caps and the rest of the market. The combination of absolute and relative forward P/E ratios piqued my interest enough to encourage me to look for even a good, not perfect, opportunity to start getting exposure to those two segments of the equity market. This qualifies as 'I'd rather be early than late' type of opportunity, and given that I don't have the time to try and nail the timing anymore, I decide to get in there now.
ETF's of Choice
The astute reader will notice that I've discussed or shown two different depictions for the small-cap segment: Russell 2000 and S&P 600. This is where I admit something that I'm frankly embarrassed I didn't know decades ago. I've been working and or investing in the markets since 1995. Generally, it has almost always been individual securities not ETFs and Indexes. I've always gone with the Russell 2000 as the example of small cap performance, and I never looked deeply into the S&P 600 or how the index was constructed. The first time I noticed the spread in Yardeni's chart was the first time I really asked why. I knew the Russell 2000 didn't look anywhere close to as cheap. The more I investigated the more I liked.
YCharts
If the above was a stock, you'd never sell it. That's the ratio between the S&P 600 and Russell 2000 total return. Both are small cap indexes, but one is consistently outperforming the other. What's going on here? I think it's the index construction itself. Here's S&P's argument for the difference , and here's a simple chart that shows the keys.
spglobal.com
It's not to say that liquidity or public float doesn't matter, but the one that sticks out to me is the first titled Financial Viability . The companies in the S&P 600 are all profitable, and if they lose money in the most recent quarter then they are removed. Looking at that relative chart versus the two indexes, I'd say sticking with earnings is working very well. From now on, I'll always be using an S&P 600 tracking ETF when I want small cap exposure.
The S&P 400 representing mid-caps also looks cheap in absolute and comparative measures. Historically it also tends to outperform the larger cap brethren if to a lesser degree, but they also correlate more tightly with the large cap S&P 500. They are a good proxy to eke out some extra performance normally while trading tightly with the overall large cap index most use to measure 'The Market.'
YCharts YCharts
Given the absolute valuation levels, historical outperformance, and relative spread in valuation to the large caps, I knew I wanted to get exposure to the S&P 400 and 600 indexes for my equity exposure. The next question was to pick which ETF vehicles.
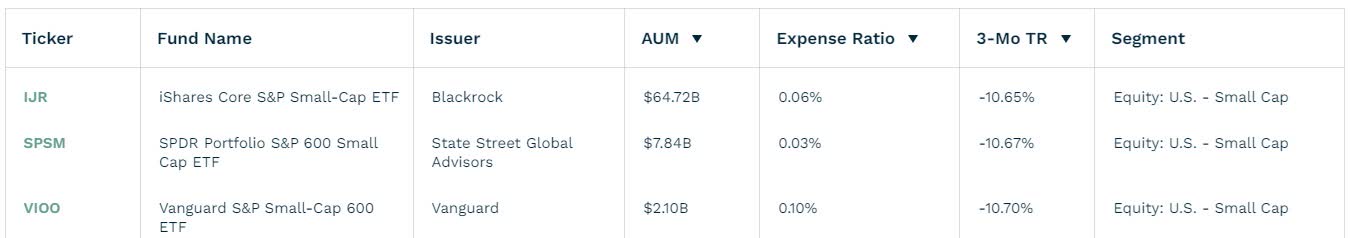
There are three primary un-levered options for the S&P 600 tracking ETF: ( IJR ) ( SPSM ) ( VIOO ). They all track within a few basis points of one another's total return. Outside of assets under management, the primary difference is the expense ratio. For my needs there is plenty of liquidity in the cheapest option, so I went with the SPDR® Portfolio S&P 600 Small Cap ETF ((SPSM)). All three will serve their purpose though and I have no issue if one chooses another.
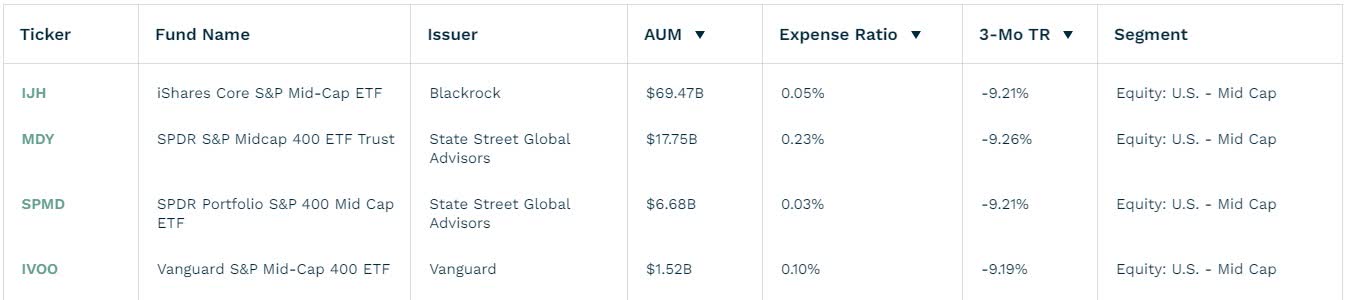
We have four options for the S&P 400: ( IJH ) ( MDY ) ( SPMD ) ( IVOO ). Again, all are within a few basis points of performance, and again I went with the cheapest expense ratio of SPDR® Portfolio S&P 400 Mid Cap ETF ((SPMD)).
Risk: Timing
I've mentioned this a number of times, but I don't think this is a layup in terms of timing for getting more equity exposure. Nor do I have any technical signals that suggest the SMid caps are finally going to turn the relative corner on the large caps. Valuation is rarely a good timing mechanism for entry and exit points. However, if used from a long-term perspective, valuation generally is a very good forecaster of likely future returns. That's a long way of saying I don't know about the next three months, but I'm fairly confident over the next 10 years I'm in a better place right now than owning the S&P 500 market cap weighted index.
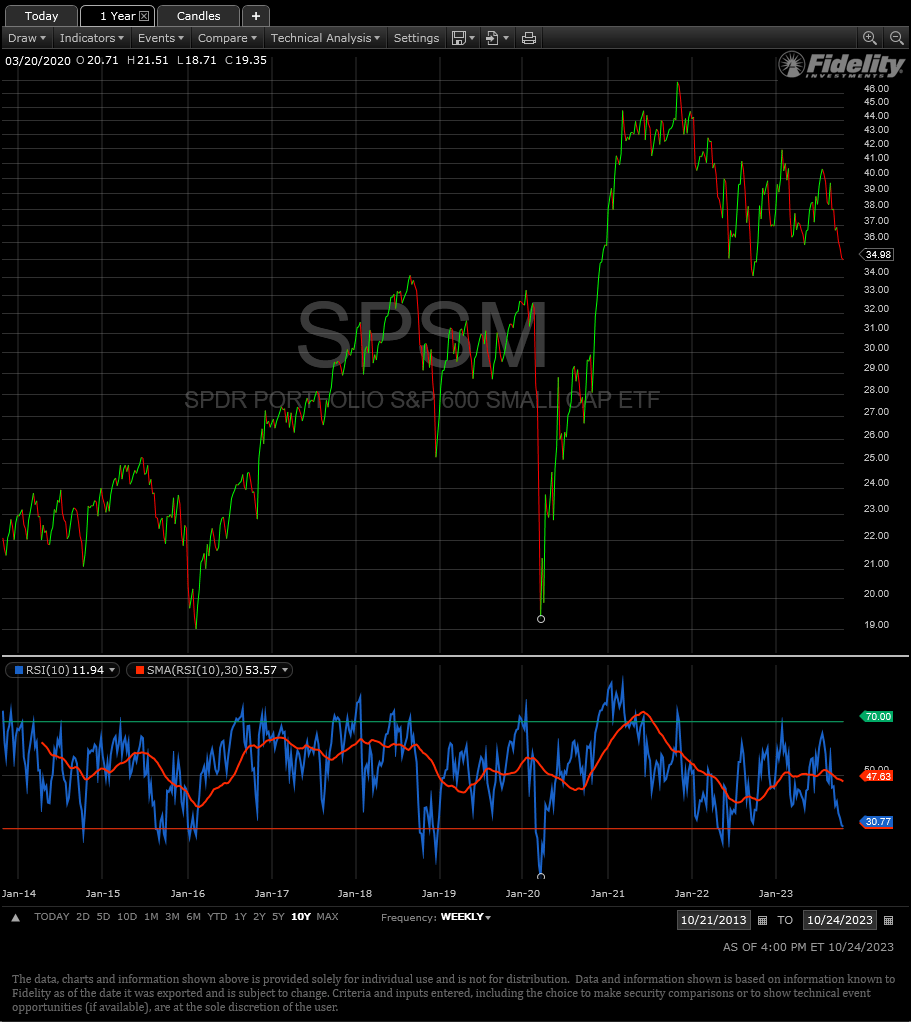
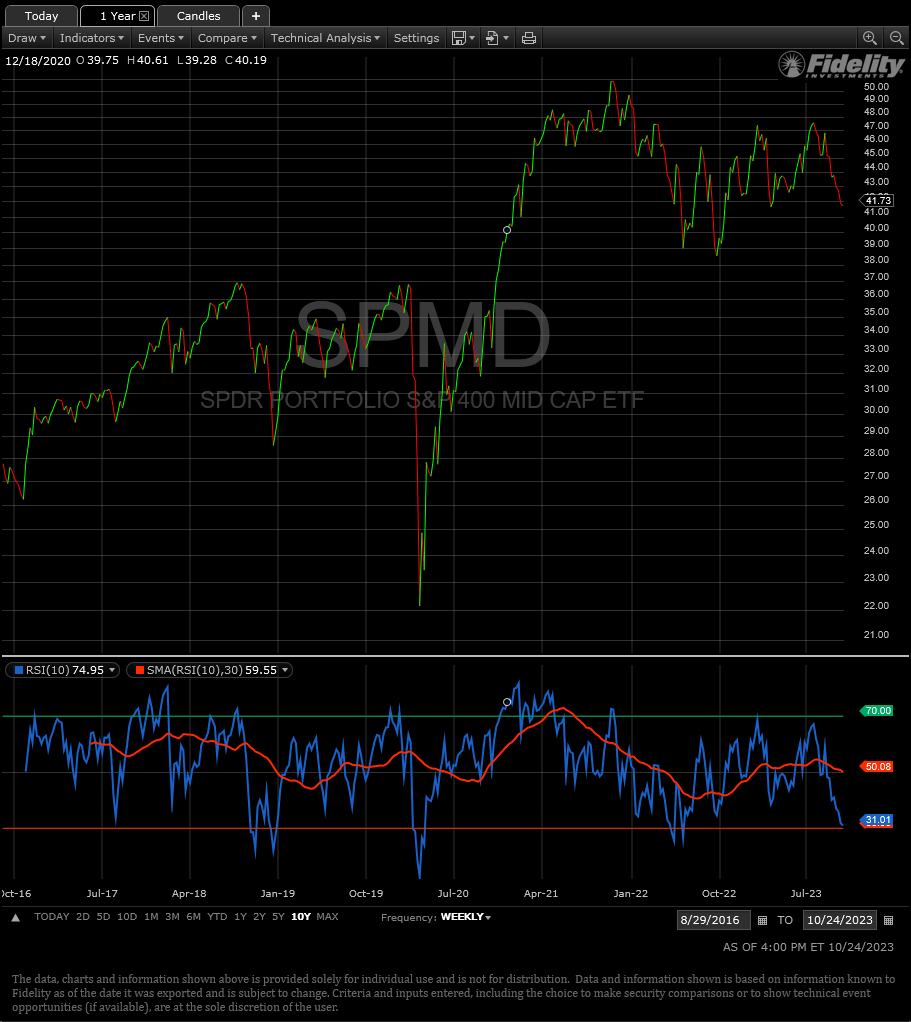
There are also technical elements I see that suggest timing isn't bad if not a perfect setup. The weekly (10) RSI for SPSM and SPMD are in the buy interest zone. Over the last ten years it has gone lower, and had two occasions when it had a second leg down before finishing, but as a general statement we're in the zone of a good intermediate-term oversold signal.
Fidelity Active Trader Pro Fidelity Active Trader Pro
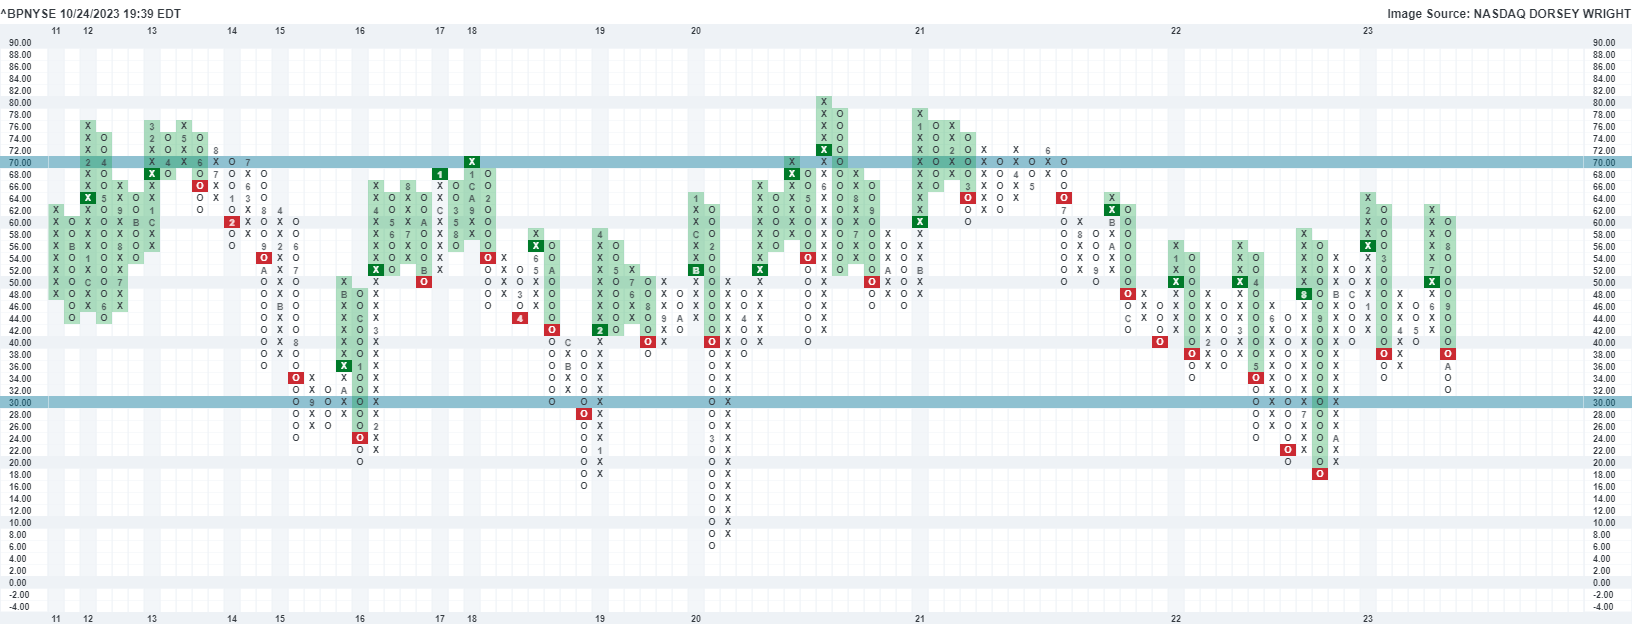
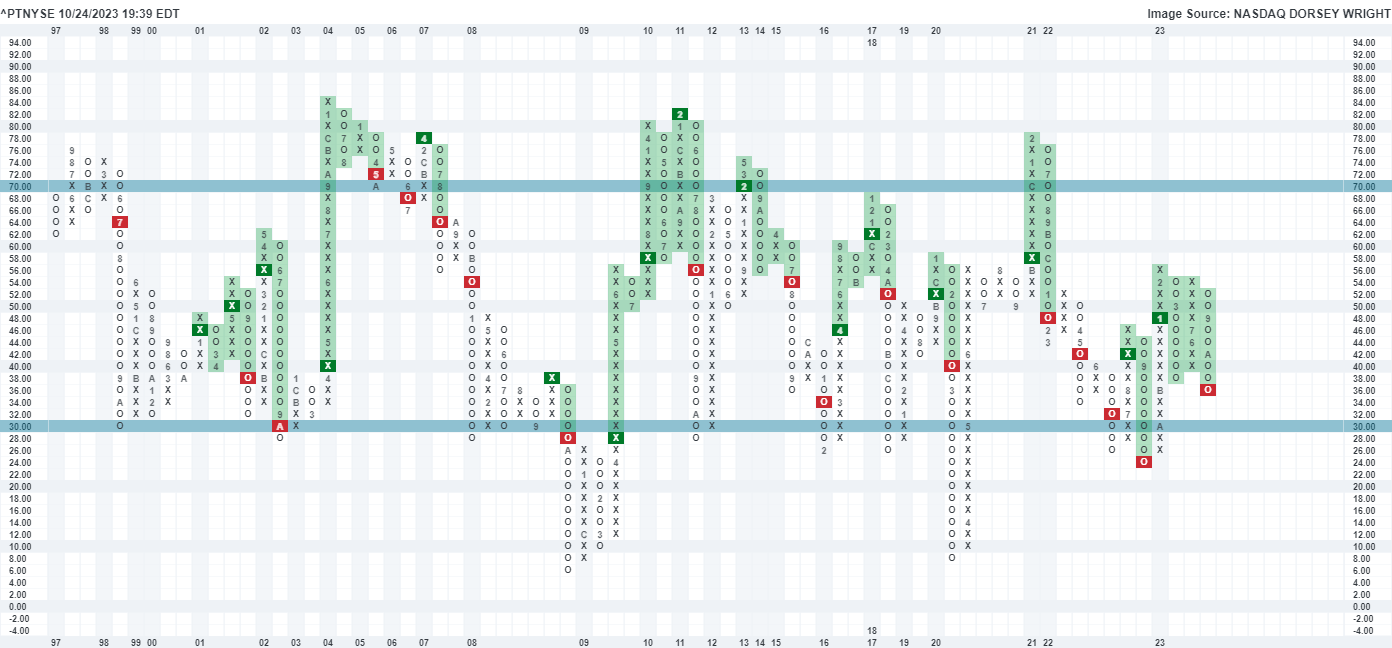
The two most important market timing Point & Figure indicators I follow are also in the zone if not perfect for a long setup. The Bullish Percent on the NYSE, and the Percentage Trend Positive on the NYSE, suggest the market is fairly oversold historically, but not at a back-up-the-truck level as we've seen in some previous periods.
dorseywright.com dorseywright.com
Sentiment indicators are somewhat favorable, but again not quite at the perfect level that I usually wait for to get invested. The total Put/Call figures have been high in recent months, but I admit I struggle to trust that data now with the rise in extreme short-term option usage as it reflects forward protection. I'm probably going to have to wait for a few years before using option position data again after we've seen how it works through stock cycles.
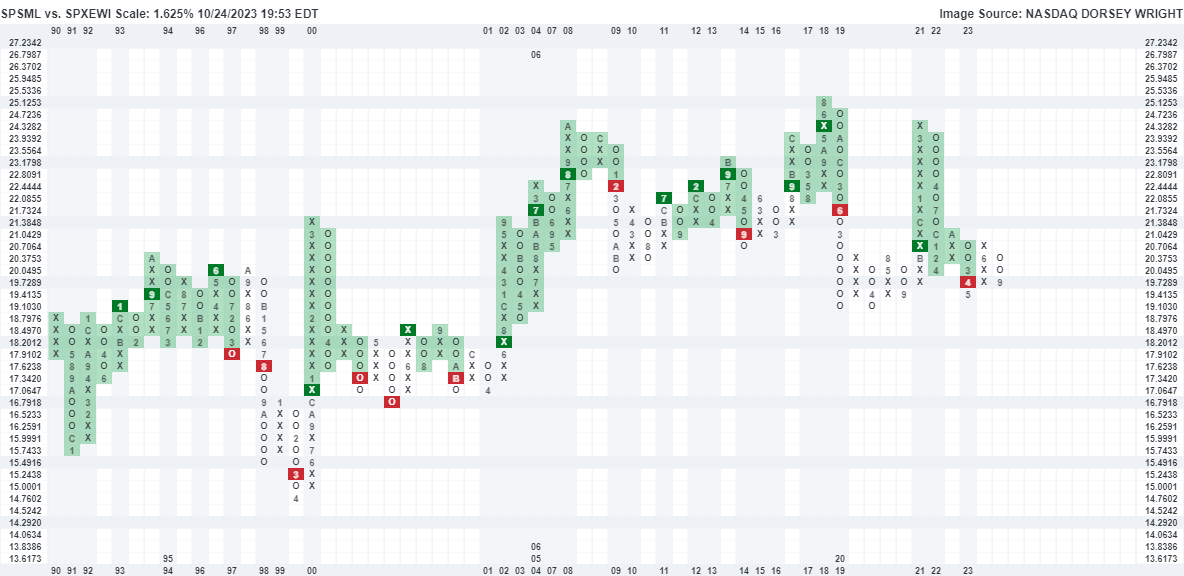
Finally, I'm a big proponent of waiting for the relative signal from asset classes in particular before jumping into a long-term trade. The above point and figure chart is of the S&P 600 small-cap index versus the S&P 500 equal-weighted index. Technically the 600 is still in a relative sell signal albeit in a recent zone of relative support. That fairly sums up my view here. If I hadn't been as conservative as I was earlier this year, then I might be more reluctant and decide to wait until a hopefully better setup appeared. I won't fault anyone for deciding to do that with nearly 5.5% T-Bill rates of return available.
Conclusion
While the market timing risk is debatable, in the end the absolute and relative valuation for the S&P 600 & 400 proved too enticing for me to ignore. I've increased my equity exposure to both SPSM and SPMD, and shifted some of my large-cap exposure into those two buckets. The risk that the timing is off is always legitimate. This reminds me of taking on Emerging Market Equity exposure some years ago mostly due to the sustained relative underperformance and cheap overall valuations. Over the last year that relationship is better than it has been, but for two-plus years it kept going the other way. On the flip side, I did the same thing with Broad Commodities that took some time to work, but once it popped in the aftermath of the pandemic, the trade worked out extremely well significantly outpacing equities over that time span.
YCharts
The above chart also shows how you need to harvest gains when some of these trades work like with commodities.
If there's one thing I hope the reader takes away from this article though, is that you should be looking to S&P 600 for your small-cap exposure in the future over the Russell 2000. It simply has been a much better vehicle for the long haul. Good luck to everyone investing out there.
"Editor's Note: This article was submitted as part of Seeking Alpha's Best Value Idea investment competition , which runs through October 25. With cash prizes, this competition -- open to all contributors -- is one you don't want to miss. If you are interested in becoming a contributor and taking part in the competition, click here to find out more and submit your article today!"
For further details see:
SPSM: Valuation Spread Between Small Cap Vs. Large Cap Too Big To Ignore