SPXX - SPXX: A Fund That Trades Upside For Yield
Summary
- The SPXX fund dynamically sells calls on 35-75% of the notional value of the fund.
- It pays an attractive 7.5% forward yield.
- Overwriting strategies trade off return upside for premium income. This causes total returns to suffer in the long-run.
The Nuveen S&P 500 Dynamic Overwrite Fund (SPXX) sells S&P 500 Index calls to generate premium income to fund a generous 7.5% distribution yield.
While the distribution yield may appeal to income-oriented investors, one word of caution is that this tradeoff causes the fund to underperform in total returns in the long-run.
Fund Overview
The Nuveen S&P 500 Dynamic Overwrite Fund is a closed-end fund ("CEF") designed to offer attractive total returns by selling call options on the S&P 500 Index while holding an equity portfolio designed to track the S&P 500 Index.
Due to federal income tax considerations, the SPXX fund does not hold all of the common stocks in the S&P 500 Index, nor have the same weightings as the index. Instead, the SPXX fund invests in a representative portfolio of stocks that matches the overall portfolio characteristics of the S&P 500 Index.
The SPXX fund employs a 'dynamic overwrite' options strategy that sells call options on a varying percentage of the fund's equity portfolio, depending on the manager's outlook. Under normal conditions, the fund aims to sell call options on 35-75% of the notional value of the fund's equity portfolio, with a long-term target of 55%. The fund can also employ other option strategies such as call spreads and selling put options to capitalize on market inefficiencies.
The SPXX fund has $266 million in net assets and charges a 0.93% total expense ratio.
Portfolio Holdings
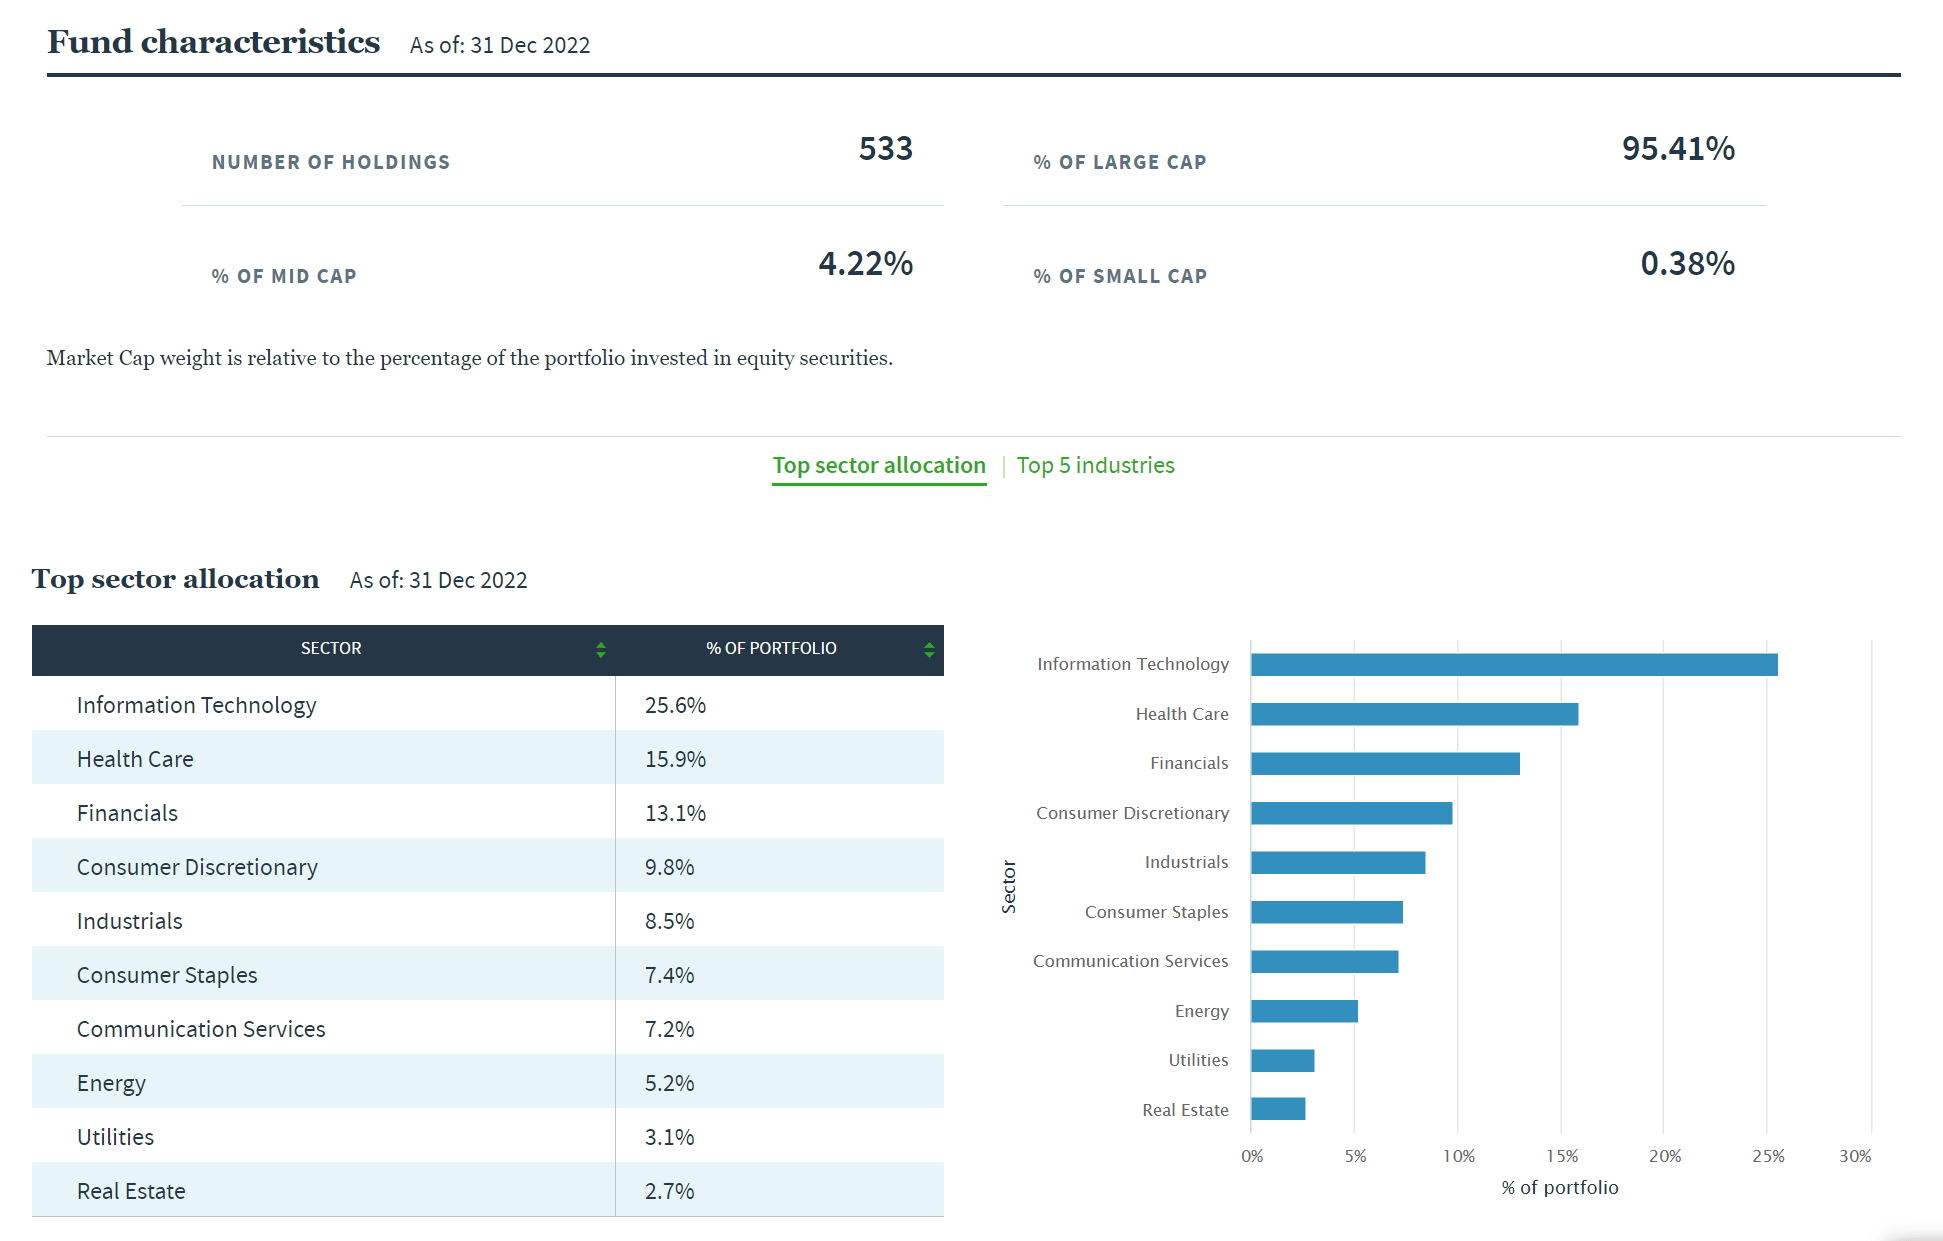
The SPXX fund has 533 holdings as of December 31, 2022. Figure 1 shows the sector allocation of the SPXX fund.
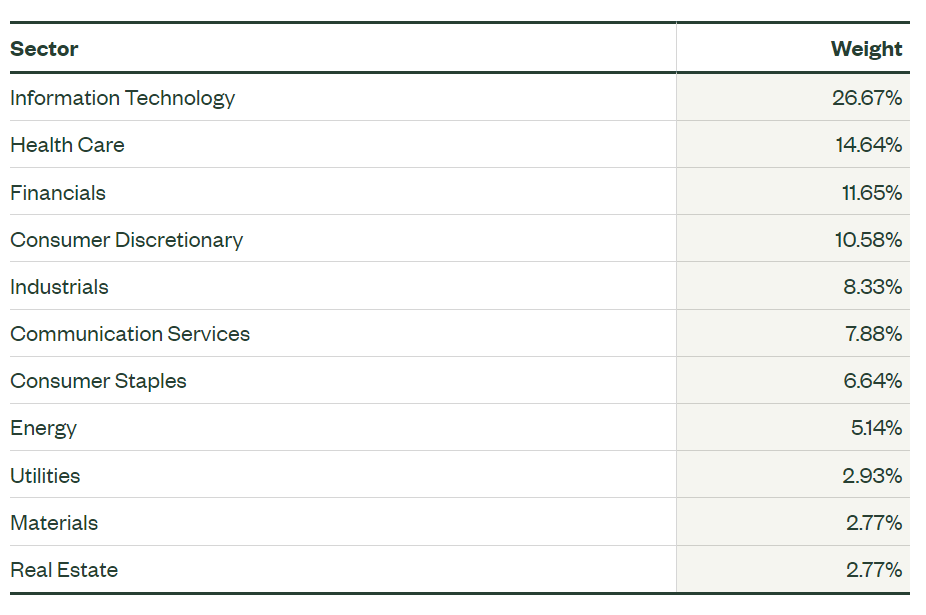
Relative to the S&P 500 Index, as represented by the SPDR S&P 500 ETF Trust ( SPY ), the SPXX has slight overweights on healthcare (15.9% vs. 14.6%), financials (13.1% vs. 11.7%) and consumer staples (7.4% vs. 6.6%) (Figure 2). SPXX is underweight information technology (25.6% vs. 26.7%), consumer discretionary (9.8% vs. 10.6%), and communication services (7.2% vs. 7.9%).
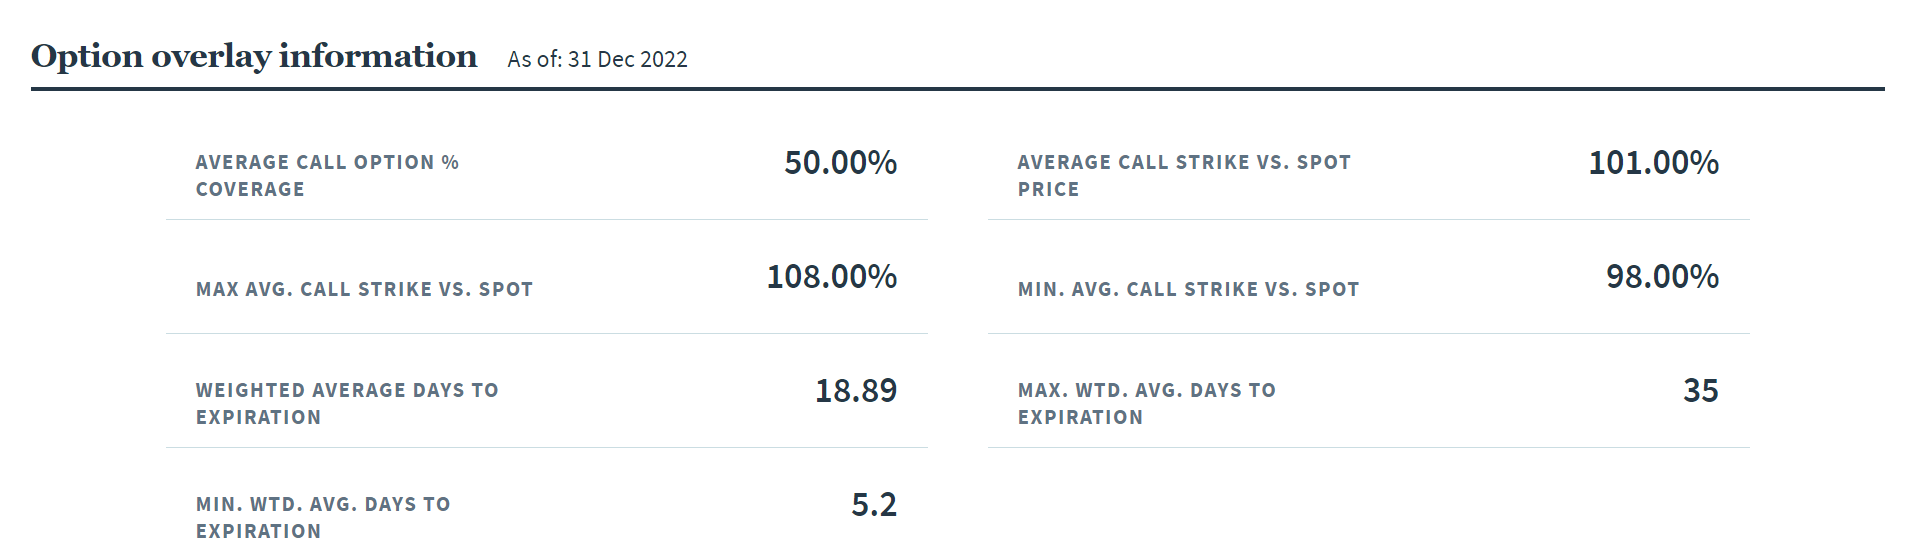
Figure 3 shows information on SPXX's option overlay strategy. As of December 31, 2022, the SPXX fund has sold call options on 50% of the portfolio with average strike price 1% above spot (1% OTM).
This means that if the S&P 500 Index rallies more than 1% before the options expire, then the fund may be liable to pay the difference between the spot price and the strike price at expiry (assuming the fund has sold S&P 500 Index call options which are cash settled).
Returns
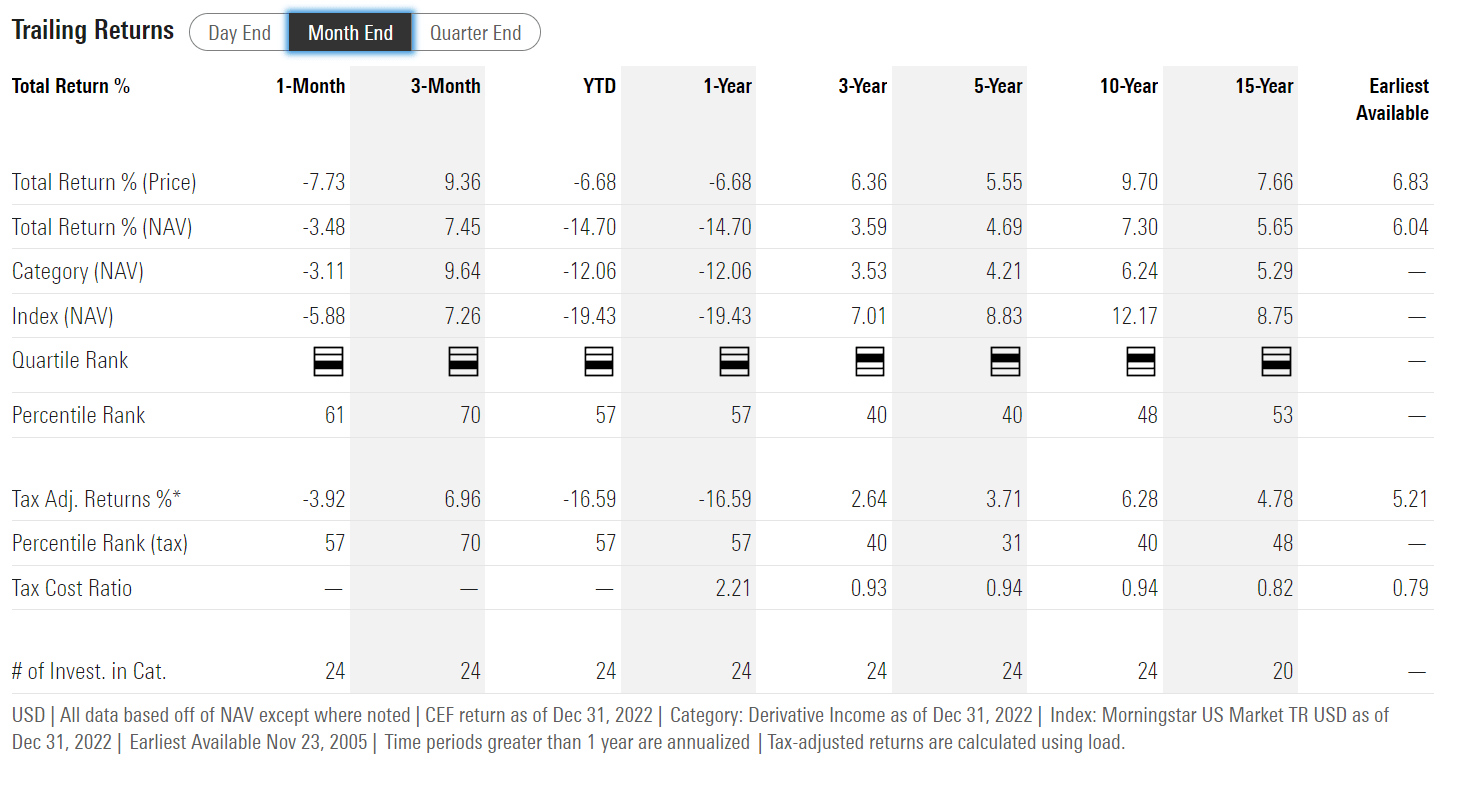
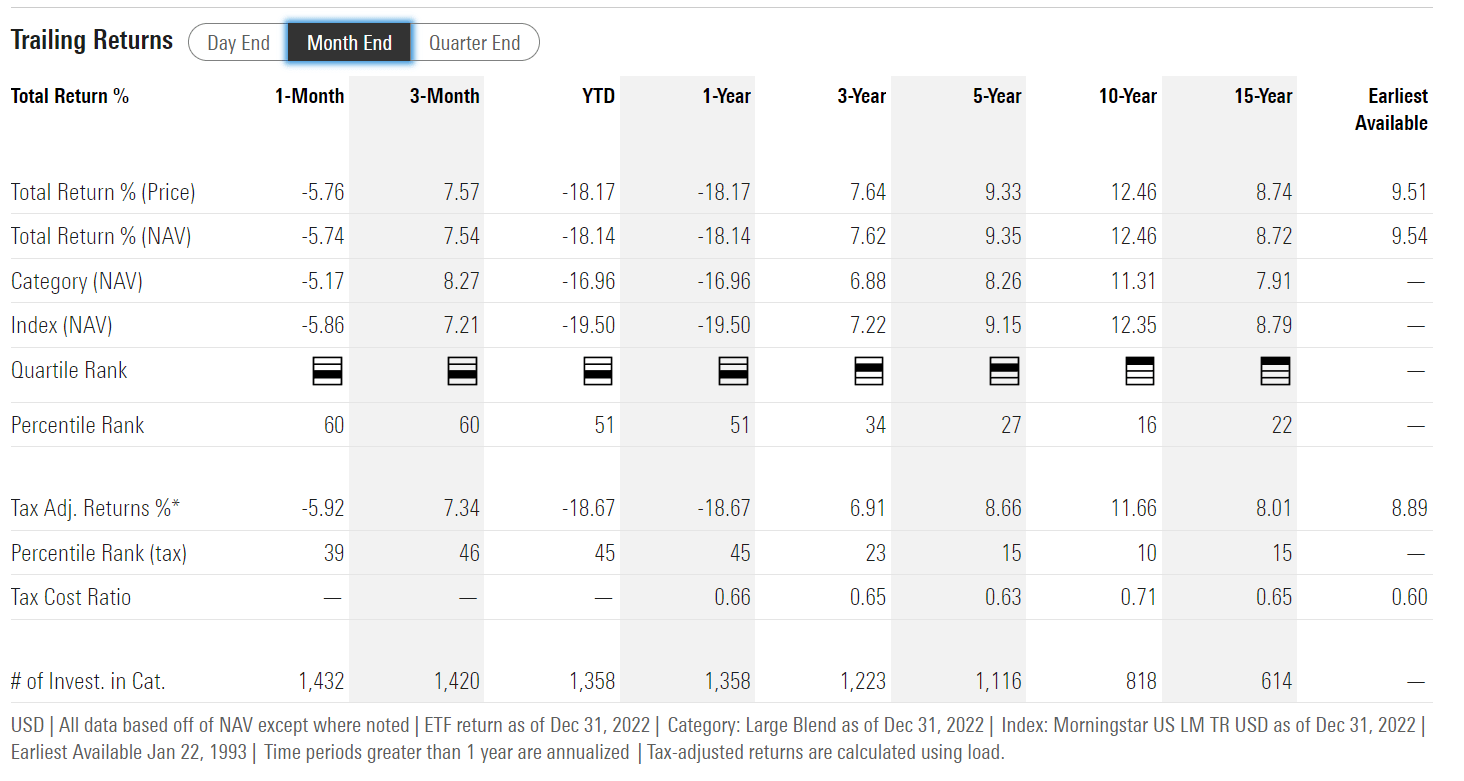
The SPXX fund has delivered modest long-term returns with 3/5/10/15 Yr average annual NAV total returns of 3.6%/4.7%/7.3%/5.7% respectively to December 31, 2022 (Figure 4).
Investors should note that due to the fund's strategy of selling call options, it has traded off a significant portion of the portfolio's 'upside'. Hence compared to the SPY ETF, the SPXX has underperformed significantly on long-term time frames (Figure 5).
Distribution & Yield
As mentioned above, the SPXX fund trades off a portion of the portfolio's 'upside' for option premiums that are paid to investors as distributions. This has allowed the SPXX fund to pay a fairly high distribution yield, currently set at $0.294 / quarter or 7.5% forward yield.
Heavy Use Of ROC
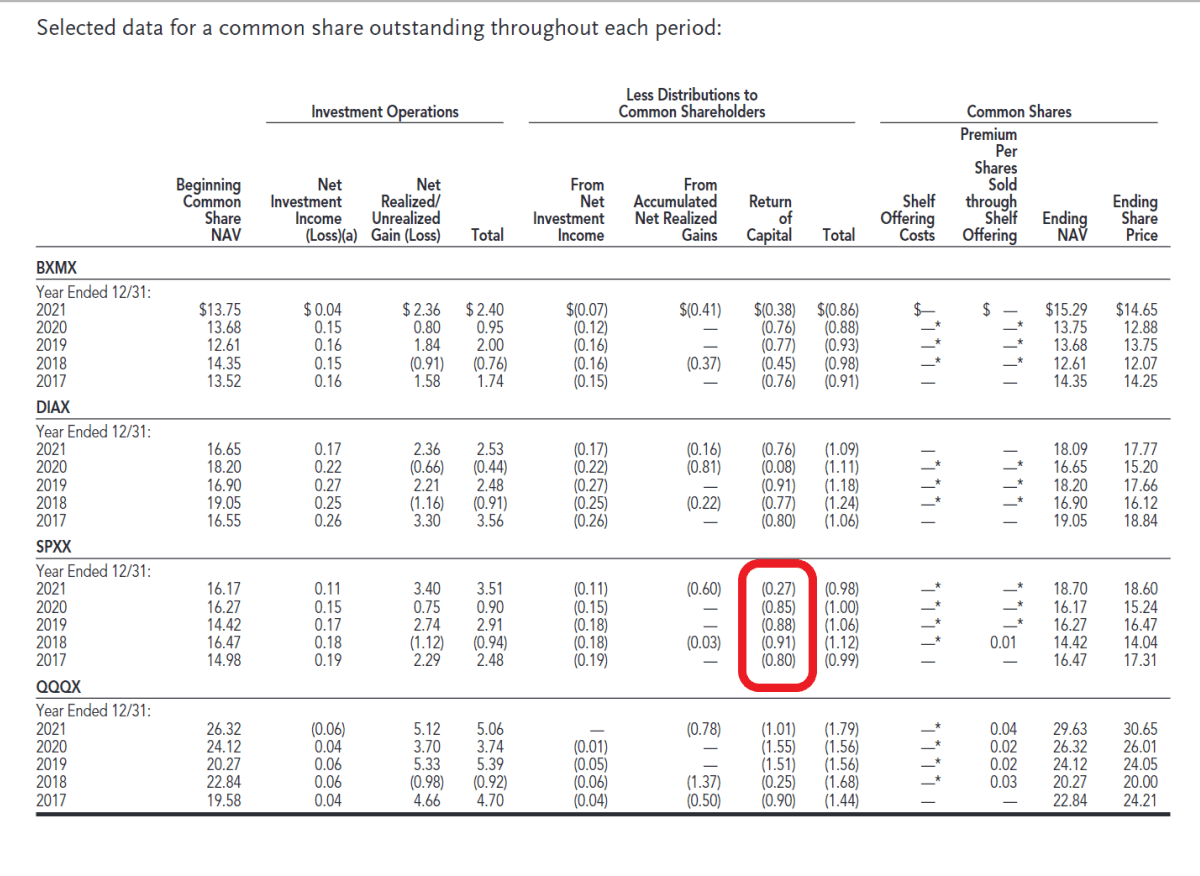
From the SPXX fund's annual report, we can see that the fund has relied heavily on 'return of capital' ("ROC") to fund its historical distributions (Figure 6).
Figure 6 - SPXX uses ROC to fund distributions (SPXX annual report)
However, readers should note that ROC is not necessarily a bad thing. Distributions classified as ROC may actually receive preferential tax treatment (although investors should consult a tax professional regarding their individual tax situation).
Instead, I prefer to gauge fund distributions using the economic concept 'return of principal' . Funds that earn their distributions generally see long-term increase in their after-distribution NAV, whereas those that do not earn their distributions will see a shrinking NAV.
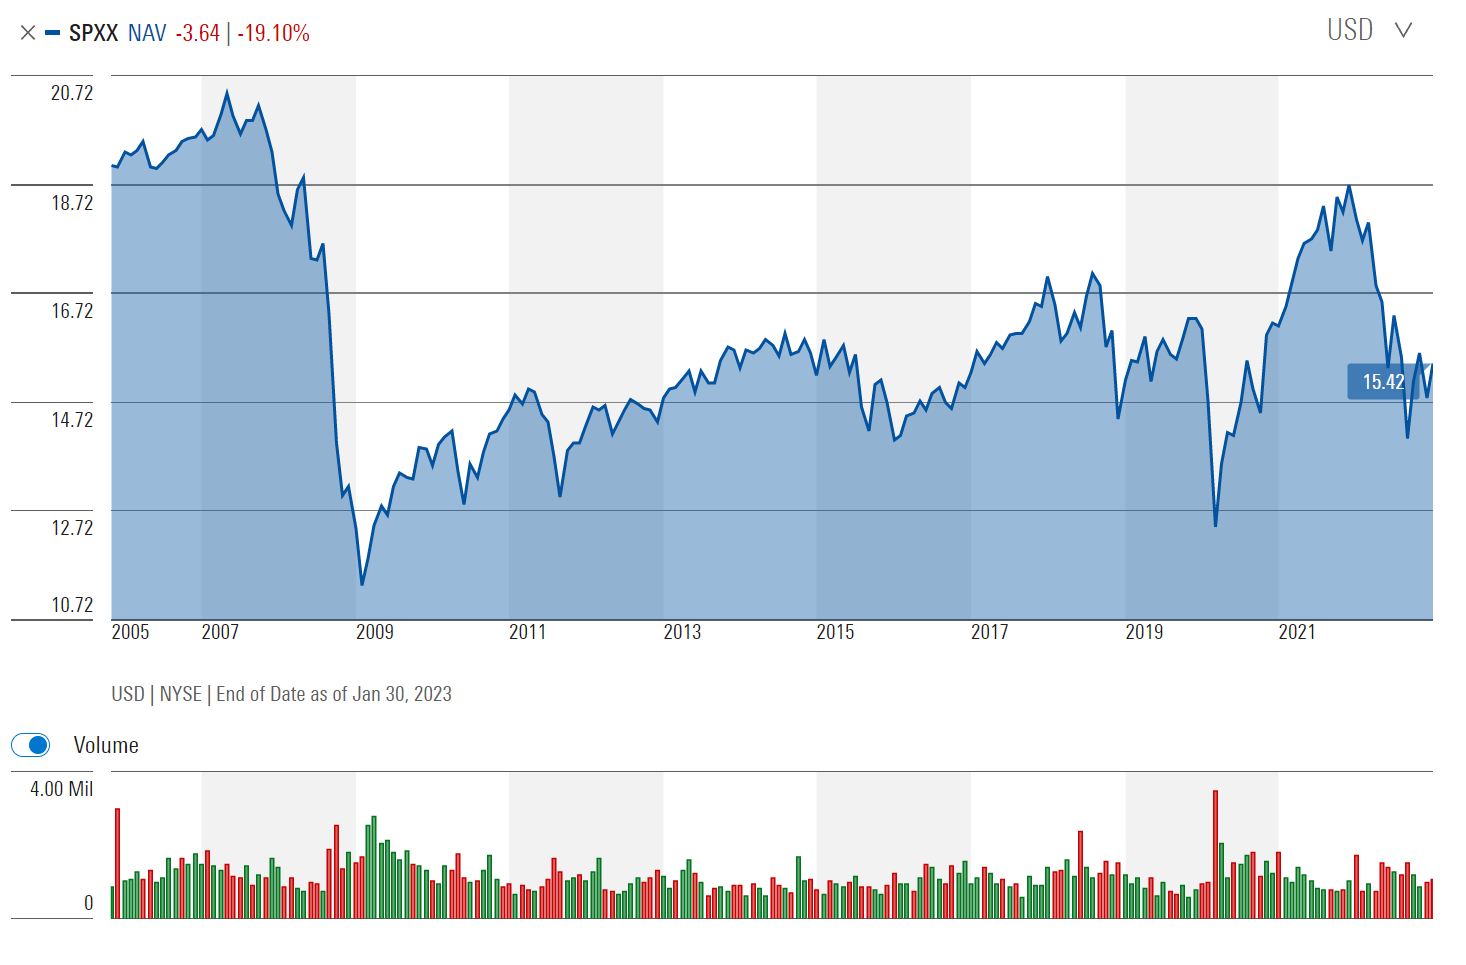
With regards to SPXX, I have concerns that the fund may not be earning its distribution, as it only has a 5Yr average annual return of 4.7% vs. the forward yield of 7.5%. Visually, we can see that SPXX's long-term NAV has declined from $19.10 at inception to $15.42 recently (Figure 7).
Figure 7 - SPXX NAV has declined over the long-term (morningstar.com)
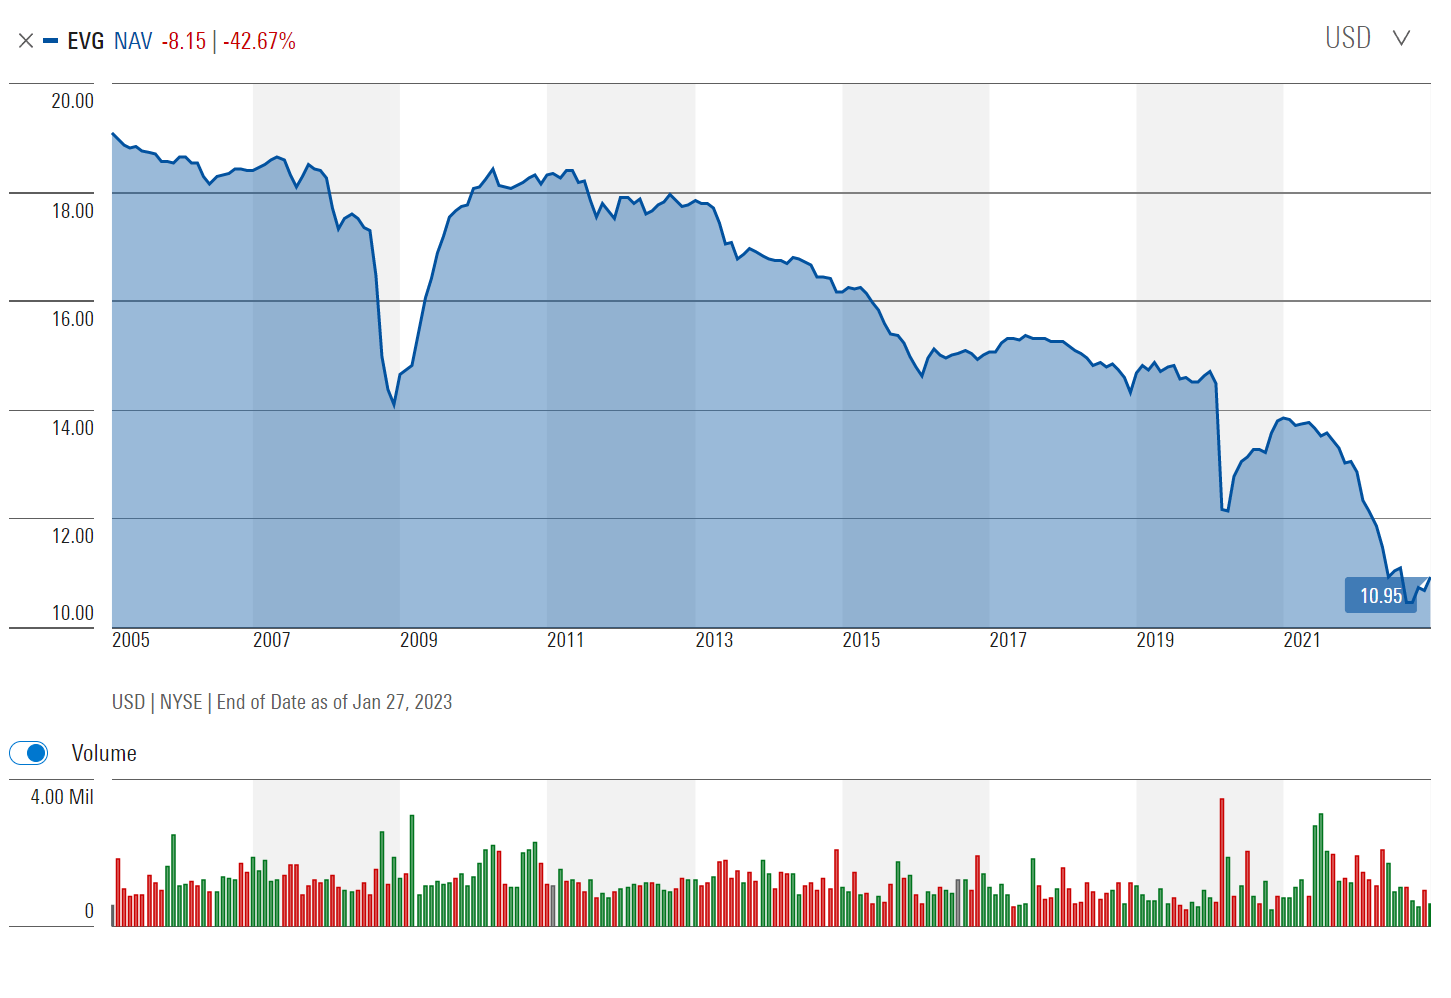
However, SPXX's long-term NAV trend is different from classic 'return of principal' funds like the Eaton Vance Short Duration Diversified Income Fund ( EVG ) that I wrote about recently . Figure 8 shows EVG's NAV progression for comparison.
Figure 8 - EVG is a classical return of principal fund with shrinking NAV (morningstar.com)
Instead, SPXX's NAV appears to suffer from periodic crashes (2008, 2018, 2020, 2022) followed by gradual recoveries.
Cutting Off The Right Tail
The problem with SPXX, and overwriting strategies in general, is that call selling fundamentally changes the returns distribution of a fund. For example, let's assume the SPXX fund sells monthly 2% OTM calls on the S&P 500 Index (note, although SPXX does not disclose the moneyness of calls it sells, we know the fund were short calls ranging from 98% of spot to 108% of spot as of December 31, 2022, so 2% OTM seems like a reasonable assumption).
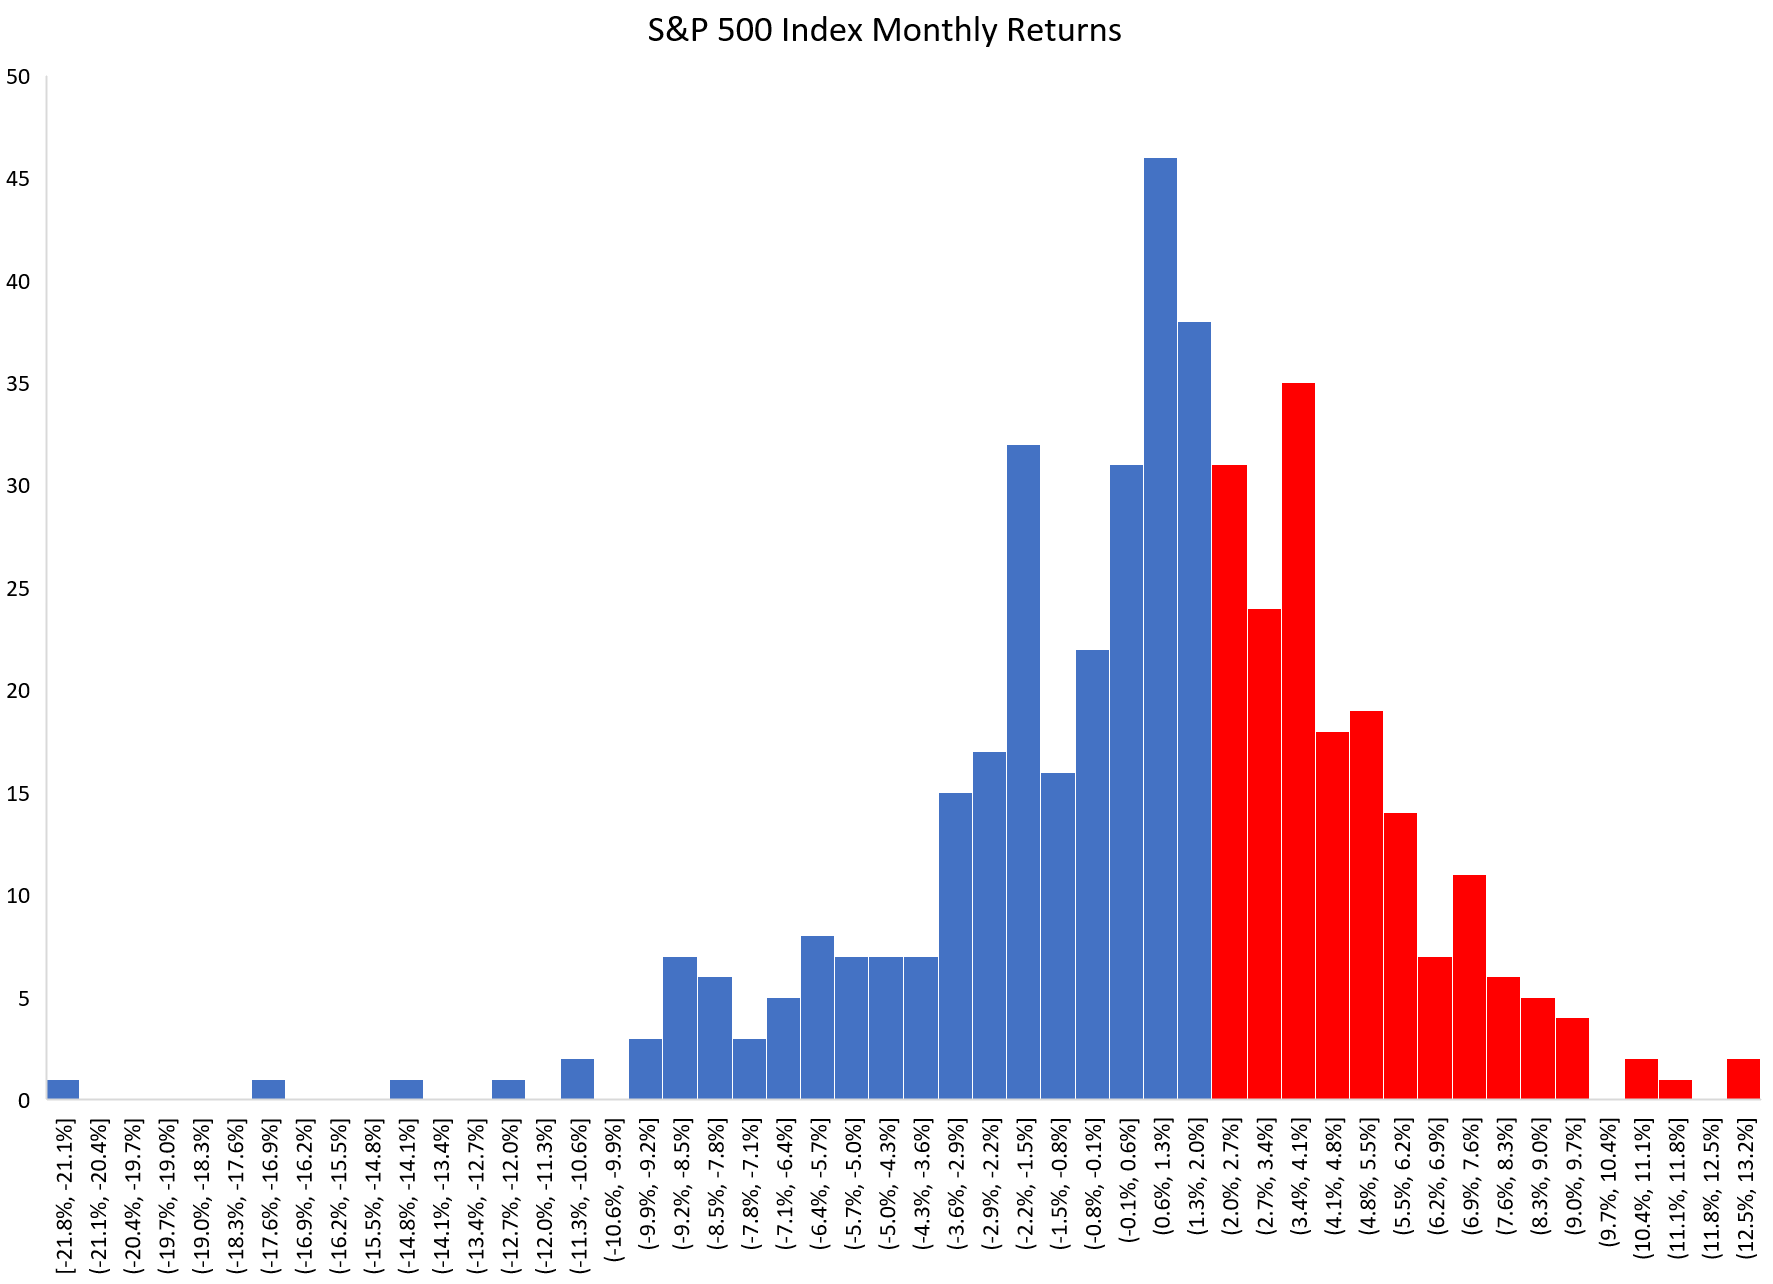
Figure 9 shows the historical monthly returns on the S&P 500 Index. Out of 455 monthly returns since 1985, 179 months or 39% of the time, the S&P 500 Index returned more than 2%. In those months, an overwriting strategy selling 2% OTM calls would have significantly underperformed as the options would expire in-the-money ("ITM"), requiring cash payment from SPXX to settle.
Figure 9 - Historical S&P 500 Index monthly returns (Author created with returns from Yahoo Finance)
On the other hand, selling calls only marginally improves the downside capture of the fund, since the call premiums received is typically small relative to negative monthly returns, especially during crashes where one month returns could be -10% or more.
Therefore, investors are left with a NAV profile resembling figure 7: trading off upside for small monthly premiums during calm periods but suffering periodic crashes that can permanently impair principal.
Conclusion
The Nuveen S&P 500 Dynamic Overwrite Fund provides a high distribution yield through selling S&P 500 Index calls on roughly half of the portfolio's notional value. The SPXX fund has generated modest historical returns that have been less than its distribution yield in recent years.
The fund's NAV profile is characterized by sharp declines followed by gradual recoveries, as the SPXX fund has given up a significant portion of the portfolio's upside while retaining much of the downside. I personally do not find this tradeoff attractive, although it may have merit for income-oriented investors.
For further details see:
SPXX: A Fund That Trades Upside For Yield