JNK - SPY: It's Time To Book Some Profits (Technical Analysis Rating Downgrade)
2023-08-02 09:00:53 ET
Summary
- SPDR® S&P 500 ETF Trust has rallied significantly but faces a high risk of retracement after an extended run.
- Market breadth indicators show signs of exhaustion and struggle to overcome recent highs.
- Weaknesses are building up in some sectors, and the CBOE Volatility Index suggests a possible overly enthusiastic sentiment in the equity market.
- The assumption of a new upward impulse sequence has to be confirmed through the formation of wave 4 at specific targets.
- By considering multiple outcomes and setting up an adequate contingency plan, investors are less inclined to act driven by emotions, as this could come at a higher cost.
In my last analysis "SPY: Every Cloud Has A Silver Lining" published on March 9, 2023, I suggested the SPDR® S&P 500 ETF Trust ( SPY ) likely was forming a new upward impulse sequence with the index likely forming wave 3. SPY has massively rallied in the past few months, and could head towards the historical high, but after such an extended run, the risk of a retracement has become considerably high. In this article, I examine the most important indicators and price levels I consider in my technical analysis concerning the SPY. I discuss multiple scenarios and tactics and show how all the considered elements lead me to change my rating.
An overview of the actual situation
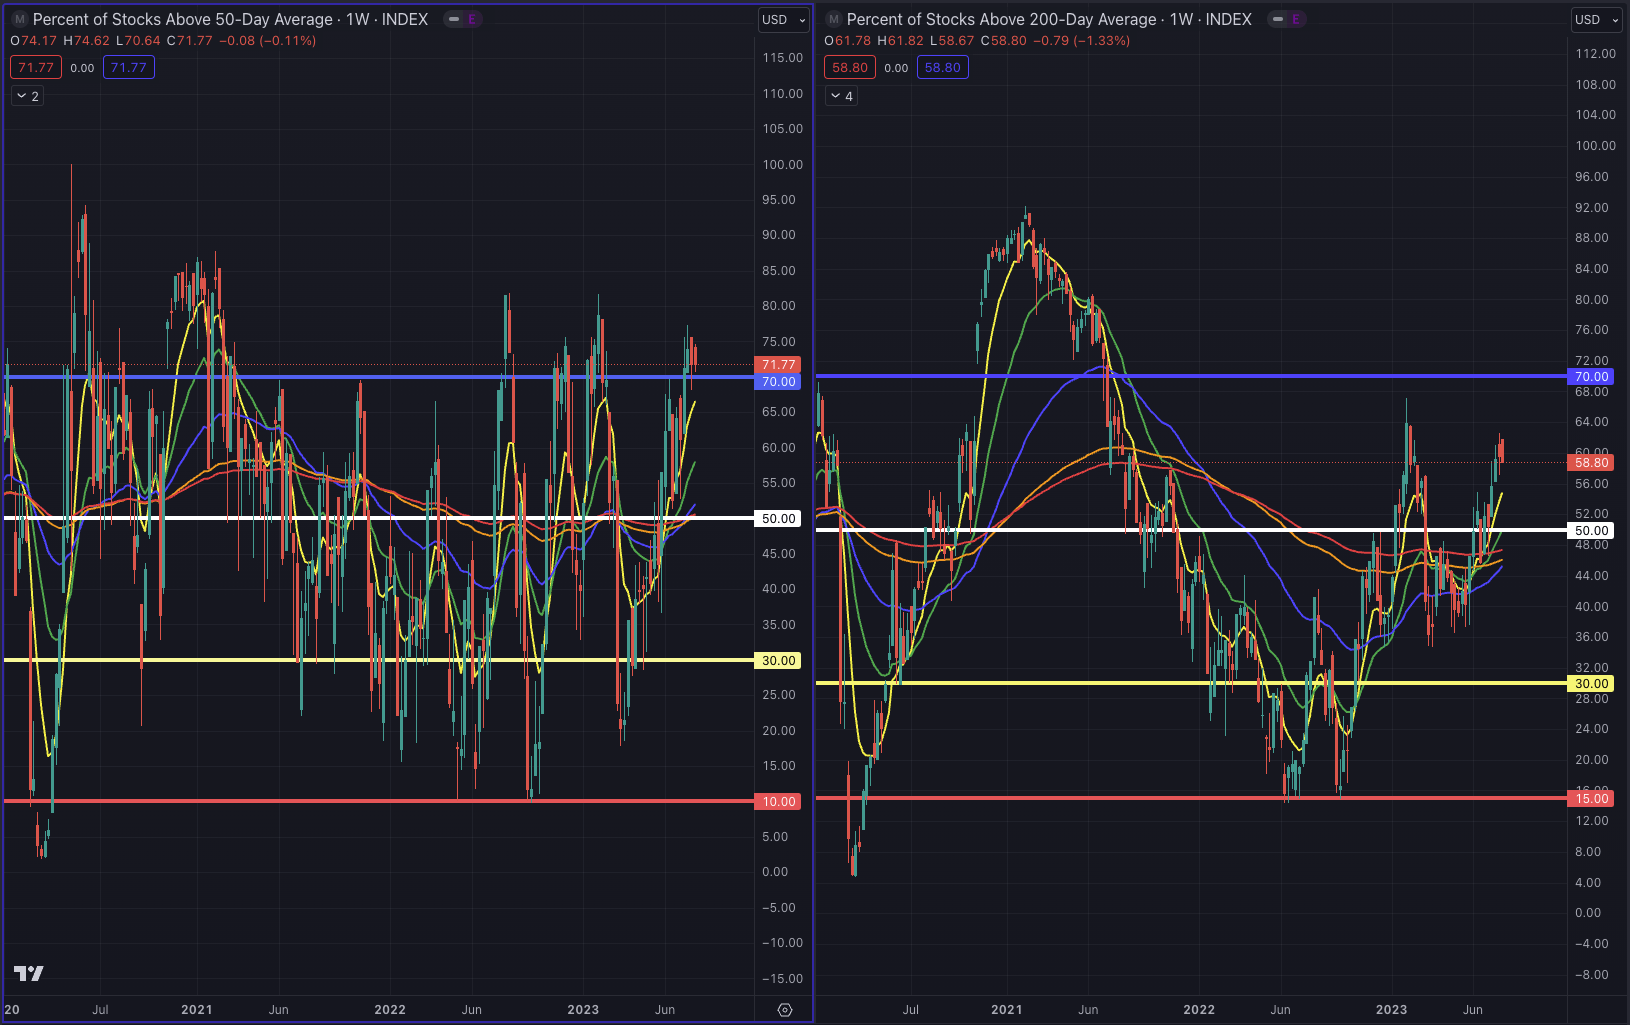
We will first be reviewing the most important indicators I observe when evaluating the conditions of the major indexes in the U.S. financial markets. The Market Breadth measured by the MMFI, as a percentage of stocks above their 50-day moving averages [MAV], has surpassed the 70% mark, a situation we last observed between November 2022 and February 2023 and back further in August 2022. The index is giving some signs of exhaustion, as it seems to struggle to overcome the recent top. The MMTH, measuring the percentage of stocks above their 200-day MAV, is instead still under the 70% mark and couldn't, for now, overcome the heights observed during February 2023. Despite the participation in the rally being relatively broad, about 41% of the stocks still seem to struggle to exit their long-term downtrend.
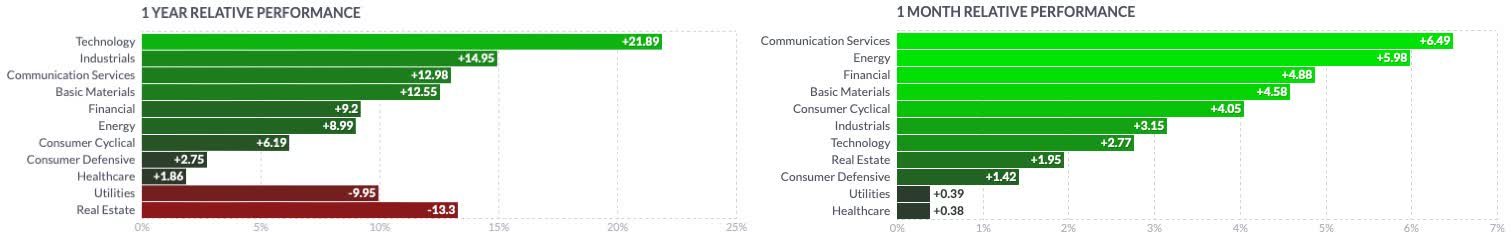
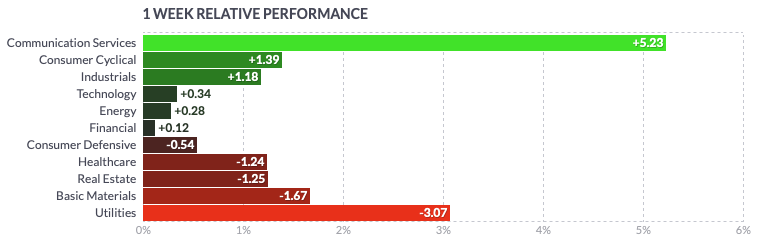
All sectors in the U.S. economy had a positive performance during the past month, with communications services, energy, and financials leading the rally, while on a yearly basis, companies in the technology sector marked the strongest recovery. When looking at the weekly performance, we can observe some weaknesses building up in some sectors, especially utilities companies, basic materials, and real estate enterprises seeming to give up some gains.
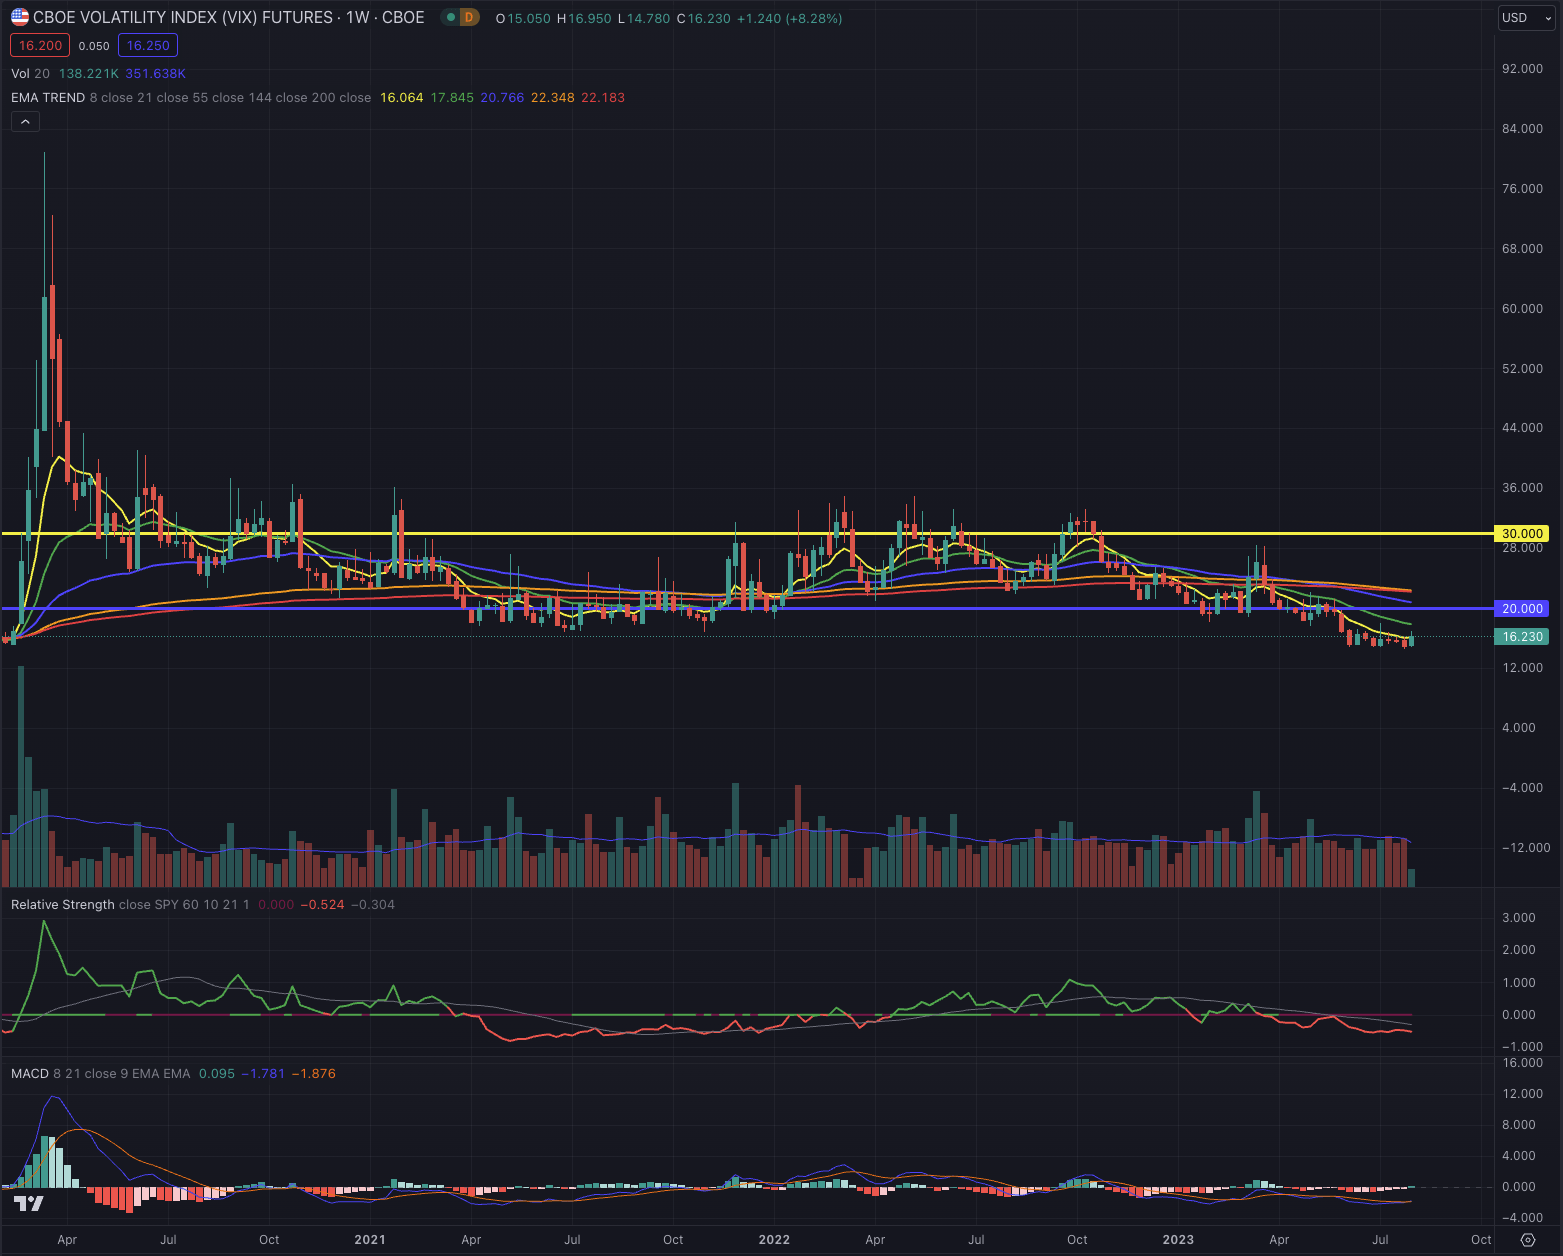
The CBOE Volatility Index ( VIX ) is moderate in bull markets and higher in bear markets, with spikes reported during periods of extreme uncertainty or unforeseen major events mostly perceived as negative catalysts for the stock market. The indicator has significantly dropped under the bottom of what I considered the relevant volatility range since the pandemic crash and is trailing its EMA21. VIX is entering the zone from where substantial spikes have been recorded in the past, price levels I would consider as warning signs for a possible overly enthusiastic sentiment in the equity market.
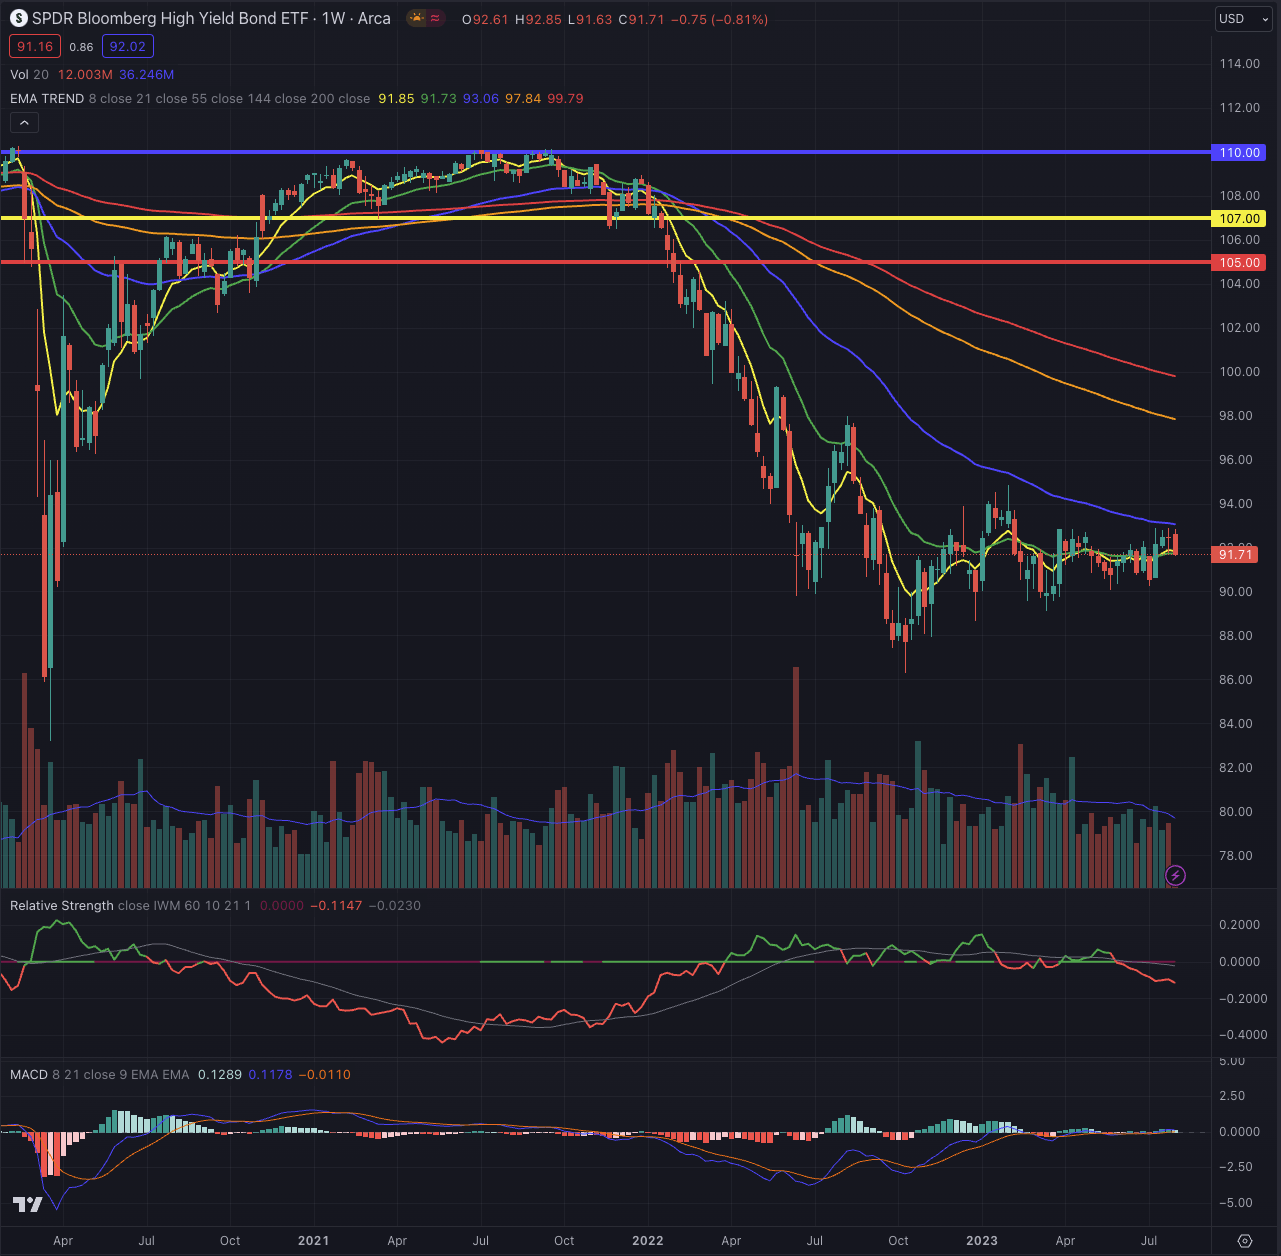
The SPDR Bloomberg Barclays High-Yield Bond ETF (JNK), which tracks highly liquid, high-yield, US dollar-denominated corporate bonds, hasn't moved significantly since my last article, hovering around the lows recorded since June 2022. Although breaking out from its EMA21, the index is trialing its EMA55 in its downtrend, hinting at the ongoing skepticism in the high-risk bond market, likely also negatively influenced by the sustained risk in the banking sector, and tighter financial conditions with substantially higher interest rates.
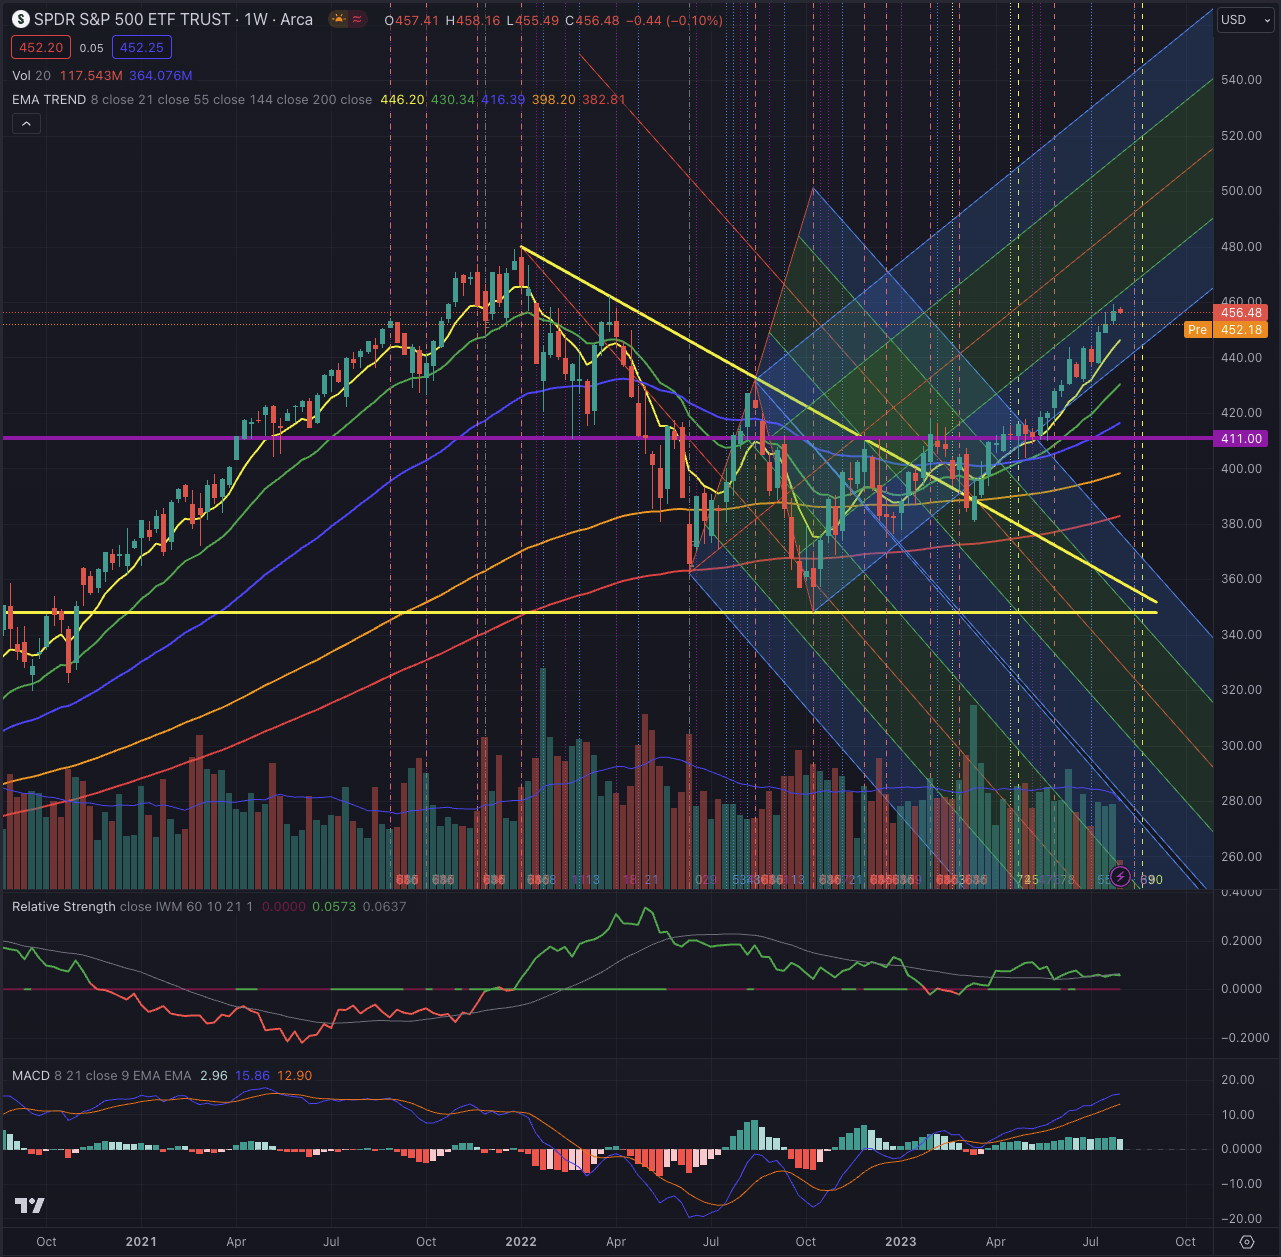
At the beginning of March, I suggested SPY was likely setting up for heading into wave 3 of a new upward impulse sequence, while it was still not clear if the index would break through its strong overhead resistance, therefore I also discussed an alternative more bearish scenario. SPY has since tested its support at the descending converging trend line, by slightly violating it and bottoming at $380.65 on March 13, most likely fueled by many stop-losses set around that price level. The benchmark recorded some shake-outs around the overhead resistance I identified around $411, before setting up a massive rally. Such behavior is commonly observed after breakouts and gives investors the chance to further scale into the asset or still jump on the train if they missed the first chance.
SPY is now trailing its EMA8, while following the ascending trending channel I discussed in my former article. The index could build up some relative strength when compared to the broader small-cap market tracked by the iShares Russell 2000 ETF ( IWM ), and investors who followed my trading idea could notice that SPY reached both my targets and even surged past my best expectation.
My first scenario is considering SPY forming a new upward impulse sequence, with the index likely forming wave 3 after defining wave 2 while bottoming at $392.33. This scenario would see SPY rising toward $420 in the least optimistic scenario, but most likely attempting to break out from this resistance and extend until $436.
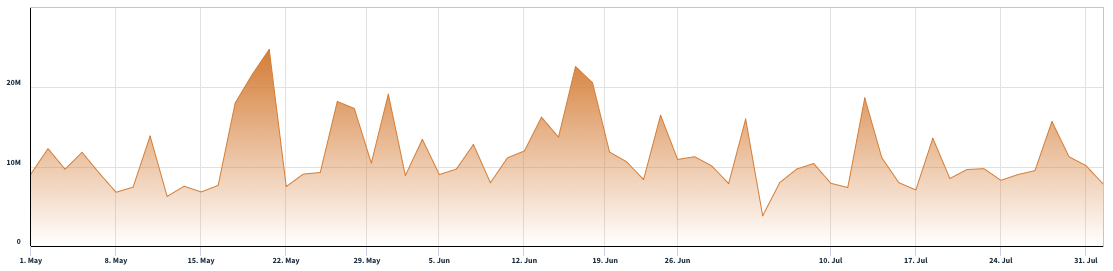
The short interest on the SPY has recorded some significant spikes in the past 3 months, leading to some temporary volatility, but overall continues hovering around the same levels over the past 6 months. The data is still on the higher side when compared to the two last years after the pandemic, and despite the massive rally, the recent spikes are hinting at higher bearish bets against the SPY and therefore the conviction of those actors seeing a possible retracement.
What is coming next?
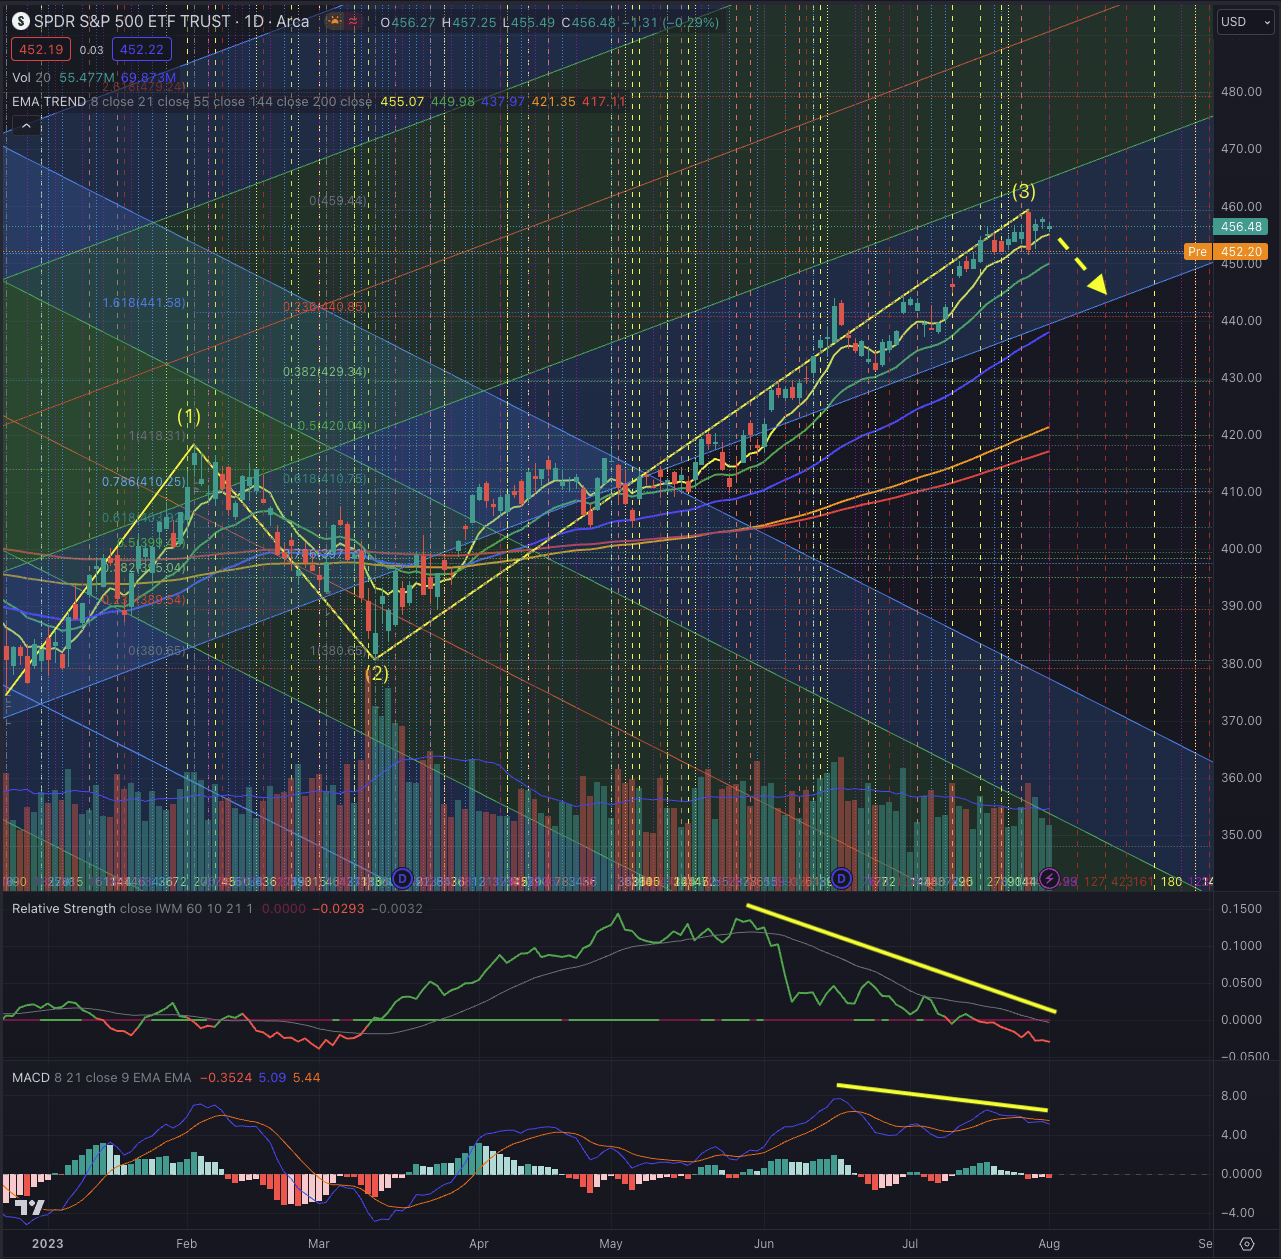
After such a massive reversal it's wise to assess if the positive momentum could continue or if a retracement is becoming more likely. SPY topped at $459.44, exceeding my (and probably many others) expectations, without major retracements, extending wave 3 about 1.8x the length of wave 1. The index looks a bit overstretched when observing its EMAs, and began to record relative weakness when compared to the IWM. Additionally, the MACD is building up a bearish divergence with SPY.
The observed situation favors a retracement, which I estimate to lead SPY to likely $448 as the first target, with successively a more likely target at $441. My third target would see SPY retracing to $429, but this scenario would mean that the index collapsed under the ascending trending channel, by breaking under its EMA55, while likely searching for support at the EMA144 or even lower at the EMA200.
What could be a tactic in this situation? Actual investors could focus on supports such as the trailing EMA21, the up-trending channel, or as a last resort, the EMA55. I would not hold on to SPY if it significantly breaks under both the ascending channel and the EMA55, as this would lead to a higher likelihood to see the index falling toward its EMA200, or even breaking into the territory of wave 1, which would then invalidate my assumption of an upward impulse sequence. More cautious investors could even sell some positions, book some profits, and secure the rest of their investment with a stop-loss positioned under the discussed price levels.
I would not recommend to investors to scale into SPY before it would confirm the formation of wave 4. Investors interested in participating in a continuation of the rally could observe SPY around the mentioned target prices and confirm their entry point when a reversal would be confirmed in the MACD and preferably some significant relative strength would build up. It's important to consider that a support level might be tested more than once, and investors should not race into a position before the overall picture confirms a reversal.
What about shorting the index? Certainly, this could be an option for traders familiar with this technique. At this point, it's still too early to aggressively bet against a continuation of the rally, and I would wait for a better short entry point, which I would identify once the price breaks under a major support level and is confirmed with significant sell-side volume. Please familiarize yourself with the risks before shorting.
The bottom line
Technical analysis is not an absolute instrument, but a way to increase investors' success probabilities and a tool allowing them to be oriented in whatever security is listed on the markets. One would not drive towards an unknown destination without consulting a map or using a GPS. I believe the same should be true when making investment decisions. I consider techniques based on the Elliott Wave Theory, as well as likely outcomes based on Fibonacci's principles, by confirming the likelihood of an outcome contingent on time-based probabilities. The purpose of my technical analysis is to confirm or reject an entry point in the stock, by observing its sector and industry, and most of all its price action. I then analyze the situation of that stock and calculate likely outcomes based on the mentioned theories.
My approach in this article is strictly pondering indicators I consider the most important when assessing the situation of the major indexes in the U.S. financial markets, as this is not a macroeconomic analysis, and instead focusing on the SPY, it is consciously ignoring other economic indicators that may be relevant under another perspective.
SPY followed the assumption I suggested a few months ago, while the extension of the rally beat even my best expectations. I consider my assumption of a new impulse wave sequence being intact and expect the index to retrace into wave 4. Although this retracement could be limited, I would avoid holding on to my positions under the discussed price levels and would book some profits while securing the rest of my investment. Overall, I consider the rally of SPY likely reaching a point of exhaustion. I also confirmed this assumption when considering the other discussed indicators, leading me to rate SPDR® S&P 500 ETF Trust as a sell position.
For further details see:
SPY: It's Time To Book Some Profits (Technical Analysis, Rating Downgrade)