SPYD - SPYD: 5.23% Expected Dividend Yield Comes With Huge Risks
2023-10-17 14:30:02 ET
Summary
- SPYD offers a high 5.23% expected dividend yield, but its constituents have negative estimated earnings per share growth, suggesting potential share price depreciation.
- Investors may prefer SPYD's simplistic approach of selecting the 80 highest-paying S&P 500 stocks, but it's a crucial flaw. Without any quality screens, the ETF is vulnerable in drawdowns.
- This article presents three other high-dividend, higher-quality ETFs to consider. Each have better track records than SPYD over the short- and long-term, and offer some potential for capital appreciation.
Investment Thesis
Based on current prices, I expect the SPDR Portfolio S&P 500 High Dividend ETF ( SPYD ) to yield 5.23%, an attractive proposition that puts it among the highest-paying pure equity options available to U.S. investors. However, I urge readers not to take the bait. As I will highlight in this article, SPYD's constituents have negative estimated earnings per share growth, a feature that doesn't support strong dividend growth at best and suggests substantial share price depreciation at worst. Instead, I advise dividend investors to aim for high-quality funds, and I'll highlight three in the article below worth considering.
SPYD Overview
SPYD tracks the S&P 500 High Dividend Index, selecting the 80 highest-yielding dividend securities in the S&P 500 Index in equal weight. Reconstitutions are semi-annual on the last business day of January and July, and today, the ETF overweights Electric Utilities (12.67%), Regional Banks (11.97%), and Retail REITs (6.00%). The presence of REITs indicates not all dividend income is considered qualified for income tax purposes. To illustrate, State Street's Primary Tax Summary for 2022 highlighted how SPYD's total dividends were $1.9833 per share for the year, with $1.4499 (73.10%) designated as qualified.
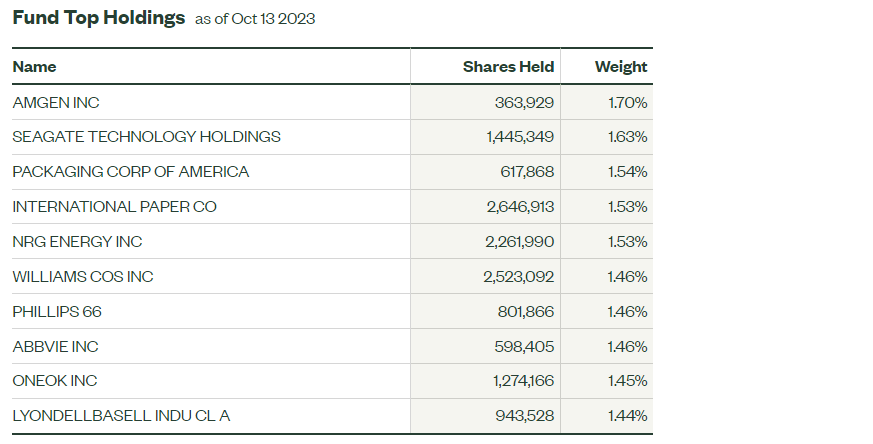
SPYD's top ten holdings are listed below, totaling 15.20% of the portfolio. As mentioned, it is equal weight, but notice how several are smaller companies like Seagate Technology Holdings ( STX ), Packaging Corporation of America ( PKG ), and International Paper ( IP ), with market capitalizations between $12-$14 billion. This feature is unsurprising, given how dividend yield and valuation are inversely correlated. However, I want to point out that SPYD tends to select from the bottom end of S&P 500 stocks. Its weighted average market capitalization is $44.86 billion compared to $668.87 for the SPDR S&P 500 ETF ( SPY ).
State Street
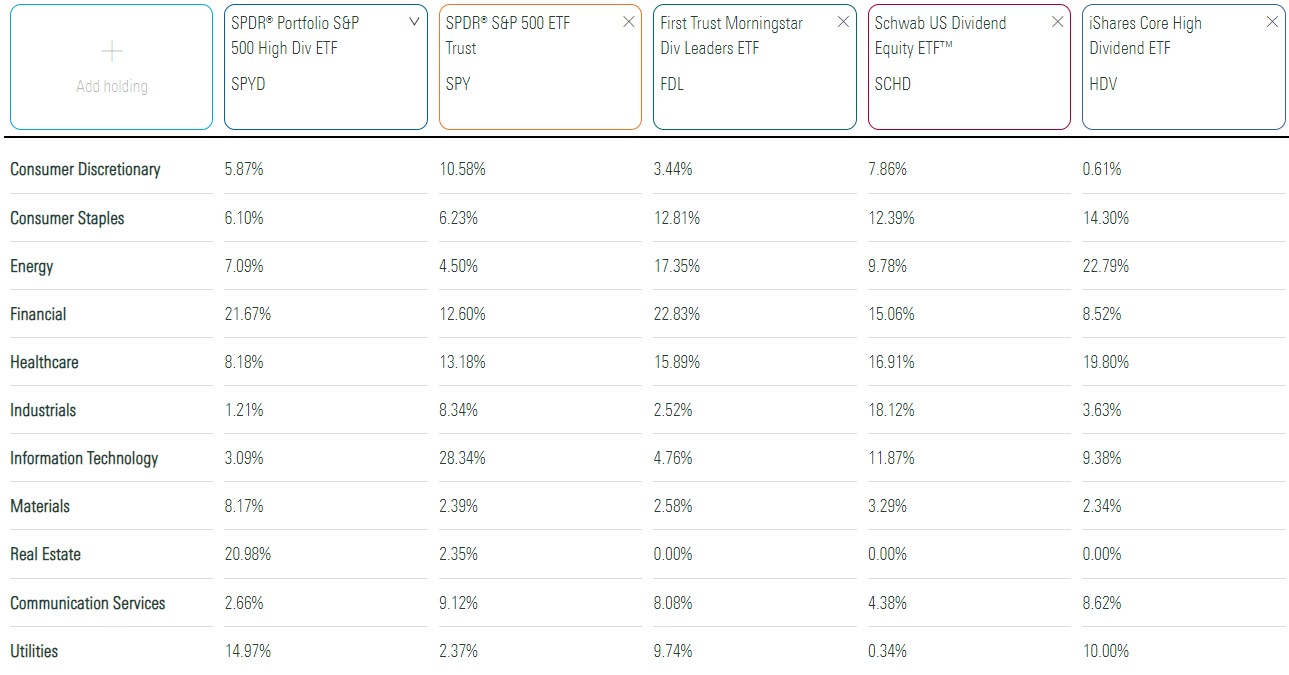
SPYD's sector exposures are below, alongside SPY, the First Trust Morningstar Dividend Leaders ETF ( FDL ), the Schwab U.S. Dividend Equity ETF ( SCHD ), and the iShares Core High Dividend ETF ( HDV ). Along with FDL, SCHD and HDV also have reasonably high dividend yields. However, their trailing yields are lower (3.72% and 4.17%) and might be insufficient for income investors.
Morningstar
SPYD's largest sector exposure area is Financials (21.67%), followed by Real Estate (20.98%) and Utilities (14.97%). FDL also overweights Financials but eliminates the qualified dividend income issue with zero allocation to Real Estate securities and adds some additional Energy (17.35%) and Health Care (15.89%) exposure. It's the superior choice over SPYD, in my opinion.
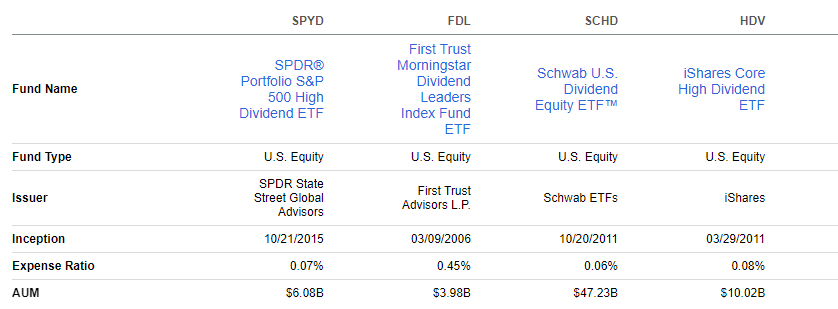
Finally, consider Seeking Alpha's ETF comparison of the four funds below. SCHD is the largest, with $47.23 billion in assets under management. It's also the cheapest, with a 0.06% expense ratio, so it's a challenging fund to compete with if its dividend yield is satisfactory. SPYD also competes well on fees at 0.07%, and its lower $6.08 billion in assets under management could easily result from its later October 2015 launch date. In contrast, FDL sticks out for the wrong reasons. It's the least popular and the most expensive, but as we'll see next, it's outperformed SPYD despite its higher fees.
Seeking Alpha
SPYD Performance
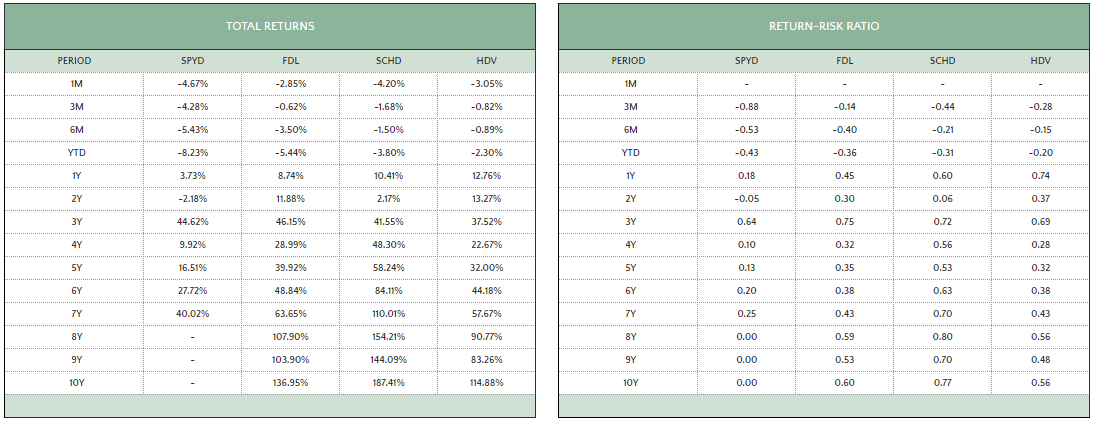
The following two tables highlight SPYD's total returns and total risk-adjusted returns over the short- and long-term. The risk-adjusted returns provided are simply each ETF's annualized returns divided by the annualized standard deviation of monthly returns. This calculation is essentially the Sharpe Ratio without accounting for the risk-free rate.
The Sunday Investor
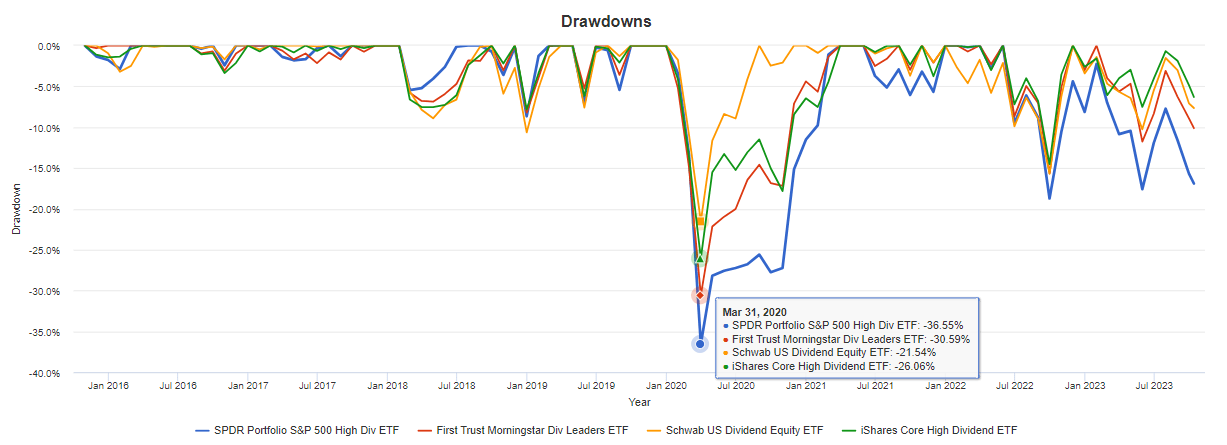
As shown, SPYD's results through September 2023 are the worst for all periods measured from three months to seven years. Evidently, the strategy has yet to work. A drawdowns chart from Portfolio Visualizer, the data source for the above table, includes information suggesting SPYD does not necessarily perform well in market downturns, either. It declined by 36.55% in Q1 2020 and typically underperformed the other three dividend-paying ETFs in more minor drawdowns.
Portfolio Visualizer
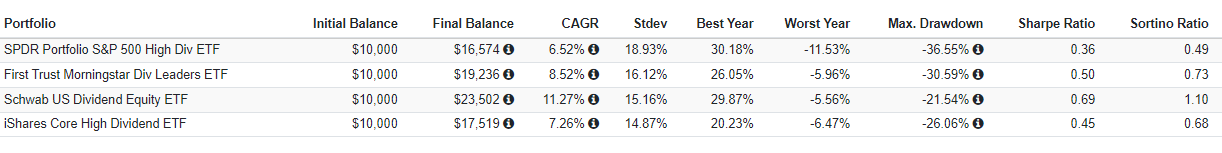
Since its inception, SPYD's 6.52% annualized gain was 2.00% worse than FDL. Its downside risk-adjusted returns (Sortino Ratio) were substantially worse (0.49 vs. 0.73), a red flag for the conservative investor type high-yield funds typically attract.
Portfolio Visualizer
An apparent reason for these poor results is that SPYD's selection process is too basic. By selecting 80 S&P 500 stocks based on dividend yield alone, quality issues are bound to arise. These issues can outweigh the benefits of receiving a high income, and something other ETFs like FDL, SCHD, and HDV don't face. FDL's screens include dividend growth and dividend payout ratios. SCHD screens for four fundamental ratios after it excludes the bottom 50% of dividend-paying securities. Even HDV, which uses Morningstar's propriety Wide Moat and Distance To Default Ratings, typically holds 75 high-quality stocks. You might not always like the exposures, but its worst drawdown was 10% better than SPYD's and has also shown better dividend growth potential.
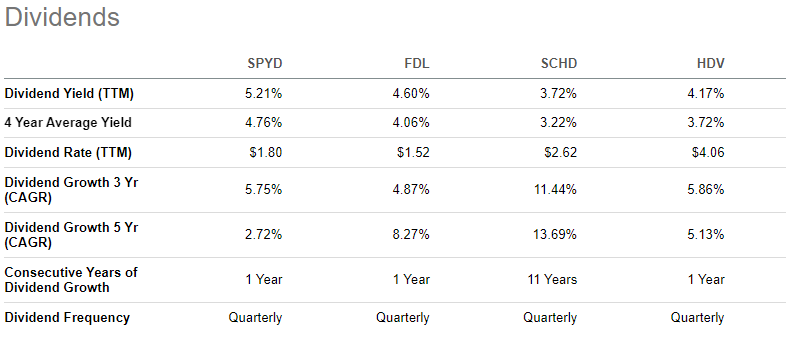
Finally, the table below highlights SPYD's 2.72% five-year dividend growth rate compared to 8.27%, 13.69%, and 5.13% for FDL, SCHD, and HDV. Depending on your time horizon, it won't take long for the other three fund's yield on cost to catch up to SPYD.
Seeking Alpha
Besides, as I mentioned in my investment thesis, SPYD and FDL have very similar expected yields (5.23% vs. 4.93%), so I suggest focusing more on other fundamental factors, including quality, rather than fees.
SPYD Fundamentals
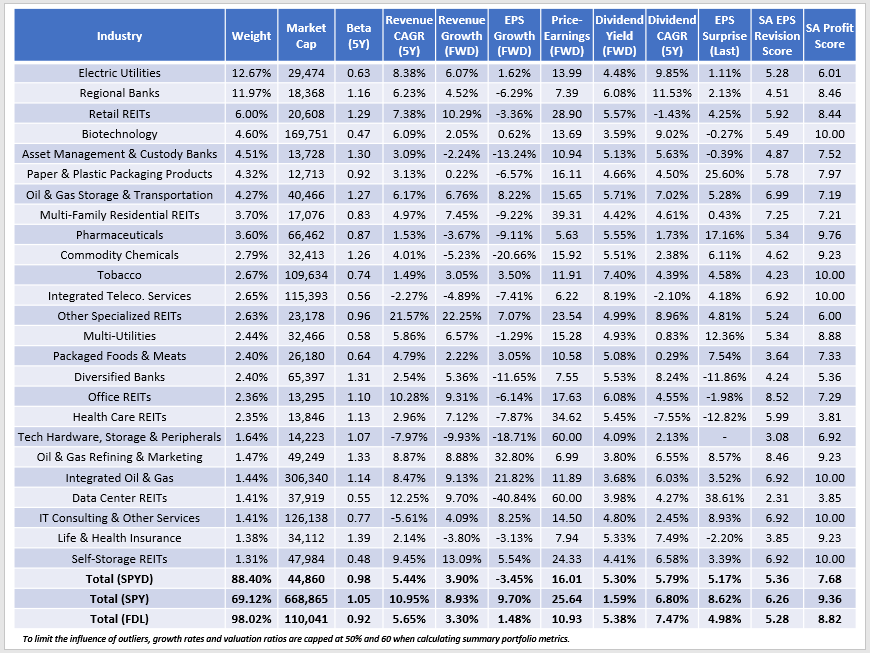
The following table highlights selected fundamental metrics for SPYD's top 25 sub-industries, totaling 88.40% of the portfolio. I chose to analyze SPYD by industry because, due to its equal-weighting scheme, its top 25 holdings would reveal little. Furthermore, an evaluation by sub-industry is a better measure of diversification. Stocks in different sub-industries are less likely to be correlated, indicating potential risk reduction benefits for shareholders.
The Sunday Investor
I want to make a few observations:
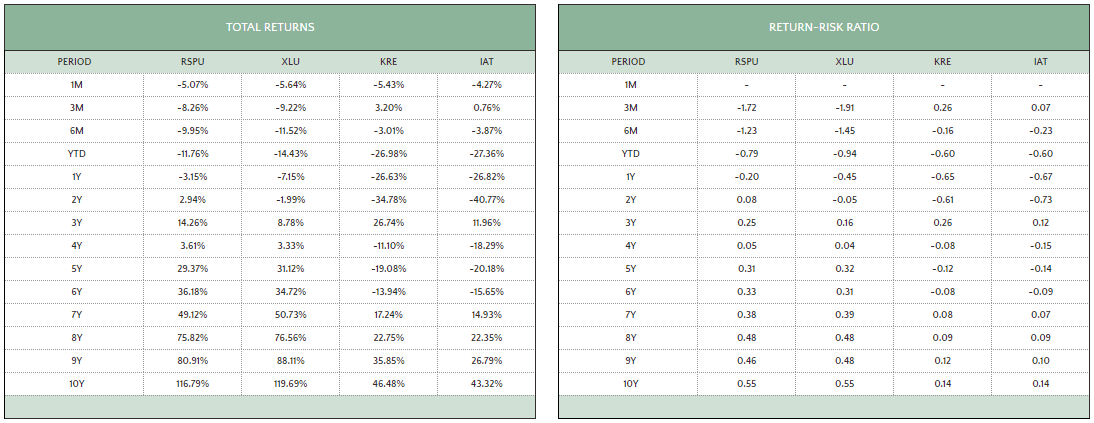
1. As mentioned earlier, Electric Utilities (12.67%) and Regional Banks (11.97%) are key exposure areas. From a diversification perspective, this is excellent. According to Portfolio Visualizer, the Invesco S&P 500 Equal Weight Utilities ETF ( RSPU ) and the SPDR S&P Regional Banking ETF ( KRE ), another equal-weight fund, have a low 0.22 correlation of returns. Also, these are two sub-industries where a market-cap-weighting scheme wasn't always favorable. As shown in the tables below, RSPU and the Utilities Select Sector SPDR Fund ( XLU ) have similar short- and long-term returns through September 2023. Similarly, KRE and the market-cap-weighted iShares U.S. Regional Banks ETF ( IAT ) have traded places several times over the last decade.
The Sunday Investor
FDL has a similar makeup, with 9.01% and 11.42% exposure to these two sub-industries. It also adds 11.72% to the Tobacco sub-industry, consisting of Philip Morris International ( PM ) and Altria Group ( MO ). Investing in tobacco stocks may be a deal-breaker for you, but it's often unavoidable for high-dividend ETFs as they yield 5.64% and 9.19%, respectively. SPYD holds them, too, just at lower weightings.
2. SPYD's constituents yield 5.30% at current prices, so shareholders should net approximately 5.23% after fees. By comparison, FDL's constituents are higher-yielding at 5.38%, but the ETF's 0.45% expense ratio means shareholders will net only 4.93%. Still, FDL's current components hold a 1.68% five-year dividend growth advantage (7.47% vs. 5.79%), so at a minimum, they've demonstrated more willingness to increase dividends.
3. Most concerning is SPYD's -3.45% estimated earnings per share growth rate vs. 1.48% for FDL, suggesting the ETF is in no position to increase dividends responsibly. In addition, SPYD's payout ratio is 60.99% compared to 55.22% for FDL, so there's little leeway. Investors should treat SPYD as an income play only, as the risk for further downside is evident. With U.S. one-month treasuries yielding 5.60%, making a case for SPYD is only possible if you're a contrarian investor. I remind readers that the strategy has not worked since its launch, so it doesn't make much sense to assume SPYD will turn things around now. A more compelling fundamental picture is necessary.
4. SPYD trades at 16.01x forward earnings, a sizable discount compared to 25.64x for SPY. Excluding REITs, where traditional valuation metrics aren't as useful, SPYD trades at 12.36x forward earnings, or slightly above FDL's 10.93x. On balance, SPYD appears close to a deep-value fund, as evidenced by these weighted average metrics compared to SPY:
- Price Return (1Y): -5.82% vs. 30.68%
- Price Return (3Y): 7.71% vs. 50.93%
- Total Return (5Y): -4.92% vs. 141.42%
Essentially, SPYD holds stocks that haven't produced any gains over the last five years. Again, that's true for several high-dividend funds, but the degree is significant. As a comparison, FDL, SCHD, and HDV's current holdings delivered 26.76%, 58.52%, and 47.08% total returns over the last five years. They're value funds, but there's some potential for capital appreciation. That doesn't appear to be the case with SPYD.
5. Finally, SPYD's 7.68/10 profit score is much lower than its peers. Among large-cap dividend ETFs, only the Global X Super Dividend U.S. ETF ( DIV ) is worse at 6.92/10. DIV selects only 50 stocks from a universe of 1,500 and is full of yield traps. This may be why its return and risk characteristics are even worse than SPYD's over the last eight years.
Portfolio Visualizer
Investment Recommendation
Based on current prices, I expect SPYD to yield 5.23%, but those high dividend payments come with huge risks. SPYD's constituents have not produced a positive return over the last five years and are forecasted to deliver negative earnings per share growth. Along with a profit score that's second-worst in the large-cap dividend category, there's no reason to believe a turnaround is imminent. FDL is fundamentally on better footing, and if you have a longer time horizon, SCHD and HDV are also better choices. Thank you for reading, and I look forward to the discussion in the comments below.
For further details see:
SPYD: 5.23% Expected Dividend Yield Comes With Huge Risks