XYLD - SPYI: Lessons From XYLD
2023-10-20 18:36:11 ET
Summary
- The Neos S&P 500(R) High Income ETF is a new fund recently launched in August 2022.
- The fund caters to income-seeking investors and uses an option overlay to generate monthly income.
- Given its short history, we can feel unsure about its current valuation and its future return outlook.
- To gain more insights, I will compare SPYI to a fund that uses a similar strategy but with a longer history: the Global X S&P 500® Covered Call ETF.
- This comparison will show that their current dividend yields are not as attractive as on the surface and their total return potentials are limited.
SPYI: What can we learn from XYLD?
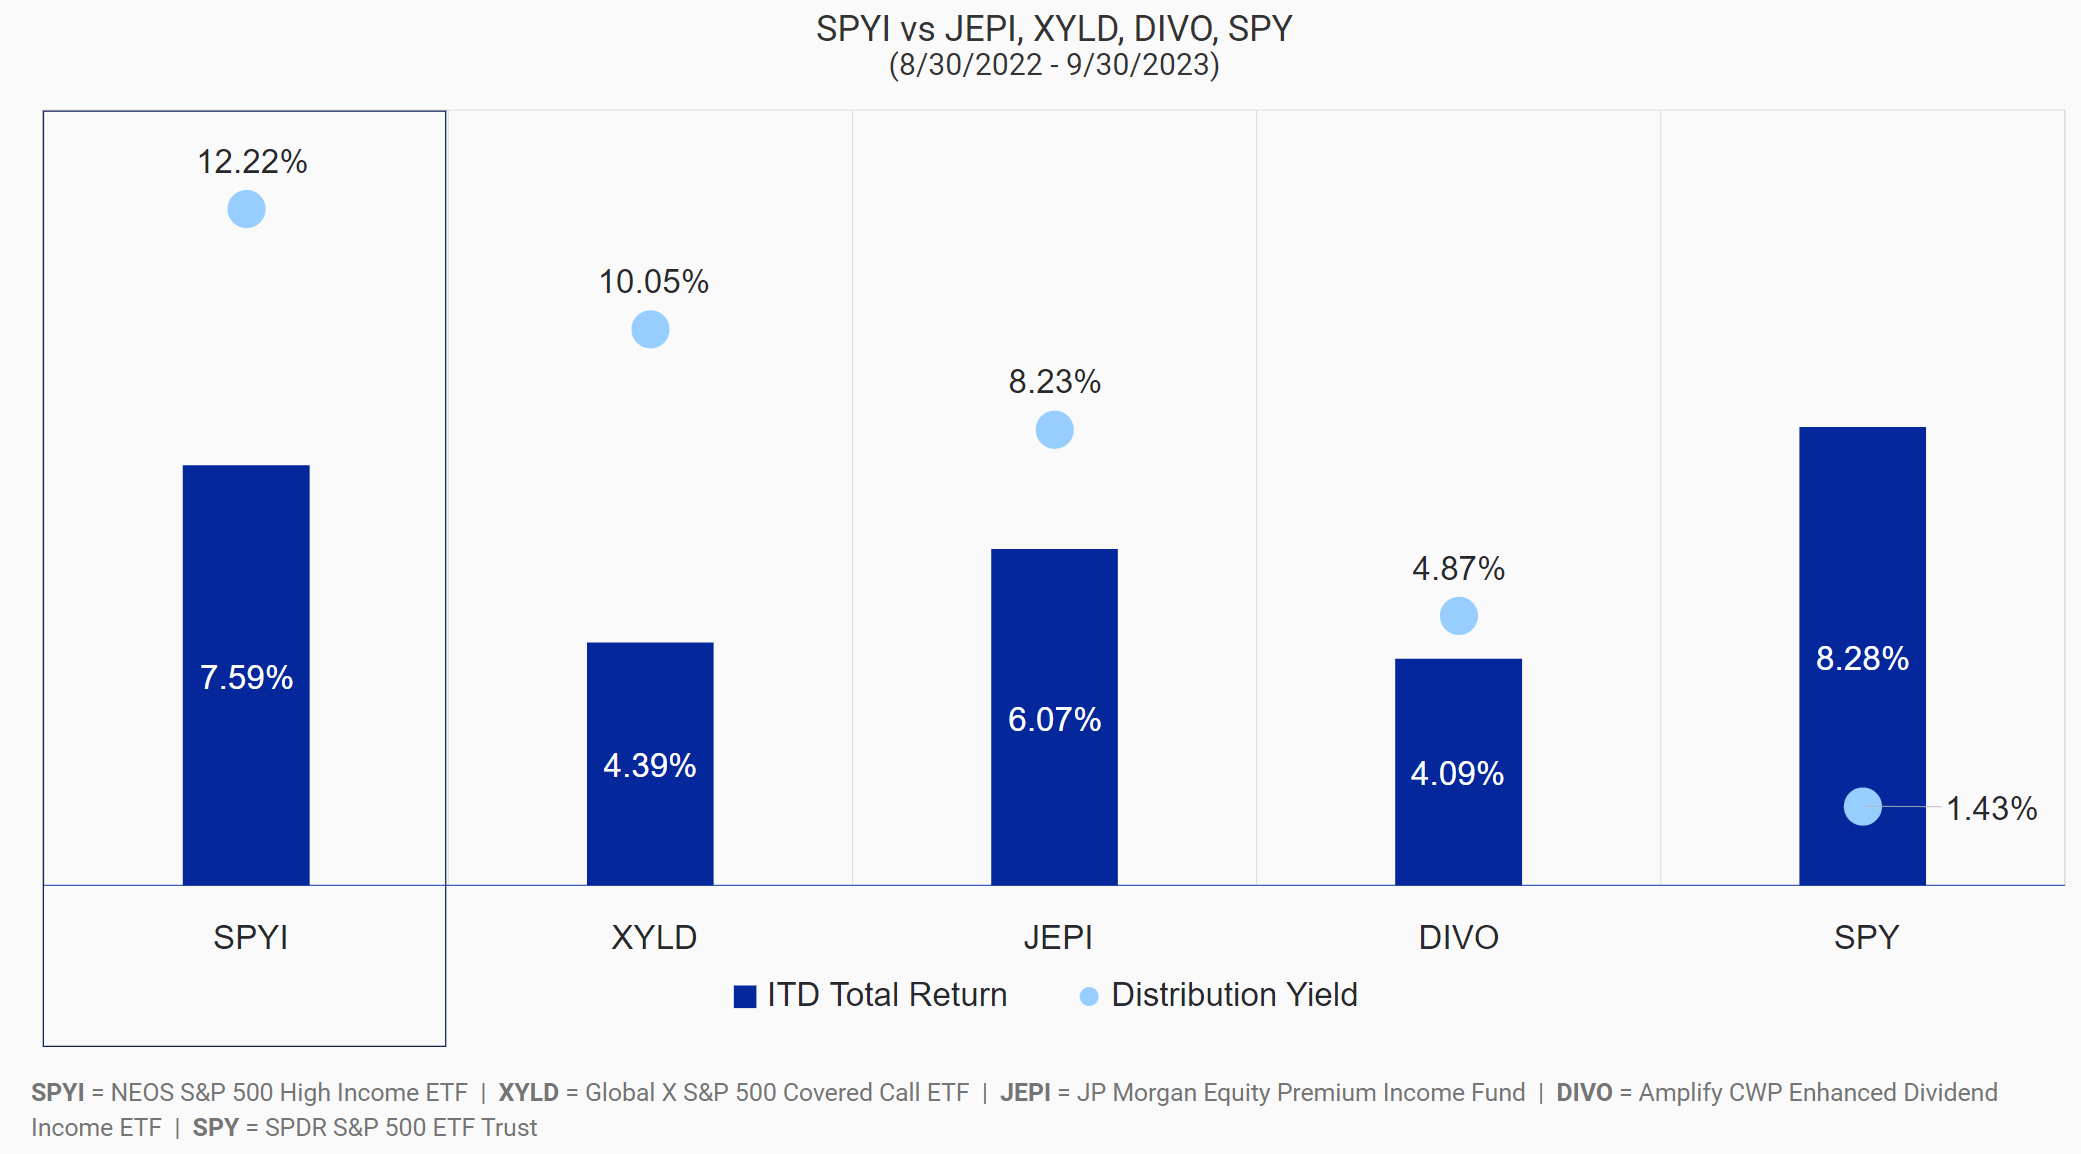
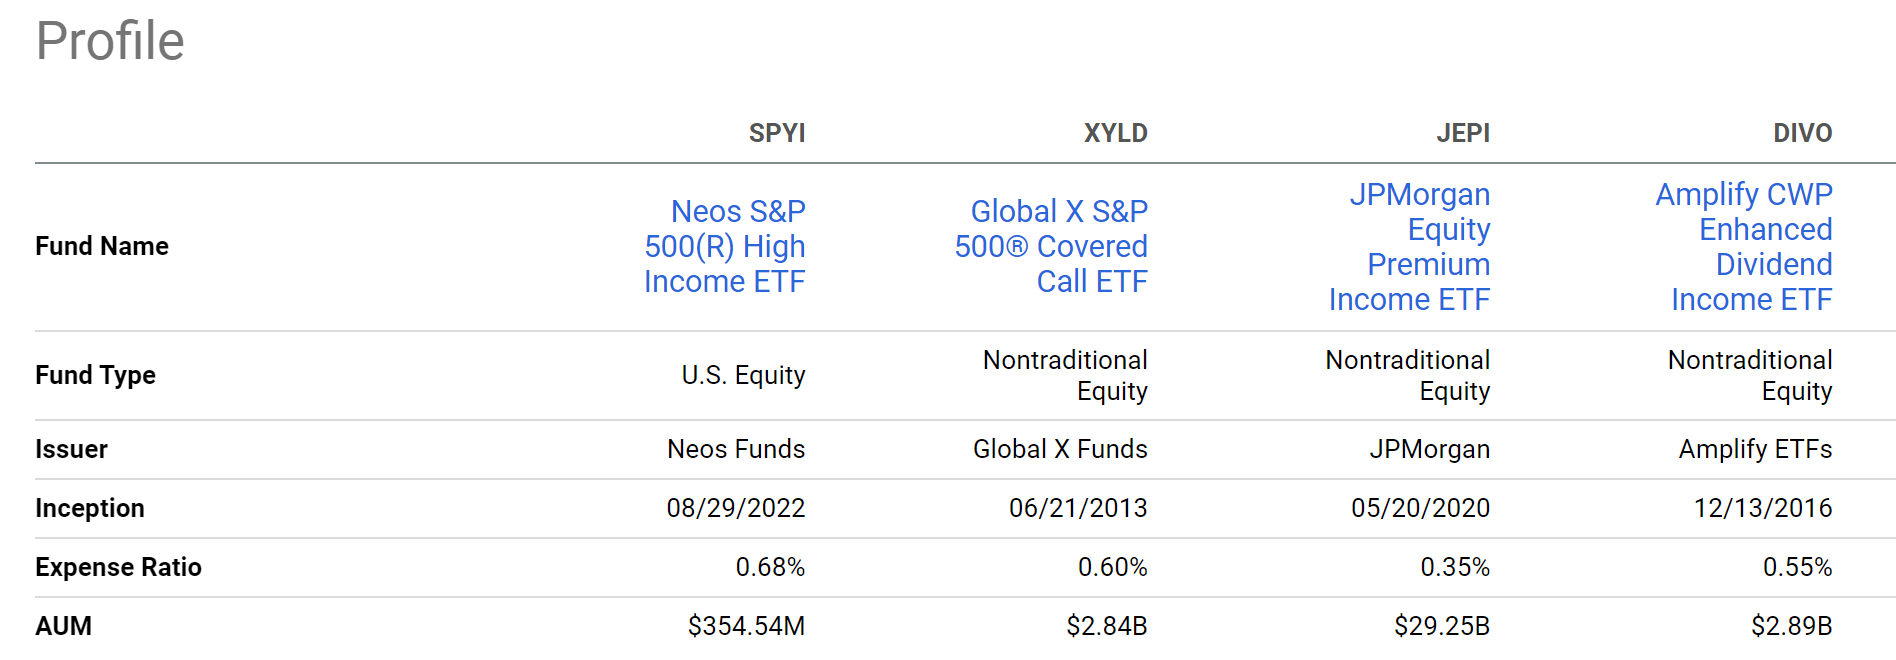
The Neos S&P 500((R)) High Income ETF ( SPYI ) is a recent addition to the exchange-traded fund ("ETF") family that uses option overlay on the S&P 500 Index (SP500). Many income-oriented investors must know that there are a few other funds in this family already. As shown in the chart below, some notable examples include the Global X S&P 500 Covered Call ETF (XYLD), the JPMorgan Equity Premium Income Fund (JEPI), and the Amplify CWP Enhanced Dividend Income ETF (DIVO). In the short period since its inception, the fund has outperformed all these above peers as shown in the chart. To wit, in this period, SPYI's total return was 7.59%, while all the other peers returned somewhere between 4% to 6%.
It's also important to note that during this period, SPYI has provided a monthly dividend yield on average of 12.2%. The fund is currently also yielding around 12.2%. It is certainly a strong draw to investors seeking a steady stream of current income.
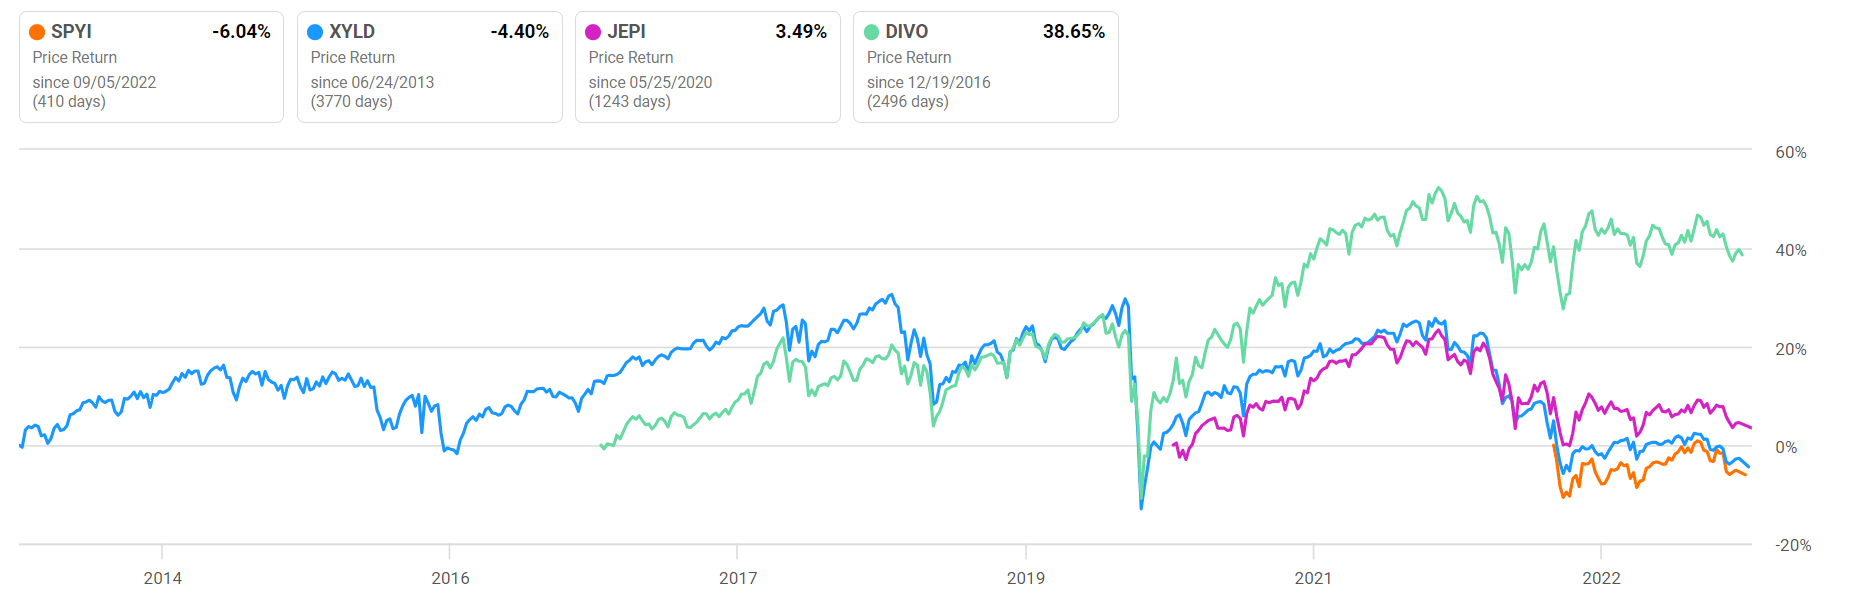
However, given its short history, we can feel uncertain about its current valuation and its future return outlook. As seen in the next chart below, when we expand the horizon a bit wider, the performance comparison becomes more mixed.
To gain more insights, this article will compare SPYI to XYLD, the fund with the longest history in this group. Based on the results of my comparison, you will see why its ~12% dividend yield is not as attractive as on the surface (and neither is XYLD’s yield). Furthermore, judging from XLYD's total return in the long-term, I do not see favorable total return potentials either when compared to their underlying S&P 500 index.
XYLD and SPYI: Basic information
Given the brief history of SPYI, I will start with a quick introduction to the fund. In particular, I will use XYLD as a background to highlight some of its key features. From the fund’s fact sheet ,
SPYI aims to generate high monthly income by investing in the constituents of the S&P 500 Index and implementing a data-driven call option strategy. The income generated by SPYI may provide outperformance in mildly bullish or bearish environments.
If you compare the above strategy to that of XYLD (quote from its fund description ), the similarities are quite apparent.
The Global X S&P 500 Covered Call ETF ((XYLD)) follows a “covered call” or “buy-write” strategy, in which the Fund buys the stocks in the S&P 500 Index and “writes” or “sells” corresponding call options on the same index. The strategy has historically produced higher yields in periods of volatility.
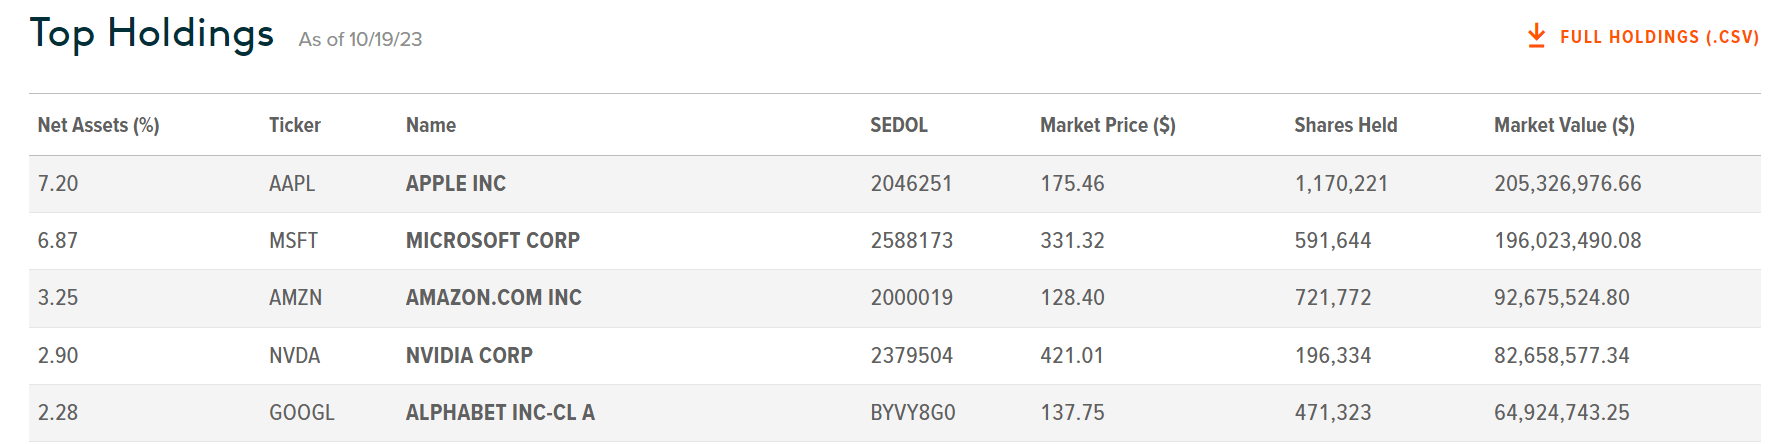
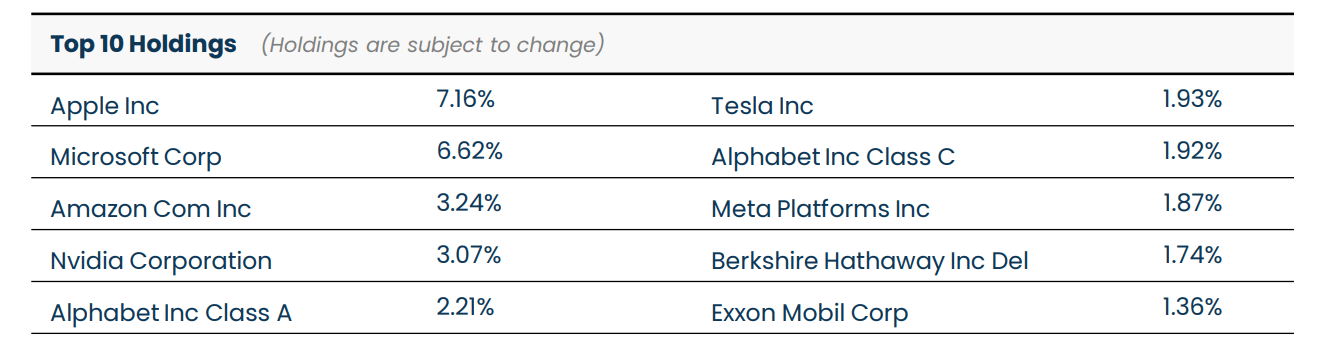
The essence of their strategy is to hold the stocks in the S&P 500 index and use the holdings to write options. As you can see from the next two charts, they hold the same stocks with about the same weights (which are both close to the weights in the S&P 500 index). The option premium then provides the monthly income that is paid out as dividends.
Finally, note that SPYI, as the newest entrant, has the smallest assets under management ("AUM"). Its current AUM is about $354M, compared to an AUM of more than $2.8B from XYLD. Also, note that SPYI also charges the highest fee (0.68%) among this group.
Next, I will elaborate on the implications of this underlying strategy on income generation and total return potential.
Dividend yield assessment
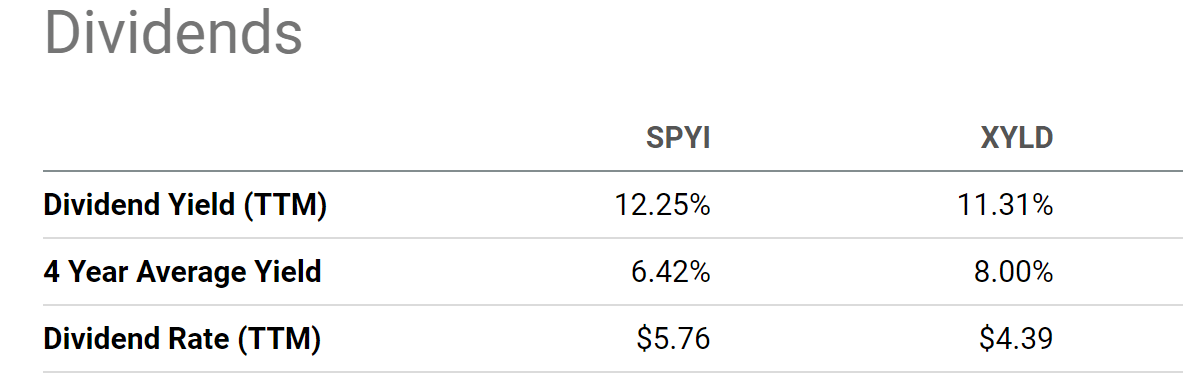
I will start with income generation by providing a broader context for their current yields. Again, SPYI’s historical data is too limited to provide a proper context. As such, I will rely on the data from XYLD as shown in the next chart. As seen, XYLD currently provides an 11.3% dividend yield, and the yield is indeed much higher than its 4-year average of 8.0%. The difference is about 3.3% in absolute terms and about 41% in relative terms. If I extrapolate XYLD’s data to SPYI, I expect SPYI’s current yield would also be above average by a similar amount (although not by that much, as shown in the table below).
However, benchmarking their current yield against their historical averages (the so-called vertical benchmarking) paints at best a partial picture. The picture won’t be complete without also benchmarking their yields against risk-free interest rates. With currently elevated risk-free rates, their current yields are a lot less than on the surface. Moreover, if such rates persist (which is very likely in my view), I think their future income potential be pressured as well.
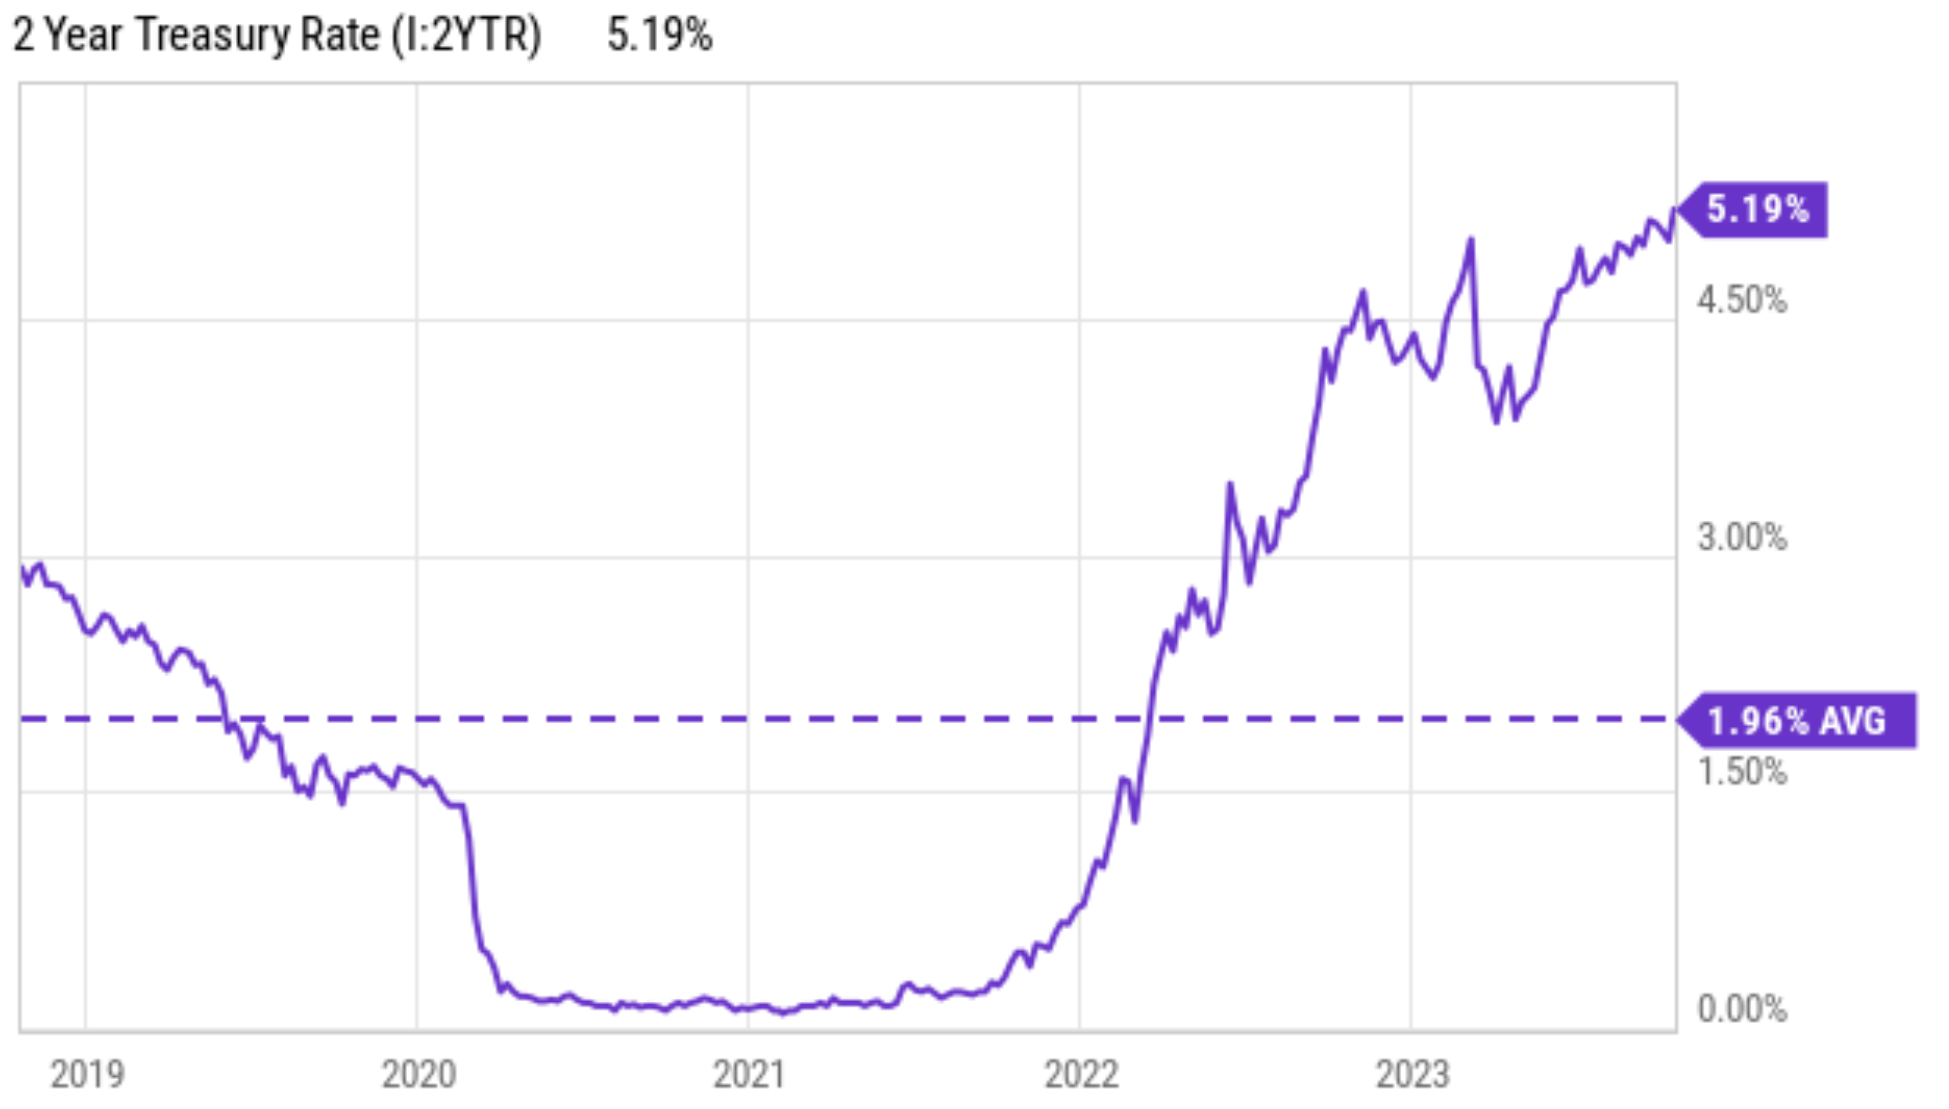
As just mentioned, XYLD generated an average of 8% yield in the past 4 years. During this period of time, the risk-free rates (taken as the 2-year treasury rates as shown in the chart below) averaged 1.96%. Thus, XYLD’s average yield is about 6.04% above the risk-free rates (8% minus 1.96%). Now, XYLD’s current yield of 11.3%, although a lot higher than its historical average, is still about the same ~6% above the risk-free interest rates.
To be exact, it is about 6.11% above 2-year treasury rates (11.31% minus 5.19%). Hence, when benchmarked against risk-free interest rates, the yield spread is only on average and does not provide any discounts on risk premiums. Again, I believe this analysis on XYLD can be extrapolated to SPYI as well given the similarity in their underlying holdings and strategies.
Looking ahead, there are also a few possible ways that an elevated interest rate could pressure the income generation from options strategies. These discussions have been detailed in my earlier articles, and I will only briefly recap the key points for ease of reference. High-interest rates can impact call options and put options differently. Therefore, the exact impact of these funds will depend on their specific use of call and put options and also which pricing model you use. However, in general, options are based on the expected future value of the underlying asset, and high-interest rates tend to make future cash flows more heavily discounted and thus less valuable.
Historical performance and outlook
Hopefully, by this point, I’ve convinced you of the similarities between XYLD and SPYI’s underlying strategies and sensitivity to common macroeconomic forces such as risk-free interest rates. If so, then we can take a further step here. I will examine XYLD’s past performance and use that as a basis to form an outlook for both XYLD and SPYI.
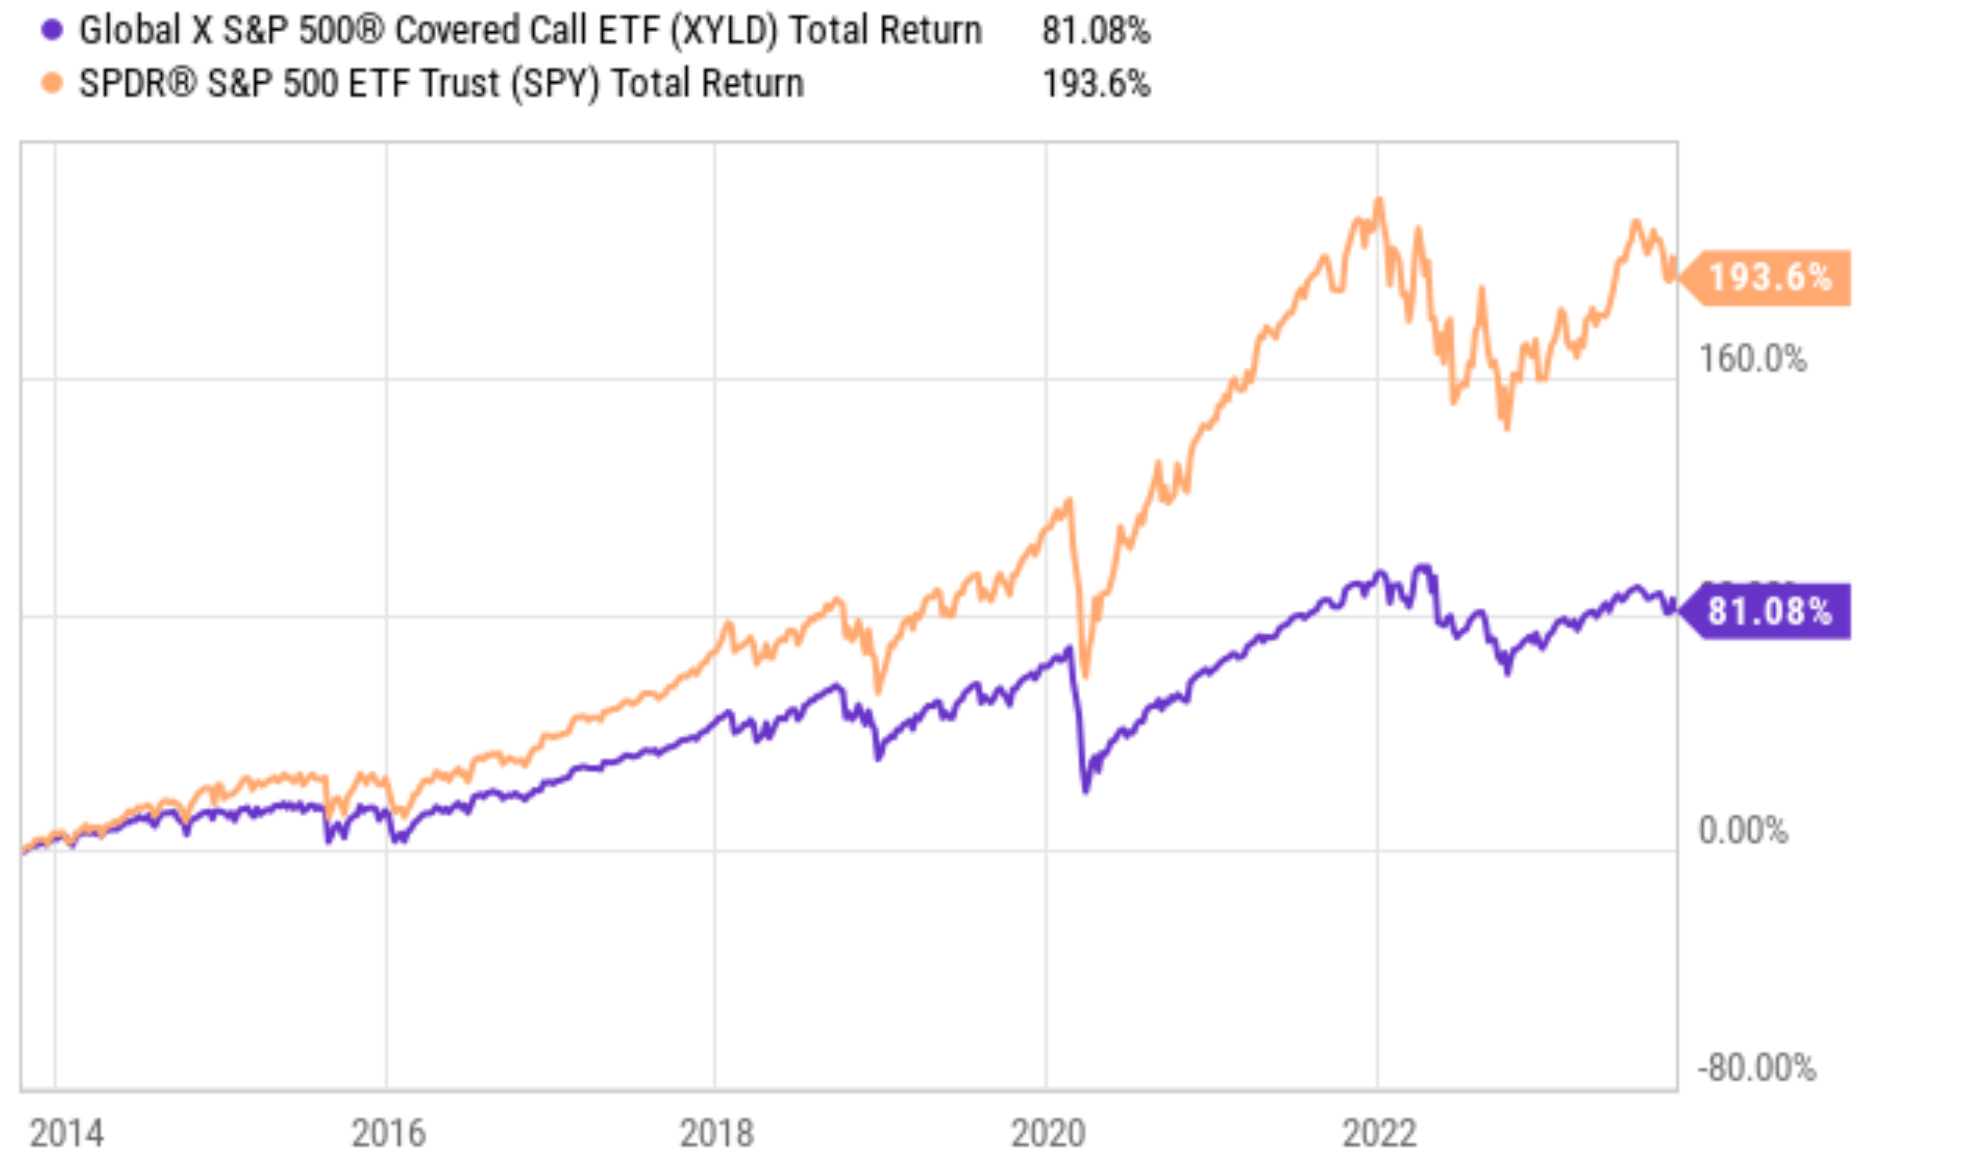
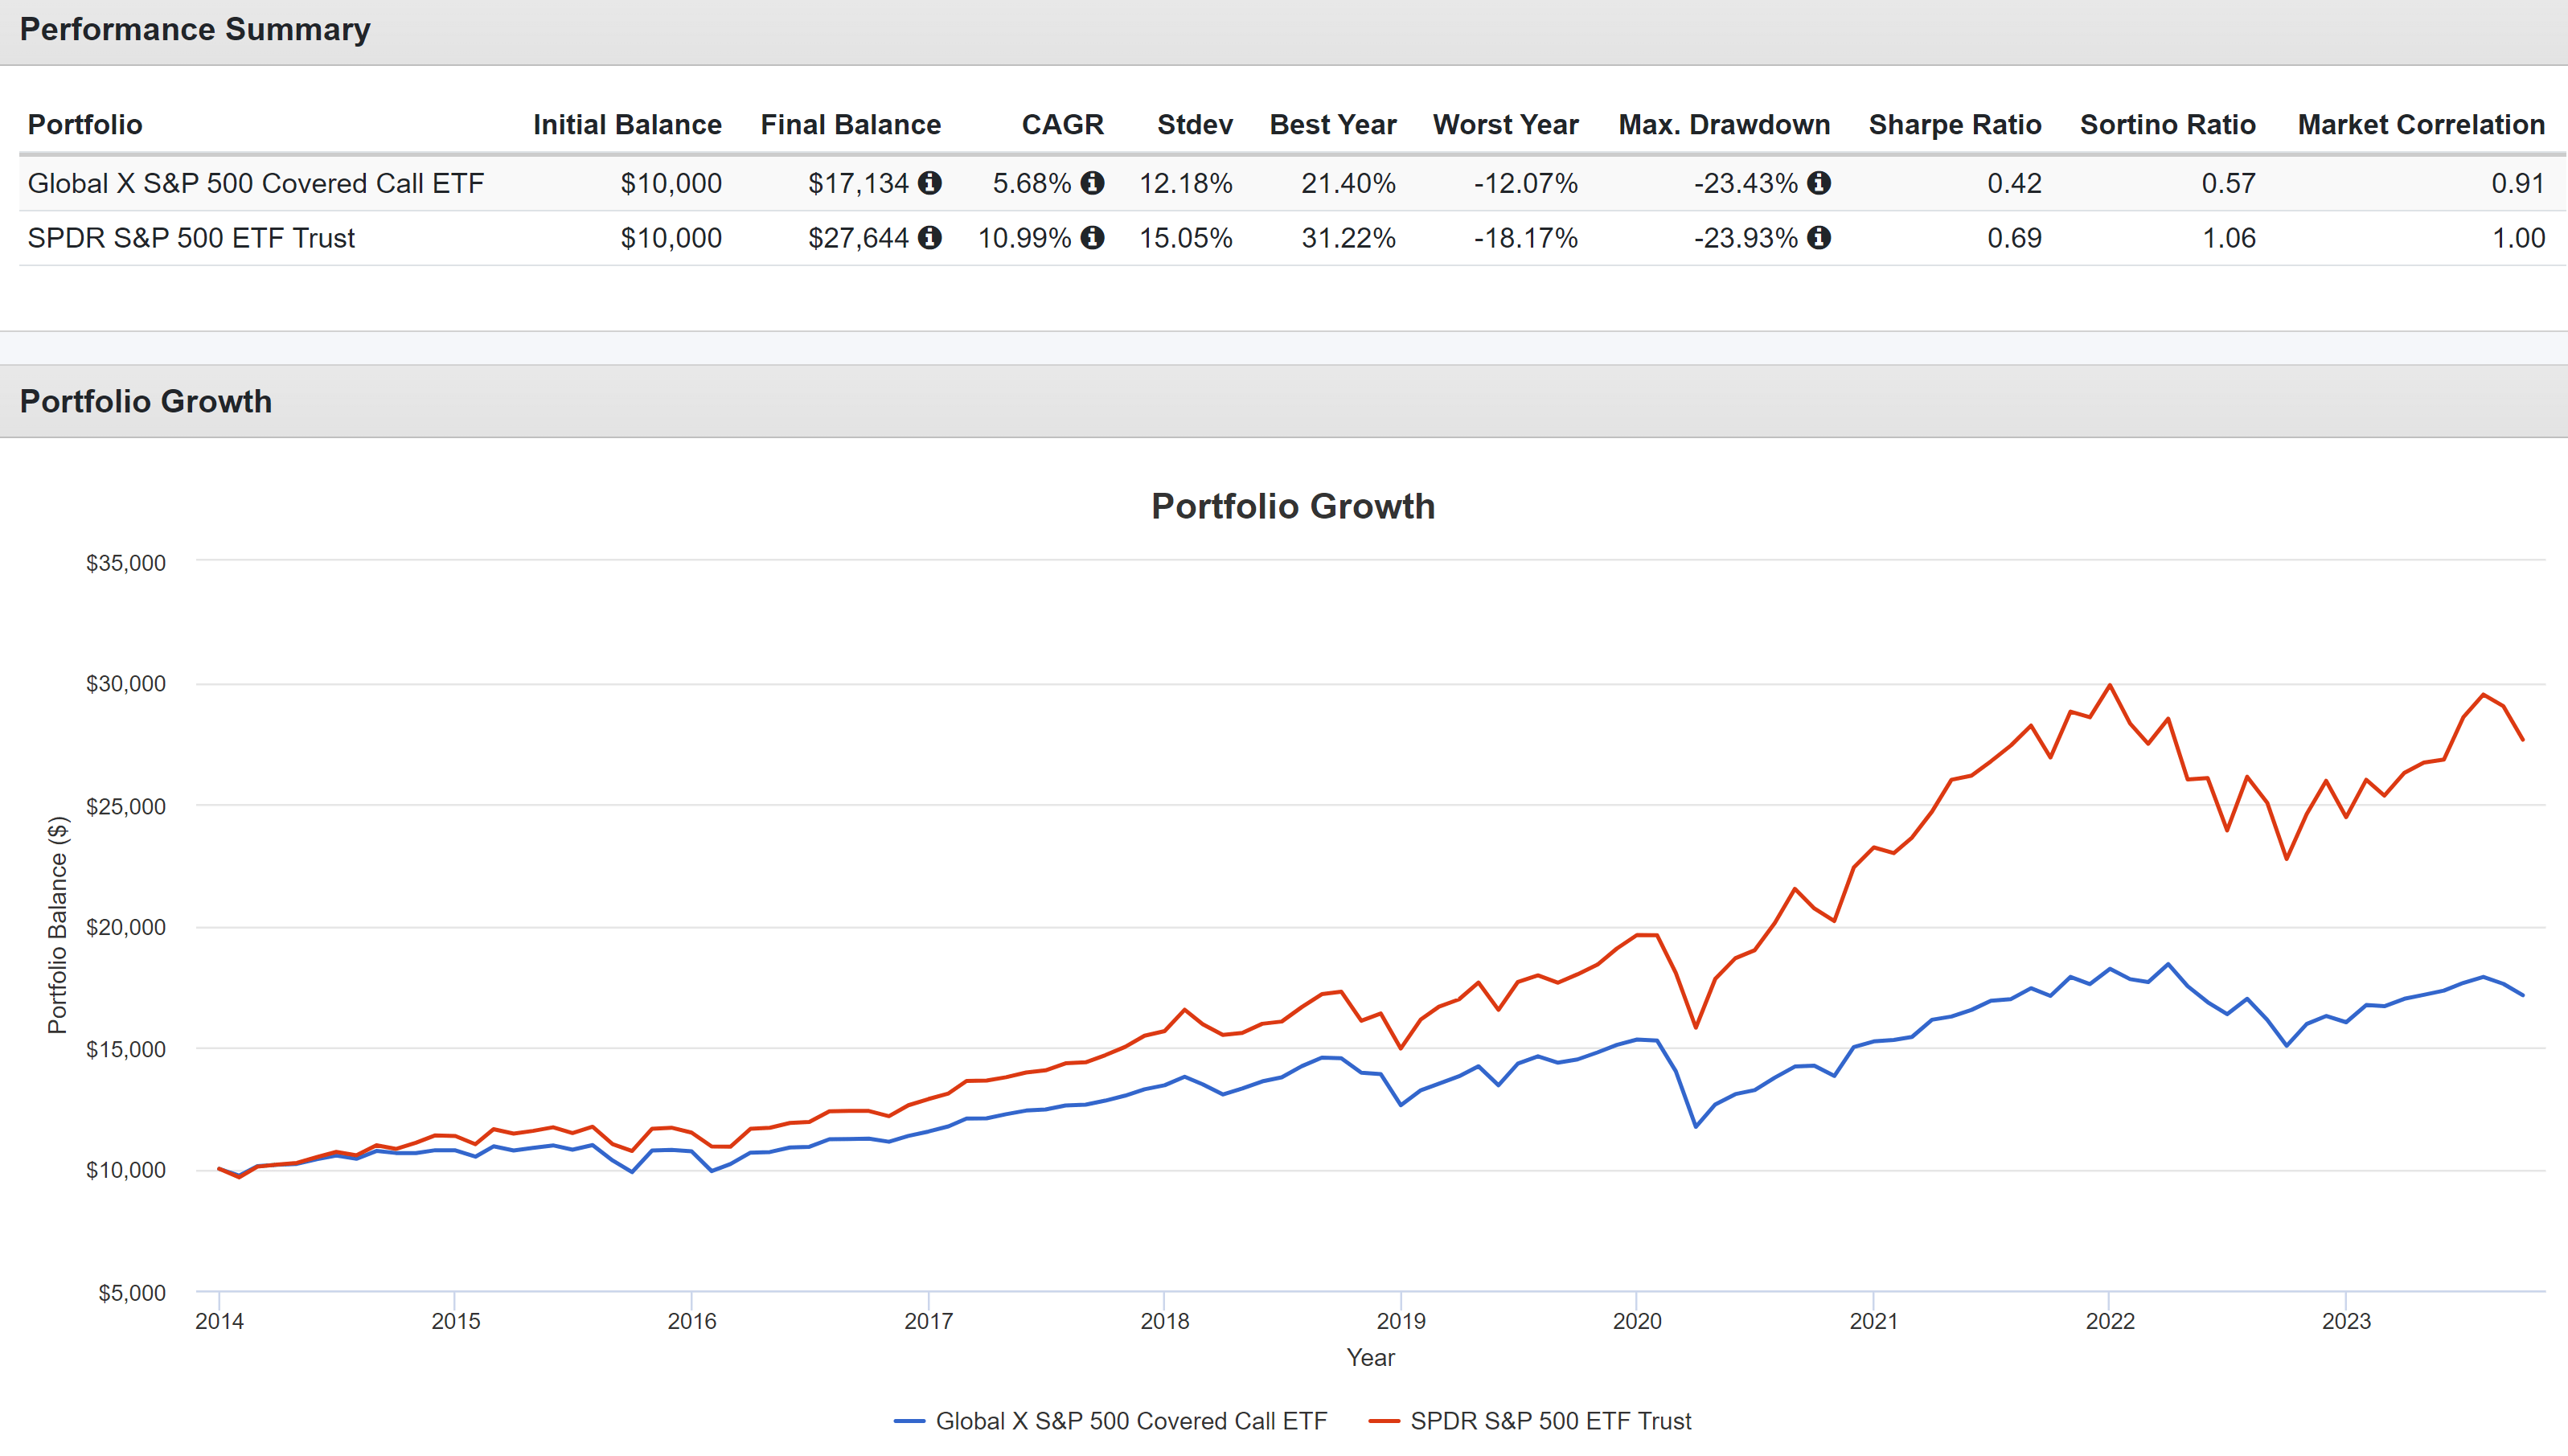
If you recall from the first chart that opened this article, SPYI’s total return since inception (7.59%) not only outperformed its peers but also closely tracked that of the S&P 500 (8.28%). However, when the performance of the option overlay strategies over a longer period of time, the lag has been much larger. As an example, the next chart compares the total return of XYLD to that of SPY in the past ten years. As seen, XYLD has underperformed SPY by a large margin in terms of total return, i.e., with its dividends included. To wit, XYLD delivered a total return of 81%, less than half of SPY's 193%.
There are a few underlying reasons accounting for such a large lag. First, the use of covered calls gives the right to the option buyer to buy the underlying asset at a certain price by a certain date, no matter how much the underlying assets’ price has appreciated. Thus, this strategy generates income at the cost of limiting the upside potential of the fund. Secondly, both XYLD and SPYI charge a relatively high fee (0.6% and 0.68% respectively). In comparison, the fees from most large passively indexed funds are close to zero these days. A drag of ~0.6% can accumulate and become significant over the years.
Unfortunately, none of the above reasons are incidental in my view. They are structural to the strategies used by SPYI and XYLD. As such, I anticipate both funds to underperform the overall market in terms of total return in the longer term. And furthermore, in SPYI’s case, I expect the lag to be more pronounced over the longer term than what it has been since its inception.
Other risks and final thoughts
I have been focusing on the downward risks so far. Before closing, it’s important to point out the upside risks too. First, the use of option overlay can produce higher yields in periods of volatility and thus reduce risks. As seen in the chart below, XYLD has demonstrated such lowered risks in the longer term. Compared to SPY, XLYD has suffered lower risks when measured by typical metrics such as standard deviation, worst drawdowns, and worst-year performance.
To wit, its average standard deviation has been on average 12.1% compared to SPY’s 15%. In particular, its worst year performance was -12% compared to SPY’s -18%. A 6% difference can mean a lot both in terms of financial and emotional stress. I expect SPYI to feature a similar risk profile given the similar strategy used. For SPYI, the fund can also be more tax efficient. The fund actively manages its option positions to take advantage of tax- loss harvesting opportunities.
All told, my overall conclusion is a neutral/hold thesis. I do not see a compelling reason to be bullish or bearish on either SPYI or XYLD (or other similar funds that use option overlays in general) under current conditions. The key consideration in my thesis is that their risk premium, when benchmarked using the yield spread against the risk-free interest rates, is simply on average currently. Thus, I do not see a skewness in the risk/return profile in either direction.
For further details see:
SPYI: Lessons From XYLD