IWX - SPYV: How Microsoft And Amazon Changed The S&P 500 Value Index
Summary
- Microsoft and Amazon are now part of the S&P 500 Value Index according to the newly constructed Style Indexes. Meanwhile, Exxon Mobil and Chevron are now considered top growth stocks.
- These are just a few significant changes that impact the SPDR S&P 500 Value ETF. Generally, the added companies have much higher historical volatility compared to the deleted ones.
- Suddenly, SPYV doesn't have much of an advantage over SPYG, its growth counterpart. Fundamentally, they are extremely similar, and it's the latter that now has better inflation protection.
- Investors wanting better exposure to the value factor should look elsewhere. Read on to see how SPYV compares with VTV, IWD, IUSV, SCHV, VLUE, MGV, RPV, NULV, IWX, and FTA.
Article Purpose
S&P 500 Style Indices rebalanced effective December 16, 2022, resulting in some significant changes that I plan to describe in detail. Among the names added to the Value Index were Microsoft ( MSFT ), Amazon ( AMZN ), and Meta Platforms ( META ), while Exxon Mobil ( XOM ) and Chevron ( CVX ) form part of the Growth Index. What this means for investors is that ETFs tracking these Indexes have much different profiles than before. This article focuses on the value side by looking at before-and-after fundamentals for the SPDR S&P 500 Value ETF ( SPYV ) at the company and industry levels. SPYV isn't as attractive anymore, and investors are better off selecting one of the ten other large-cap value ETFs whose fundamentals I'll describe in this analysis.
SPYV Overview
Strategy Overview
SPYV tracks the S&P 500 Value Index, one of several style Indexes produced by S&P Dow Jones Indices. As stated in the methodology document :
S&P U.S. Style Indices measure the performance of U.S. equities fully or partially categorized as either growth or value stocks, as determined by Style Scores for each security. The Style Index series is weighted by float-adjusted market capitalization.
Style Indexes like the ones tracked by SPYV and SPYG provide broad exposure to a particular style segment, while Pure Style Indexes provide narrow exposure with no overlapping holdings. The Style Index series divides the total market capitalization approximately equally into growth and value Indexes, with three style factors used for each.
S&P Dow Jones Indices
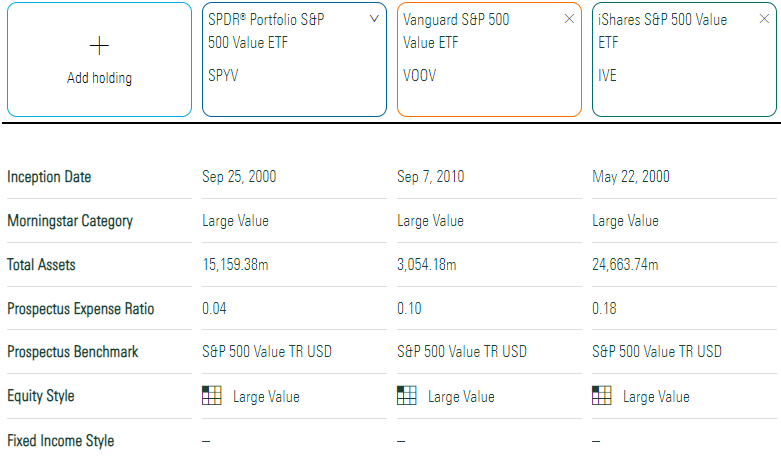
SPYV is the lowest-cost option for investors wanting exposure to the S&P 500 Value Index. Vanguard's VOOV has a 0.10% expense ratio, while iShares' IVE has a 0.18% expense ratio and is the largest by assets under management.
Sector Exposures and Top Ten Holdings
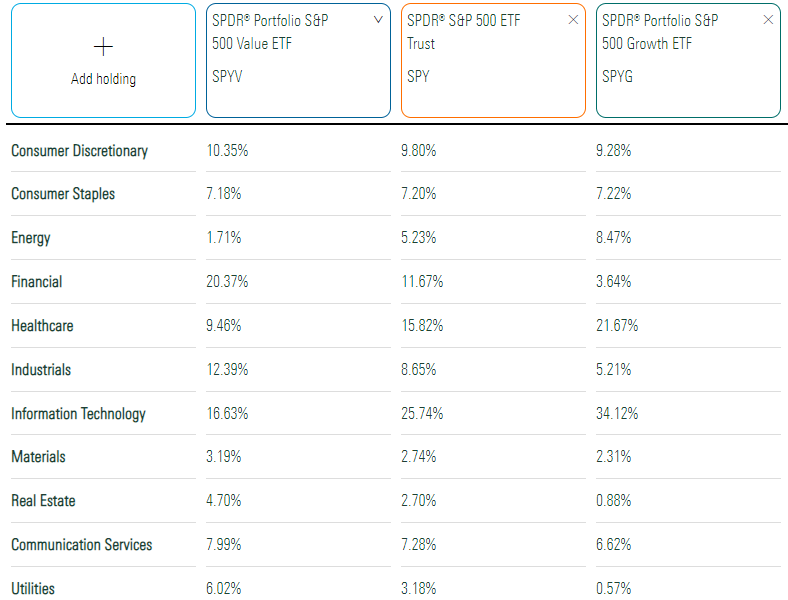
Sector exposures for SPYV, SPY, and SPYG are listed below. SPYV is arguably the most balanced by sector, with Financials as the largest at 20.37%. Technology follows at 16.63%, and you'll notice an 8-9% variance in these two sectors as you move from value to blend to growth.
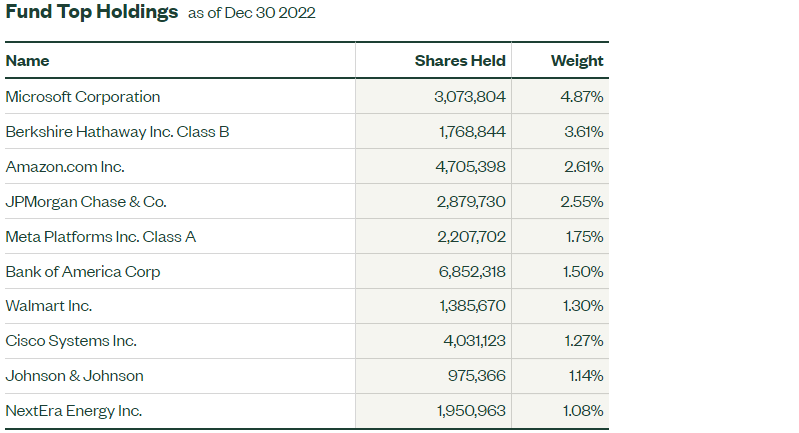
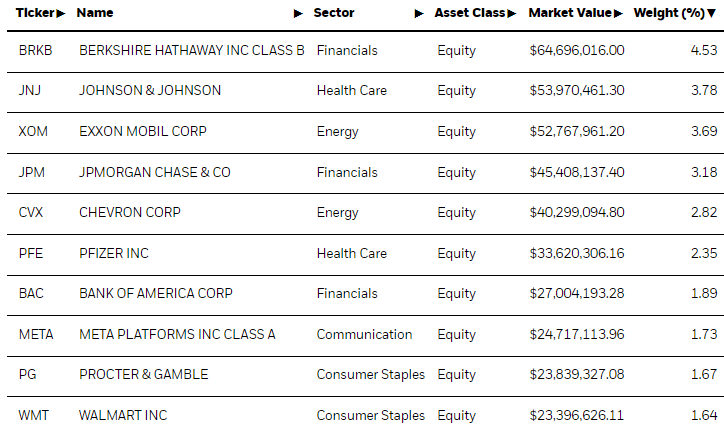
As mentioned, SPYV's top ten holdings now include Microsoft, Amazon, and Meta Platforms. It's hard to fathom, but META, for example, trades at just 13.28x forward earnings and 5.84x trailing cash flow. Previously , the top ten list included Exxon Mobil and Chevron, Coca-Cola ( KO ), and Merck & Co. ( MRK ). These are now among SPYG's top 25.
Performance History
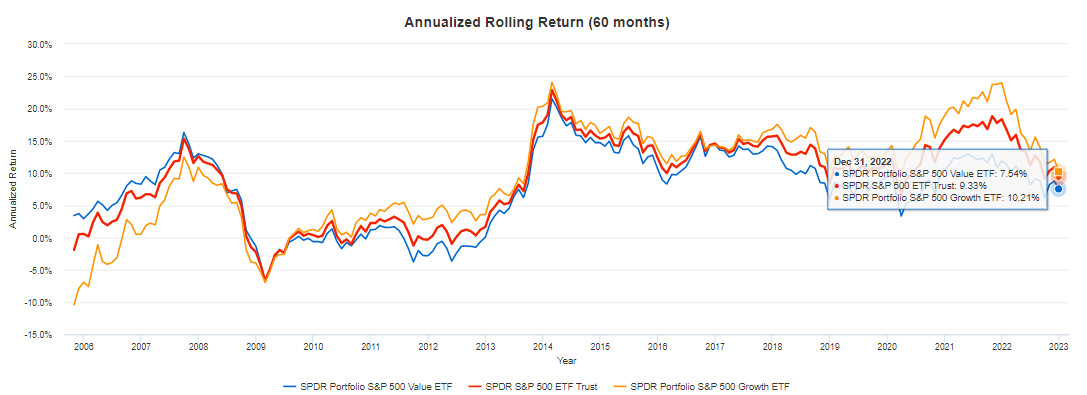
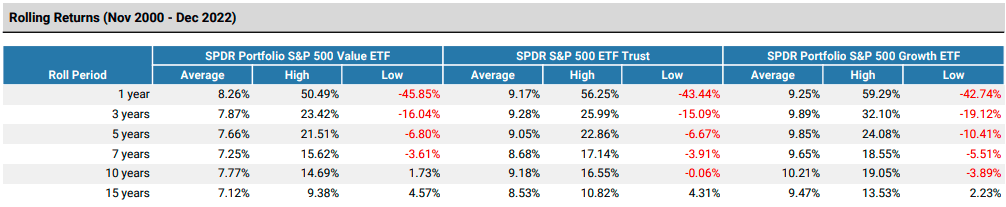
The following graph highlights rolling five-year returns for SPYV, SPY, and SPYG. From 2018-2022, SPYV gained an annualized 7.54% compared to 9.33% and 10.21% for SPY and SPYG. Therefore, even though SPYV outperformed SPYG by about 24% last year, growth investors were still better off over the medium term. SPYV's five-year returns haven't been better since the 2000s.
SPYV generally experiences lower highs and higher lows than SPYG. According to the table below, SPYV's worst ten-year period was an annualized 1.73% gain (18.71% total return), compared to a 3.89% annualized loss (-32.75% total return) for SPYG. On average, SPYG has been superior over all periods.
Reconstitution Recap
Top 20 Additions
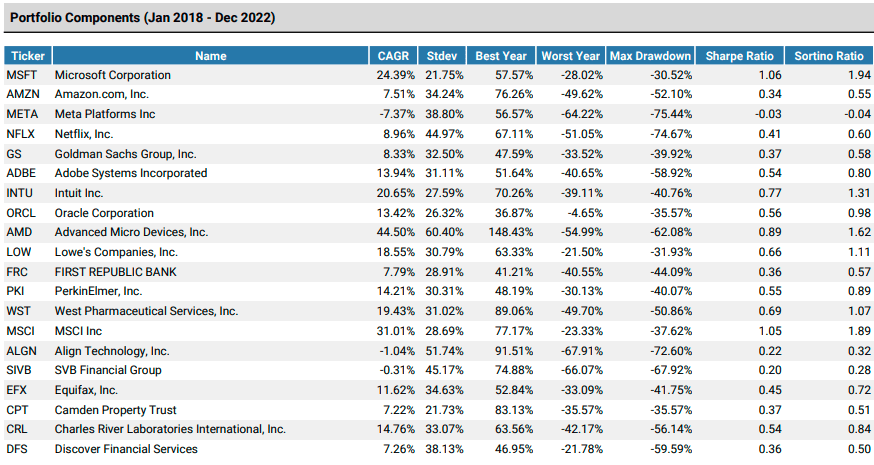
The following table highlights SPYV's top 20 additions, which total 13.57% of the portfolio. However, the top six are the only ones with weights above 0.50%, totaling 11.37%. What's interesting here is the historical volatility of these companies. Most have standard deviations above 30% over the last five years, much higher than the 20.43% figure for SPYG. Also, these companies' maximum drawdowns were more than SPYG's 30.40% drawdown from January to September 2022.
In addition, SPYV's allocation to JPMorgan Chase ( JPM ) and Bank of America ( BAC ) increased by 1.34% and 0.67%. There were also increases of 0.50% or more for Cisco Systems ( CSCO ), NIKE ( NKE ), Home Depot ( HD ), and salesforce.com ( CRM ), implying an improved value score.
Top 20 Deletions
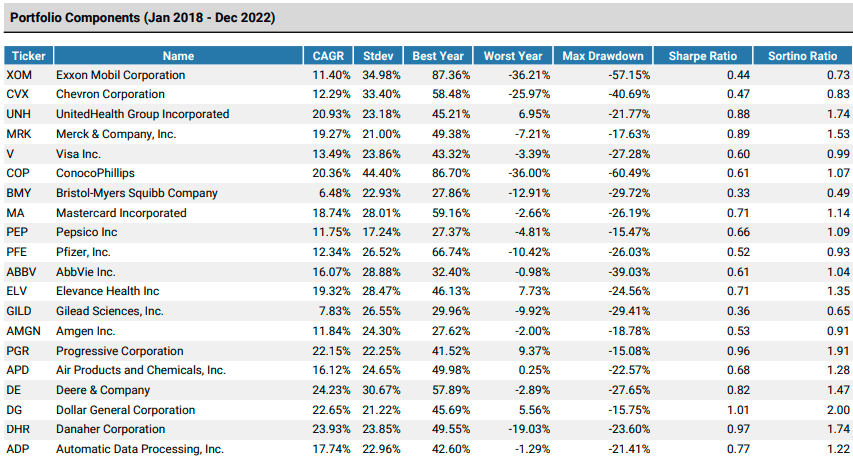
The next table highlights SPYV's top 20 deletions, representing 17.50% of the portfolio. The allocations are more evenly distributed, with the top ten totaling 13.00%. Overall, the volatility is much lower, as expected with value stocks.
In addition, Johnson & Johnson ( JNJ ), Procter & Gamble ( PG ), and Coca-Cola had their weightings reduced by 1.47%, 0.86%, and 0.78%, implying a lower value score. It makes sense, given how they trade at 17.58x, 25.96x, and 25.56x forward earnings, which is potentially elevated given how analysts estimate only single-digit earnings growth over the next year.
Industry-Level Summary
Finally, here's a quick recap of the top ten changes by industry.
- Systems Software: +5.69%
- Internet & Direct Marketing Retail: +2.77%
- Diversified Banks: +2.12%
- Interactive Media & Services: +1.74%
- Investment Banking & Brokerage: 1.20%
- Data Processing & Outsourced Services: -2.28%
- Managed Health Care: -2.46%
- Biotechnology: -3.07%
- Pharmaceuticals: -3.26%
- Integrated Oil & Gas: -4.73%
The combined 8.79% reduction to the Health Care industries (Managed Health Care, Biotechnology, and Pharmaceuticals) effectively makes SPYV a much less defensive ETF than before. For the opposite reason, the added Systems Software stocks ( MSFT , ADBE , ORCL ) and Internet & Direct Marketing Retail ( AMZN ) accomplish the same. In short, these may technically be value stocks now, but we shouldn't confuse value with safety. Arguably, the minimal Energy exposure may make SPYV less safe than SPYG if high inflation persists.
Fundamental Analysis
SPYV: Now vs. Then By Industry
To add further color, let's imagine SPYV's previous composition was still investable. I've calculated the following metrics for this hypothetical portfolio against the actual one, and I think you'll find the changes in volatility, expected growth, valuation, and earnings momentum surprising.
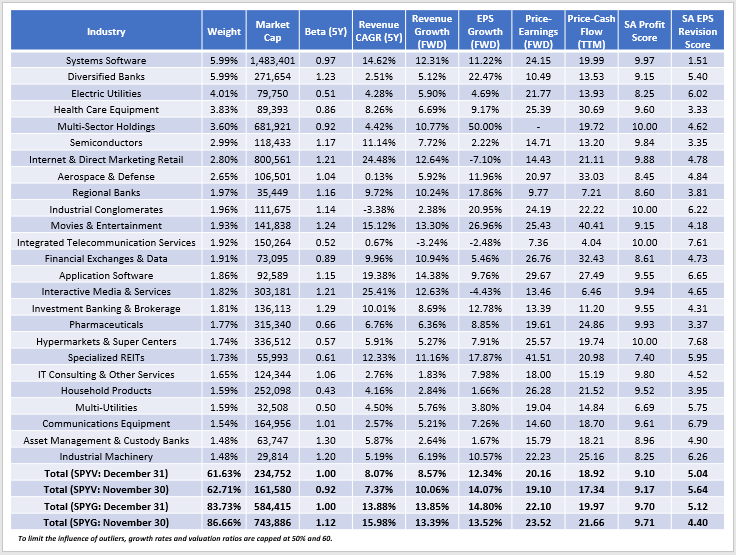
The concentration in SPYV's top 25 industries remained about the same (61.63% vs. 62.71%). However, the weighted-average market capitalization increased from $162 billion to $235 billion because of the addition of several mega-cap stocks. The portfolio's five-year beta increased from 0.92 to 1.00, while SPYG's decreased from 1.12 to 1.00. Another significant change was in each portfolio's Seeking Alpha EPS Revision Grade. These Grades, which I've weighted and normalized on a ten-point scale, indicate that SPYV's current portfolio has weaker earnings momentum (5.04/10 vs. 5.64/10). Microsoft is one company you can blame. Its "F" EPS Revision Grade reflects how 37/37 analysts have downgraded next quarter's earnings estimates over the last 90 days by 10.46% on average.
This table also reflects how SPYV's forward price-earnings ratio increased from 19.10 to 20.16, even as estimated earnings growth decreased from 14.07% to 12.34%. In contrast, SPYG moved in the opposite direction on these two metrics. With a better profitability score and a five-point advantage on estimated sales growth, SPYG looks like the better play.
Remember, You Have Choices
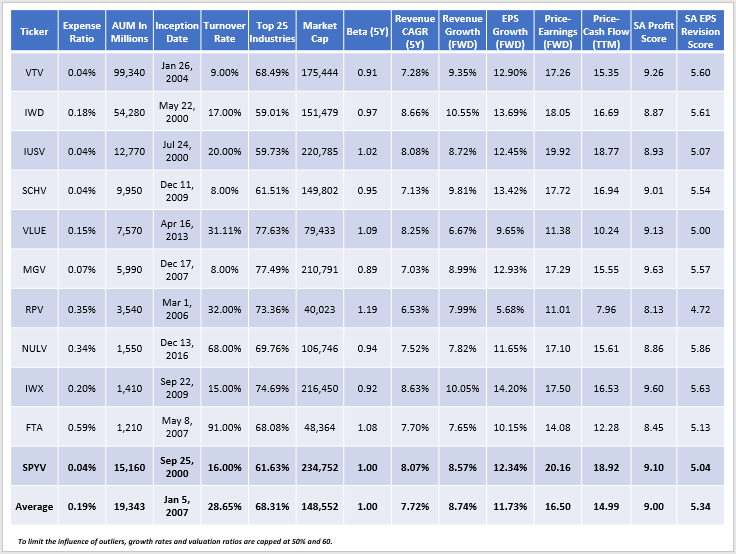
Readers should remember that the S&P 500 Value Index is just one of many choices. I've identified ten other large-cap value ETFs with at least $1 billion in assets under management:
- Vanguard Value ETF ( VTV )
- iShares Russell 1000 Value ETF ( IWD ); Vanguard's VONV
- iShares Core S&P U.S. Value ETF ( IUSV )
- Schwab U.S. Large-Cap Value ETF ( SCHV )
- iShares MSCI USA Value Factor ETF ( VLUE )
- Vanguard Mega Cap Value ETF ( MGV )
- Invesco S&P 500 Pure Value ETF ( RPV )
- Nuveen ESG Large Cap Value ETF ( NULV )
- iShares Russell Top 200 Value ETF ( IWX )
- First Trust Large Cap AlphaDEX ETF ( FTA )
The following table highlights the same metrics for each of these ETFs, along with helpful information like the fund's expense ratio, assets under management, dividend yield, inception date, and the latest annual turnover rate. Have a quick scan, and I'll offer my thoughts afterward.
The first thing I noticed is that all these alternatives trade at lower valuations than SPYV, both on forward earnings and trailing cash flow. RPV is one deep-value option for those liking the screens S&P Style Indices use. It trades at just 11.01x forward earnings, but the sacrifices are an above-average 0.35% expense ratio, high volatility, low earnings growth, and low profitability and EPS Revision scores. These are good reasons for its discounted valuation, so investors are really betting on a turnaround, both in results and sentiment.
IWX tracks the Russell Top 200 Value ETF and looks more appealing. It has 10% exposure to Energy stocks, with Financials and Health Care at 21% and 22%, respectively. Technology is 8%, and although Meta Platforms is included, Microsoft and Amazon aren't. The following top ten holdings align with what I consider value stocks. In addition, IWX has a 0.92 five-year beta, trades at 17.50x forward earnings, has the highest estimated earnings growth rate at 14.20%, and has an excellent 9.60/10 profitability score.
I'm unfamiliar with NULV, but its fundamentals also look solid. The ESG theme usually doesn't interest me that much, but it still has 5% Energy exposure and a decent mix of Soft Drinks, Biotechnology, Semiconductors, and Diversified Bank stocks. Importantly, its 5.86/10 EPS Revision Score is the highest in the sample, but the downsides include a high 0.34% expense ratio and below-average sales and earnings growth. For investors betting on a market turnaround, it's probably not ideal.
Finally, VTV and MGV have very similar fundamentals and, historically, have moved almost perfectly in line with each other. However, data is based on holdings as of November 30, 2022, as that's all Vanguard has provided. I've reviewed the latest portfolio composition file for January 3, 2023, and I didn't notice many changes, except for Meta Platforms added as the 29th largest holding. Therefore, the fundamentals listed above should be accurate, but if there are any significant changes next month, I will provide an update.
Investment Recommendation
I don't recommend investors buy SPYV today because the annual reconstitution weakened its value fundamentals. The portfolio's five-year beta increased from 0.92 to 1.00, estimated earnings growth decreased from 14.07% to 12.34%, and the forward earnings valuation increased from 19.10 to 20.16. As a result, SPYV's fundamentals compared to SPYG are too similar, with the latter arguably having a slight edge.
Besides, there are plenty of alternative large-cap value ETFs. VTV and MGV hold less-volatile stocks with greater growth potential at a lower valuation. RPV is more volatile, but its "pure" approach to value means less overlap with broad-based funds. Finally, IWX keeps high exposure to value-favored sectors like Health Care and Financials, has a healthy 10% exposure to the Energy sector, and doesn't include some of the riskier options mentioned in this article like Microsoft, Amazon, and Meta Platforms. Owning these value ETFs, or a combination of them to suit your preferences, is the way to go. Thank you for reading, and if you'd like more information on U.S. Value ETFs, please feel free to comment below.
For further details see:
SPYV: How Microsoft And Amazon Changed The S&P 500 Value Index