IWX - SPYV: Weak On Value Strong On Growth
2024-01-08 23:35:13 ET
Summary
- SPYV has not been an ideal choice during years when markets have favored value over growth. My performance analysis reveals only a 25% success rate versus the Vanguard Value ETF.
- Instead, SPYV has relied on its above-average growth fundamentals to participate in the recent strong bull market. A switch to value would put SPYV at a disadvantage over most peers.
- I compared SPYV with 91 large-cap value and dividend ETFs to confirm. SPYV ranks in the third-quartile on nearly every value metric, including traditional metrics like P/S, P/CF, and P/E.
- Buying a value ETF because it ranks well on growth doesn't make much sense. Instead, I will suggest three alternatives for readers to consider.
Investment Thesis
Two months ago, I predicted the SPDR S&P 500 Value ETF ( SPYV ) would see its top three contributors in 2023 ( MSFT , META , AMZN ) exit the Index. That's precisely what happened with the December reconstitution, and unlike how last year began, SPYV's fundamentals are in stark contrast with the SPDR S&P 500 Growth ETF ( SPYG ). It's a good thing, as it provides investors with a clear choice between value and growth. Unfortunately for SPYV shareholders, the ETF has not been an ideal choice during years when the market has favored value over growth, calling into question its purpose and strategy.
My fundamental analysis raised another yellow flag. After calculating factor scores for 92 large-cap value and dividend ETFs, I determined SPYV ranks in the third quartile on value and nearly the first quartile on growth. In other words, SPYV should only outperform in 2024 if the growth factor is favored, and since it makes more sense to buy a growth fund under those conditions, buying SPYV today isn't logical. I've stopped short of rating it a "sell," as growth stocks still are mostly favored on Wall Street. However, many other ETFs are better value-oriented and don't sacrifice other essential factors like profitability and momentum. I look forward to discussing them below and answering your questions in the comments afterward.
SPYV Overview
Strategy Discussion
SPYV tracks the S&P 500 Value Index, which measures the performance of large-cap U.S. stocks either fully or partially categorized as value. Unlike Pure Style Indices, the Value and Growth Indexes have some overlap, and it is all determined each December based on how S&P 500 stocks rank on three growth and value factors, as follows:
S&P Dow Jones Indices
The momentum factor was the deciding factor this year. Microsoft , Meta Platforms , and Amazon exited the Index due to their 58%, 194%, and 81% gains in 2023. Long considered growth stocks by many, their losses in 2022 (28%, 64%, and 50%) allowed them entry into SPYV in the first place. To be sure, the other factors still count. However, price is the common denominator for all the value-related factors above, so, at the end of the day, SPYV is about owning poor performers and hoping they'll rebound. The strategy worked well in 2023, but as for 2024, there may be better options. Let's dig deeper into why next.
Performance Analysis
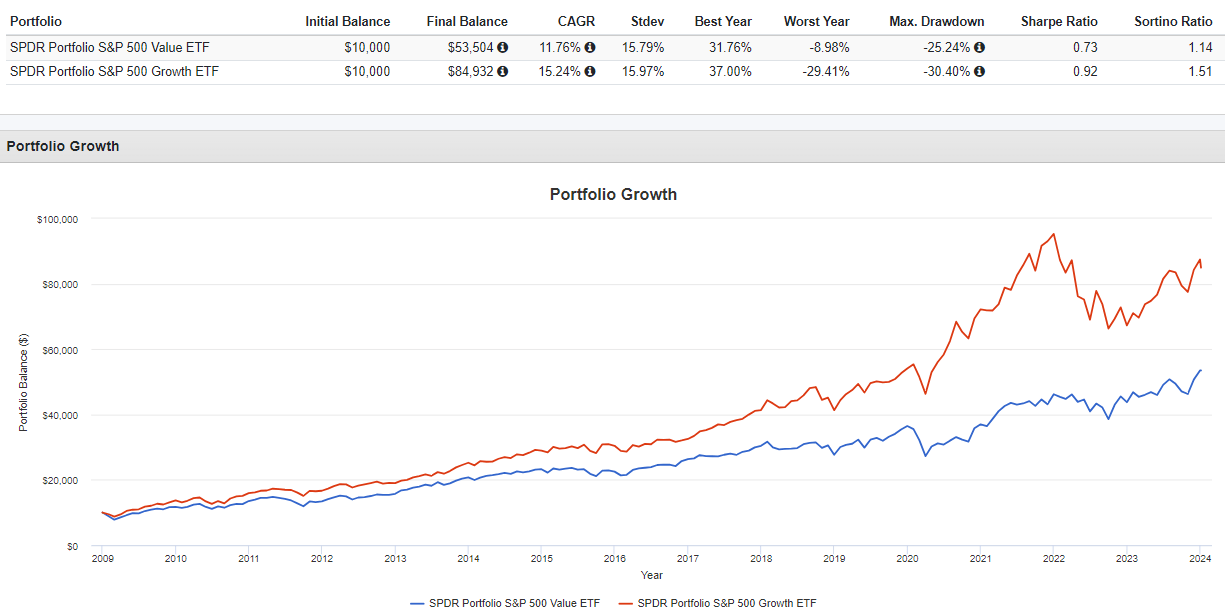
Chart analysis can be deceiving. While it's true that numbers don't lie, I've always found it beneficial to understand the reasons behind the numbers. When I see a chart like the one below, I don't automatically conclude that SPYG is superior. Instead, the growth factor was favored most over the last 15 years, so SPYV's underperformance is a logical outcome.
The Vanguard Value ETF ( VTV ) is a solid benchmark for large-cap value stocks. It's broad-based, has little turnover, and its constituents tend to be highly profitable, something I look for with any ETF. With no momentum screen, its portfolio doesn't abruptly change because of one-year price movements. Instead, its Index assesses five ratios and even includes one forward-looking metric in a nod to changing market conditions:
- Book-To-Price Ratio
- Future Earnings-To-Price Ratio
- Historical Earnings-To-Price Ratio
- Dividend-To-Price Ratio
- Sales-To-Price Ratio
Performance with SPYV is competitive. Since 2008, SPYV and VTV have gained an annualized 7.92% and 8.01% per year, with VTV having a slight edge on volatility, leading to better risk-adjusted returns.
It's not this result that I'm interested in, though. I'm interested in which ETF performs better when the market favors value stocks. It's an important distinction because value ETFs designed to outperform in growth markets don't serve their purpose, as it's better to invest in something like SPYG instead. To evaluate this, I looked at how SPYV performed in years when VTV outperformed the SPDR S&P 500 ETF ( SPY ) and summarized the results in four bullet points.
1. Between 2008 and 2023, VTV only outperformed SPY four times: 2008 (0.93%), 2013 (0.79%), 2016 (5.12%), and 2022 (16.11%). VTV underperformed SPY 12 times, with a 4.78% average annual underperformance. VTV's average annual underperformance for all years was 2.14%, so my first and obvious conclusion is that growth was the superior investment style over the last 16 years. Being mindful of this is crucial, as it will help explain why SPYV performed the way it did.
2. For the four times VTV outperformed SPY, SPYV underperformed VTV by 1.26% on average: 2008 (0.42%), 2013 (1.34%), 2016 (0.05%), and 2022 (3.22%). Therefore, my second conclusion is that SPYV has historically been inferior to VTV when the market favors the value factor.
3. For the 12 times VTV underperformed SPY, SPYV outperformed VTV by 0.54% on average, but the distribution is heavily skewed by SPYV's substantial outperformance in 2019 (6.05%) and 2023 (12.87%). There are no other outliers, and without these two years, SPYV's average annual underperformance was 1.25%. Still, my third conclusion is that SPYV has historically been superior to VTV when the market favors the growth factor. This conclusion is further supported when you consider that SPY gained 31.22% and 26.19% in 2019 and 2023, two strong bull market years where SPYG gained over 30%.
4. We can eliminate the distribution's skewness by calculating a simple win/loss rate for SPYV vs. VTV. Over the 16 years, SPYV outperformed just four times, or 25% of the time. Therefore, my fourth and final conclusion is that historical performance indicates VTV is superior in any random year. SPYV has the potential to outperform substantially, but only in years when growth stocks are favored. In those cases, growth ETFs like SPYG were superior.
To summarize, SPYG has matched VTV's returns since January 2008 primarily because the market favored growth stocks. Put differently, VTV matched SPYV's returns despite value stocks only outperforming 25% of the time (4/16 years). Therefore, it's reasonable to conclude it's the better value ETF. You might imagine the performance difference had value stocks been in favor even 50% of the time, and it's prudent to consider that possibility moving forward.
Fundamental Analysis
Key Highlights
Evaluating performance is helpful, but it's equally beneficial to understand each ETF's fundamentals. The following high-level review illustrates the key differences between SPYV, VTV, SPY, and SPYG as of January 8, 2024.
The Sunday Investor
A few notes:
1. SPYV and VTV have similar weighted average five-year betas (0.93 and 0.92). These betas are typical of large-cap value and dividend ETFs and suggest less volatility than the overall market.
2. SPYV and VTV also have similar weighted average market capitalizations of $170 billion and $185 billion, respectively. SPYV's figure has decreased substantially with the recent exit of Microsoft, Meta Platforms, and Amazon. Just two months ago, it was $391 billion, so that should give you an idea of the impact those stocks had on the fund's performance and fundamentals.
3. Compared to VTV, SPYV has a higher historical five-year revenue growth rate (6.35% vs. 5.92%), but VTV has the advantage on estimated revenue and earnings per share growth. SPYV has a better growth score (4.80/10 vs. 4.67/10), which I calculated by normalizing Seeking Alpha Growth Grades on a ten-point scale and weighting each stock accordingly.
4. SPYV trades at 20.44x forward earnings vs. 18.88x for VTV. It also has higher price-sales, price-book, and price-cash flow ratios, and a lower value score (3.58/10 vs. 3.79/10). Along with its higher growth score, these calculations support my earlier conclusions drawn on performance.
5. The chart highlights a nice progression on numerous factors as we move between value, blend, and growth. Most changes are intuitive - SPYV and VTV trade at lower valuations, while ETFs like SPYG have better growth rates. However, there is also a quality correlation, as measured by profitability. SPYV's profit score is just 8.99/10, while SPYG's is 9.77/10, leading to my conclusion that growth stocks are more profitable. This finding is reason enough to throw away the returns from the early 2000s when the largest growth stocks weren't profitable and crashed in subsequent years. It's hard to imagine that happening with today's growth stocks, and since SPYG also has a strong momentum score, I've concluded that growth stocks remain in control.
SPYV: Value Rank
Next, I want to highlight how there are many alternative ETFs to choose from. Fundamentals are hard to come by, but I've calculated hundreds of them for nearly 1,000 U.S. Equity ETFs, and I'm in a unique position to make comparisons and rank funds accordingly. Let's start with how SPYV ranks compared to 91 other large-cap value and dividend ETFs. Based on its value score, it's only #71/92, but here are the underlying metric rankings to provide greater clarity:
- TTM Price-Sales: 3.56x (#63)
- MRQ Price-Book: 6.11x (#44)
- TTM Price-Cash Flow: 16.02x (#70)
- TTM Price-Earnings : 23.81x (#65)
- FWD Price-Earnings: 20.44x (#65)
- TTM PEG: 1.88x (#52)
- FWD PEG: 3.34x (#60)
- TTM EV-Sales: 4.27x (#60)
- TTM EV-EBITDA: 15.55x (#68)
- TTM Debt-FCF: 9.62x (#40)
- Value Score: 3.58/10 (#71)
- Profit Score: 8.99/10 (#39)
I included SPYV's profit score in the analysis because high-quality stocks will perform well in the long run. My research shows that large-cap ETFs should have a minimum score of around 9.10/10, so while SPYV is slightly below that, it's close enough and is sure to change throughout the year.
Still, you'll notice that SPYV's rankings are almost exclusively in the third quartile, indicating it's not a great value fund despite the name. Remember that it's important to use several metrics when evaluating ETFs, as it's easy for ETF providers to hide poor fundamentals by only highlighting the metrics they want you to know. In this sample of 92 ETFs, the #1 ranked ETF by value score is the Invesco S&P 500 Pure Value ETF ( RPV ), which trades at 12.60x forward earnings and 1.05x trailing sales. On paper, it's incredible. However, you should also consider these metrics, which might explain why it's lagged SPYV by 54% over the last decade:
- Profit Score: 8.01/10 (#84)
- FWD EPS Growth: -2.51% (#91)
- EPS Revision Score: 5.02/10 (#91)
In addition, its five-year beta is 1.12, and 30% of the portfolio is assigned to Financials. That's a big bet value investors place on a concentrated group of low-quality and low-growth stocks with above-average volatility. In short, there's a reason these are "pure value" stocks, and it's only prudent to consider the odds that your market outlook is wrong.
SPYV: Growth Rank
So far, I've established that SPYV is a relatively weak large-cap value ETF based on an analysis of historical performance and current fundamentals. The performance data also suggests it's stronger than most on the growth factor, but let's see what the fundamentals look like. Here is how SPYV ranks on 14 metrics, including its weighted average growth, momentum, and earnings revision scores.
- Revenue 5Y CAGR: 6.35% (#49)
- Revenue 3Y CAGR: 9.91% (#58)
- TTM Revenue Growth: 3.94% (#26)
- FWD Revenue Growth: 4.98% (#48)
- EBITDA 3Y CAGR: 10.55% (#66)
- TTM EBITDA Growth: 2.66% (#26)
- FWD EBITDA Growth: 4.91% (#48)
- EPS 3Y CAGR: 14.51% (#61)
- TTM EPS Growth: 3.14% (#36)
- FWD EPS Growth: 4.91% (#44)
- Total Assets 3Y CAGR: 5.28% (#53)
- Growth Score: 4.80/10 (#28)
- Momentum Score: 5.90/10 (#71)
- EPS Revision Score: 5.51/10 (#71)
Notice how one-year forward-looking metrics are slightly below average while one-year historical metrics are ranked relatively high. I am concerned with this, especially considering its poor EPS Revision score, which might lead to further earnings downgrades by Wall Street analysts. Still, at a minimum, SPYV's growth metrics are better than its value metrics, providing another piece of evidence that SPYV does not work as advertised.
Three Alternatives Worth Considering
Briefly, I want to summarize three value ETFs to consider. I carefully selected these ETFs based on their similarities to SPYV in size (market cap) and volatility (beta). The main differences are that all trade at a cheaper forward earnings valuation and have a superior value score.
The Sunday Investor
The iShares Russell Top 200 Value ETF ( IWX ) and the Vanguard Mega Cap Value ETF ( MGV ) look interesting, offering the same 3.63/10 value score and slightly more estimated earnings per share growth. I also like how they're more profitable, though diversification could be better. Neither has meaningful exposure to Consumer Discretionary, Real Estate, and Utilities.
The Vanguard High Dividend Yield ETF ( VYM ) is another choice that offers profitability similar to SPYV but trades nearly three points cheaper on forward earnings. Surprisingly, forward-looking earnings growth estimates are similar, but my warning to all dividend investors is not to rely on dividend growth much moving forward. Raising dividends without sufficient earnings growth is unrealistic, but at least VYM solves the diversification problem. Its top two sectors total 34% of the fund compared to 41%, 44%, and 42% for SPYV, IWX, and MGV.
Investment Recommendation
I want readers to think of investing as a spectrum, with SPYV leaning closer to the growth side among its value peers. With nearly 100 alternatives, finding one that suits your needs is possible, but investors must be aware there are always sacrifices. My fundamental analysis revealed weaknesses in traditional valuation metrics like price-sales, price-cash flow, and price-earnings, and more minor compromises on forward-looking sales and earnings growth and profitability. My performance analysis also supported these findings, as SPYV has only outperformed VTV 25% of the time since 2008, and typically when growth stocks outperformed. As a result, I don't think SPYV is a great large-cap value fund, and I have limited my rating to a "hold" while encouraging shareholders to consider alternatives. Thank you for reading.
For further details see:
SPYV: Weak On Value, Strong On Growth