SGU - Star Group: Initial Innings Of Long-Term Bull May Be Commencing (Technical Analysis)
2023-04-20 01:51:53 ET
Summary
- Shares have broken out on the long-term chart.
- This is confirmed through an ascending triangle setup on the intermediate chart.
- Volume trends remain bullish. The recent dividend increase means the company has increased the payout for the past 10 years straight.
Intro
In Star Group, L.P.'s ( SGU ) last two earnings reports, the market has clearly liked what it has seen. Star Group continues to acquire heating companies with two purchases in the recent first quarter following on from a further five deals in fiscal 2022. To date, taking into account expenses and the ongoing customer attrition SGU has to deal with in this industry, consistent acquisitions have been having the desired effect on the company's financials. Adjusted EBITDA grew by $4.6 million in Q1 fiscal 2023 with the net account growth figure of 1.7% being the best growth reading in this key area for quite some time. Suffice it to say, as long as Star Group's acquisitions make financial sense where more value can be added to more customers over time, the market will continue to reward the stock.
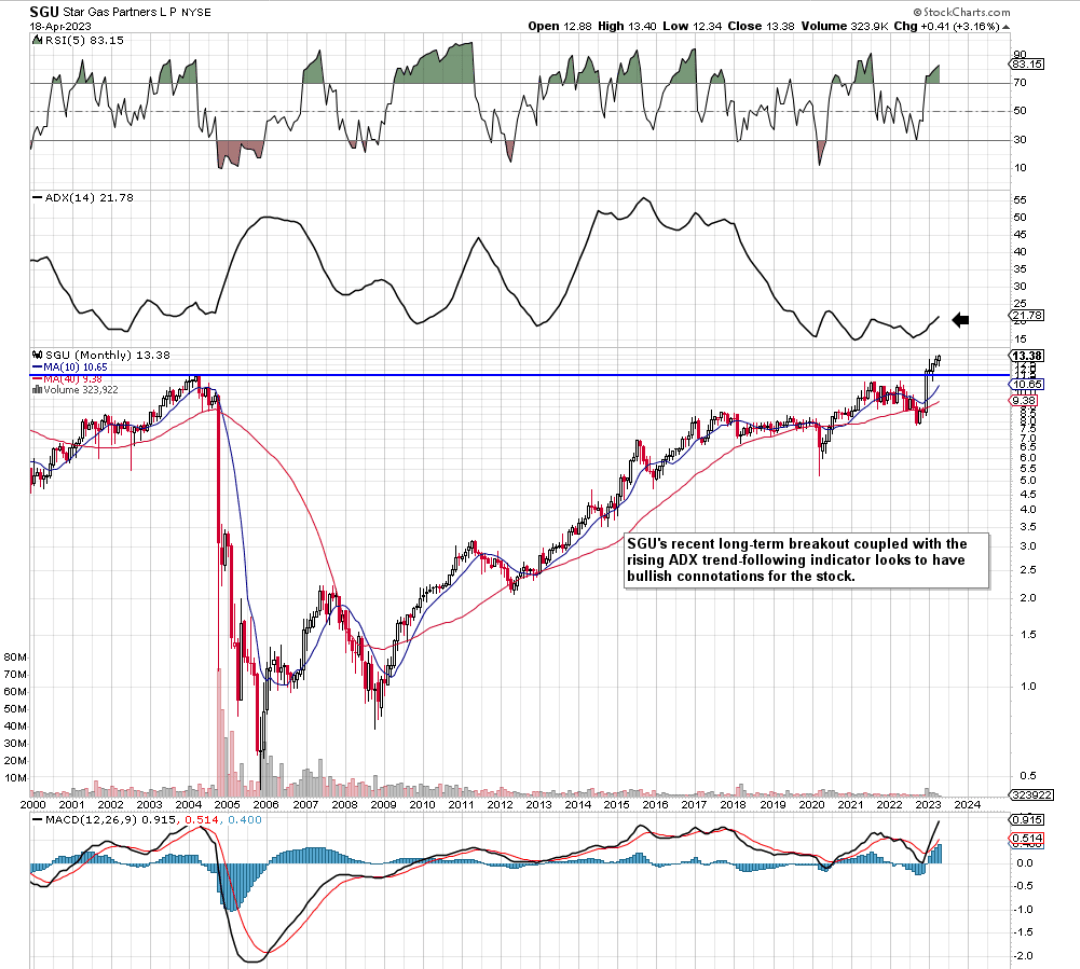
In fact, if we go to SGU's long-term chart, we see that we have not one but two noteworthy signals which indicate that a sustained rally in SGU could be just getting started. Long-term charts can be very useful for forecasting purposes as price-action can be compressed in order to study a given time period (Usually 20+ years).
The first signal is the recent breakout above the company's previous all-time highs which were registered back in 2004. As we see below, the breakout took place very close to the turn of the year. Now many times, false breakouts turn over quickly but SGU shares have managed to print successive higher highs in January of this year, March, and recently in April @ $13.38 per share. Higher highs (Over A period of almost 4 months) are a bullish long-term indicator.
Secondly and probably more important is the trajectory of the popular ADX trend-following indicator. This indicator is an excellent ally to have in one's arsenal when one is looking for stocks that are potentially beginning long-term trends. As we see below, SGU's long-term ADX reading rose above the pivotal 20 level demonstrating that a sustained upward move could be on the cards. Therefore, when one combines this occurrence with the breakout and the fact that SGU'S ADX has been able to surpass 50 in the past, the opportunity for long-term gains is compelling here.
Intermediate Technicals
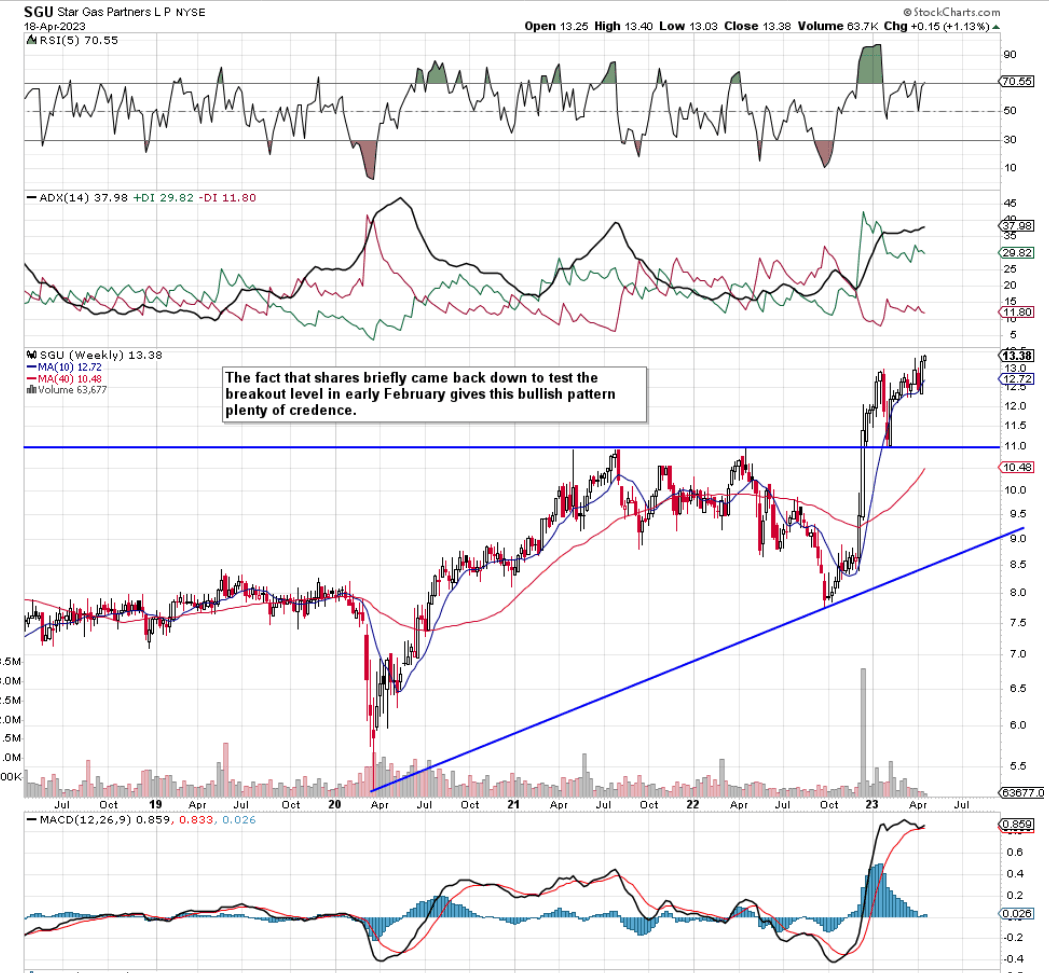
If we now pull up an intermediate 5-year chart, we can see that shares have been undergoing an ascending triangle pattern which commenced in early 2020. This type of triangle illustrates that buying is more prevalent in the stock. The breakout mentioned above confirmed this pattern but the real takeaway of this pattern is its forecasting implications. The height of the pattern for example at its widest point comes in well over $5 a share. This means shares of SGU would at least need to get to $16 a share before this pattern would be completed here.
Daily Technicals
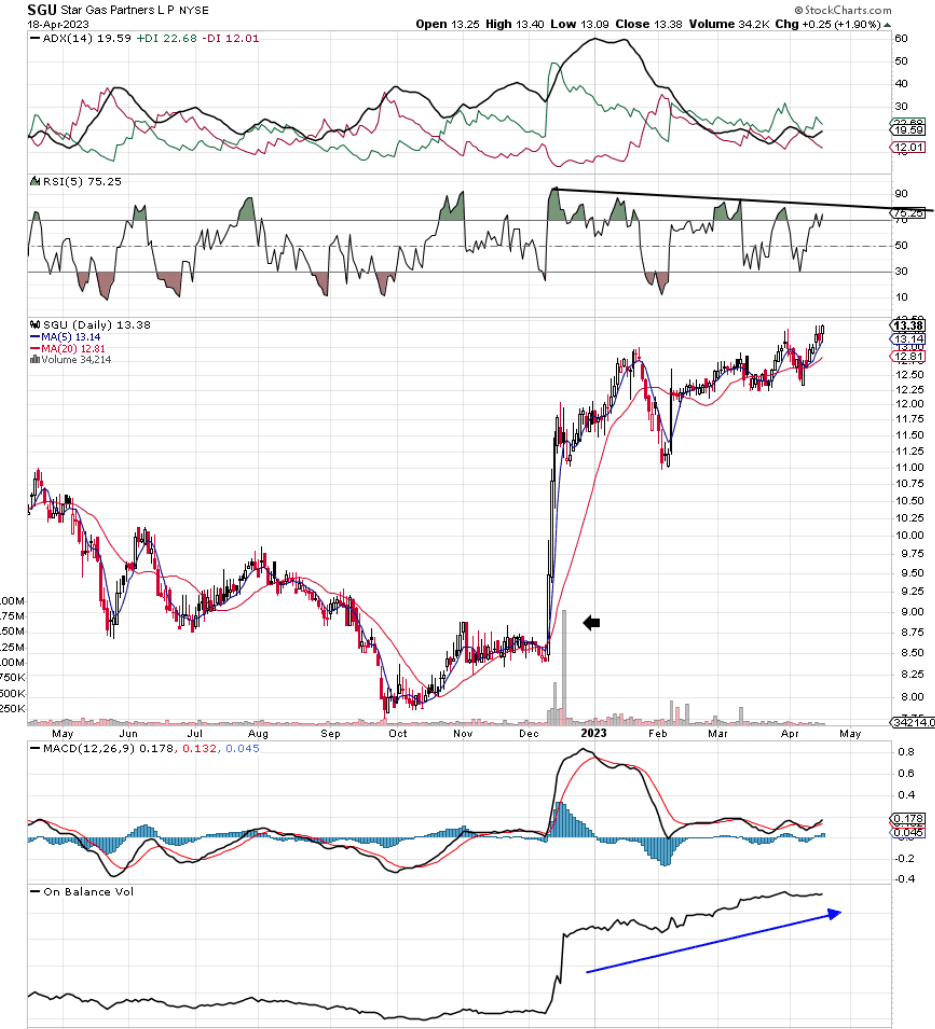
When we move on to SGU's daily chart, we get confirmation of the intermediate-term ascending triangle pattern. As we see below, the breakout took place on the strong volume, and buying volume has remained elevated since the turn of the year. What we do see however is a slightly bearish divergence in the SGU's RSI momentum indicator which may demonstrate that shares are due to undergo a temporary short-term pullback. Therefore, given SGU's bullish trend on strong volume numbers at present, we believe SGU is a buy at these levels where one could double down on a long position if indeed the stock's long-term support level is tested.
Star Group recently raised its quarterly dividend by 6.6% which means the company's forward yield now comes in at 4.9%. Suffice it to say, given the company's growth path (where year over year top-line sales have grown by 34%+) plus the conservative non-GAAP pay-out ratio of 56%, investors can buy shares at the current market price and reinvest proceeds of the dividends if indeed shares consolidate here over the next while.
Conclusion
To sum up, given how topline sales have been growing in SGU and how new account openings have been gaining traction, the market is finally beginning to price shares higher. Shares may consolidate over the near term but the long-term direction remains bullish. We look forward to continued coverage.
For further details see:
Star Group: Initial Innings Of Long-Term Bull May Be Commencing (Technical Analysis)