SCHQ - Start Listening To Janet Yellen: Fiscal Policy Is Now Calling The Shots For Risk Asset Prices
2024-01-15 06:44:12 ET
Summary
- Disconnect between Fed policy and risk asset prices will worsen from 2024.
- Growth of debt issuance has a significant impact on bond yields and stock market performance. Debt issuance is becoming a primary determinant of risk asset prices.
- There is a lot of debt issuance (and duration) growth up ahead. Not only that the nominal amount will grow, but the rate of growth of debt will also rise.
- We expect a Q1 2024 low point for stock markets, but offhand, massive debt issuance tells us that both risk asset prices AND the 10Yr Yield will rise for most of 2024.
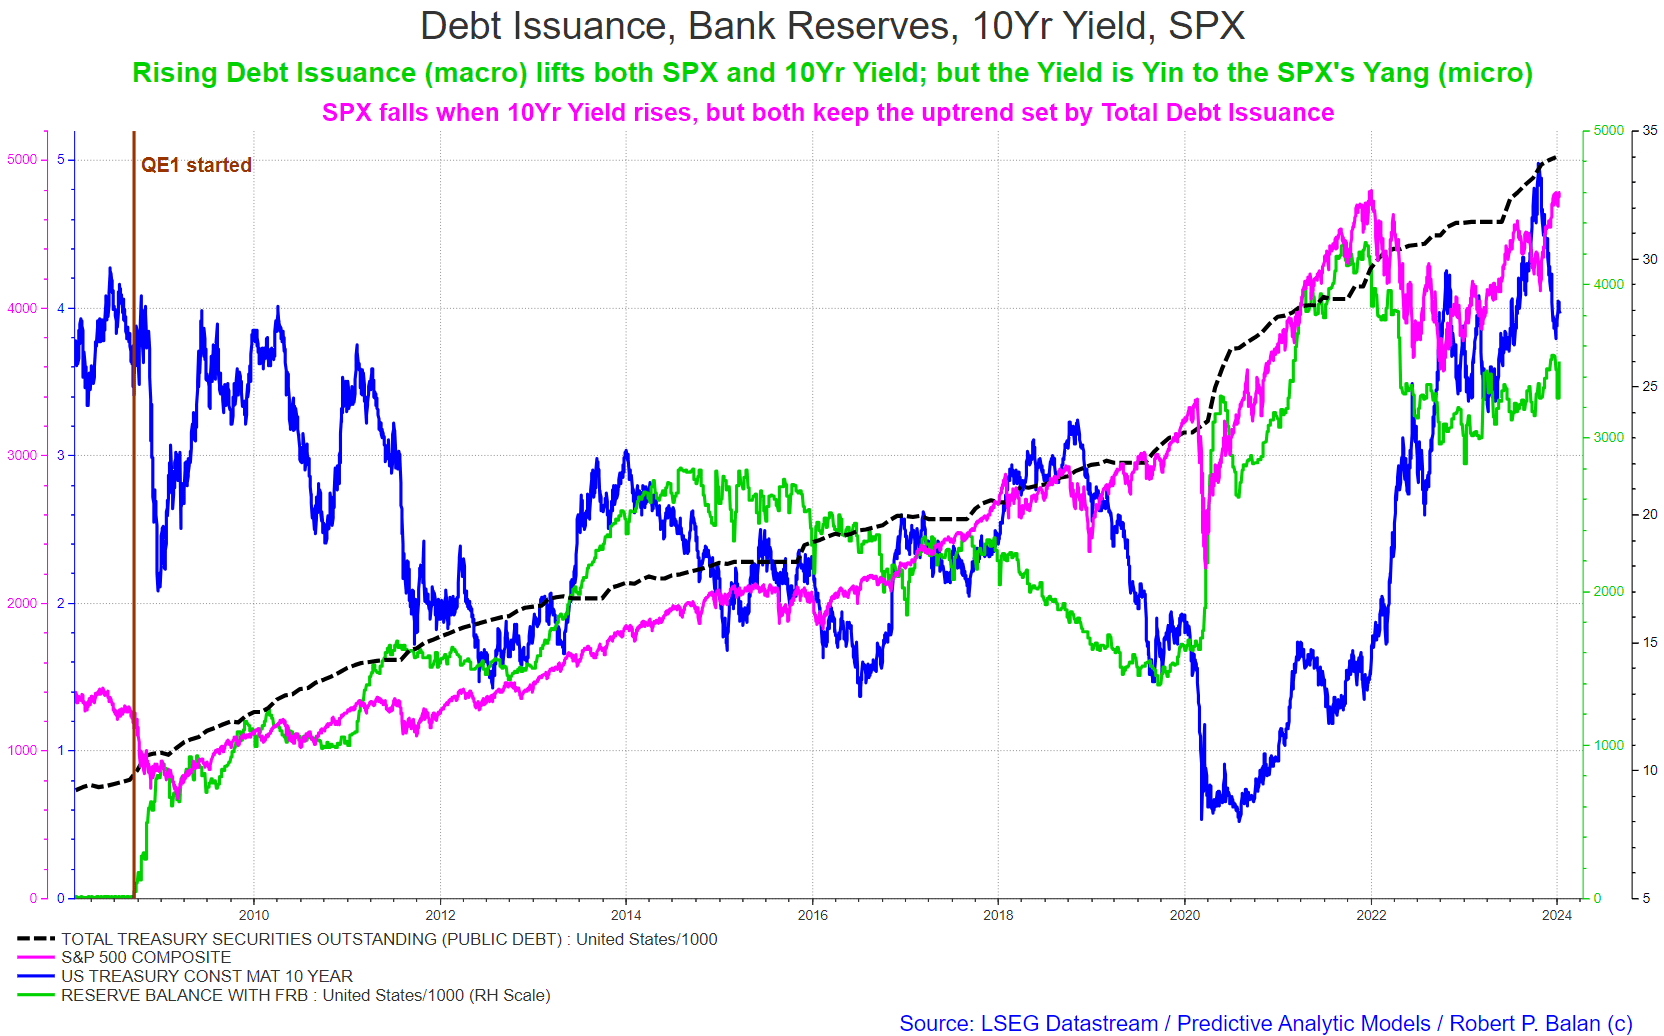
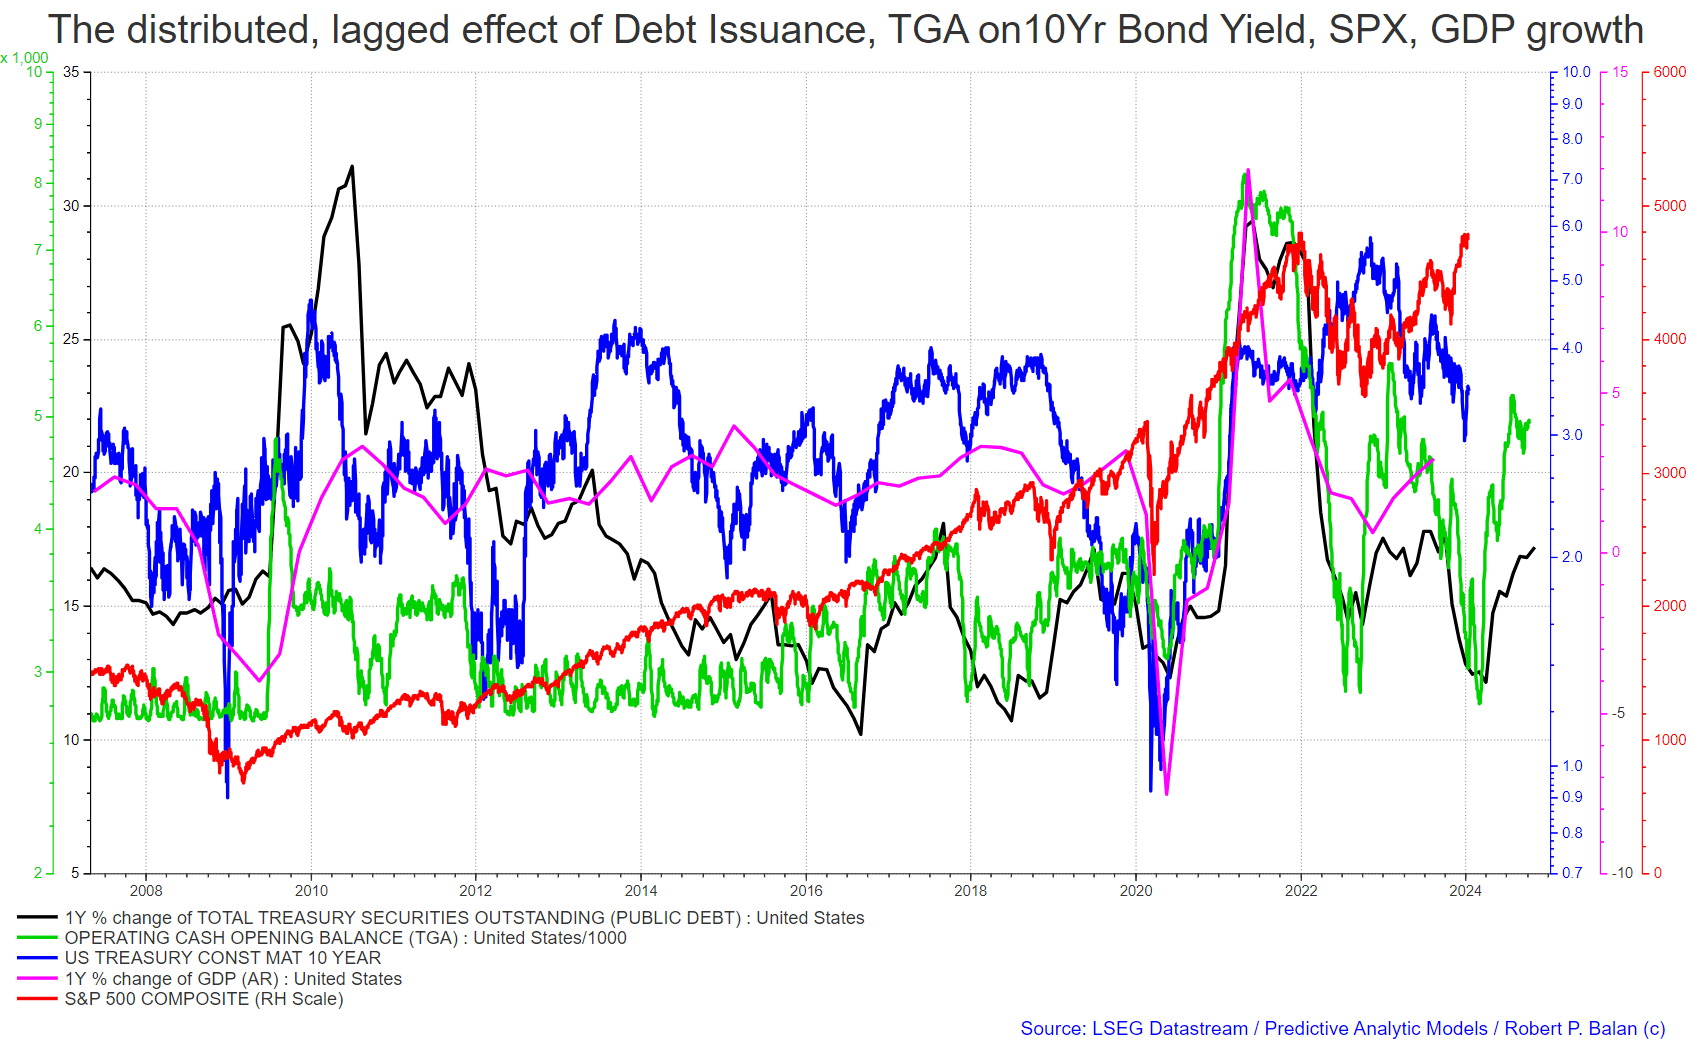
After more than a decade of equities (and other risk assets) traveling a straight road paved by falling interest rates and expanded Federal Reserve Bank's balance sheet, sharply rising yields and falling Fed Bank Reserves (driven by Quantitative Tightening) have driven a bumpy and winding road for risk asset prices over the past two years (see chart below).
A current disconnect between the Fed policy stance and risk assets
The asset prices' disconnect with the Fed's monetary policy is going to get worse as from 2024 -- we should now pay more attention to Ms. Janet Yellen's statements and her Quarterly Refunding Announcements. Fiscal policy is about to trump monetary policy as primary determinant of risk asset prices.
As the chart above illustrates, it used to be pretty simple after QE1 (and subsequent others) were launched -- interest rates fall, and stock markets will soar. But then something happened after March 2020 -- a new financial market paradigm arose. All previous financial variables' correlations have been upended. It turned out that massive liquidity flows eventually fall to the vagaries of non-linear fluid dynamics.
The period immediately after March 2020 was characterized by the Fed's massive money creation, as response to the sharp, negative impact on the economy, which was brought about by the COVID epidemic. The US stock market soared; and bond yields soared as well, as the US Treasury likewise went on a debt issuance binge.
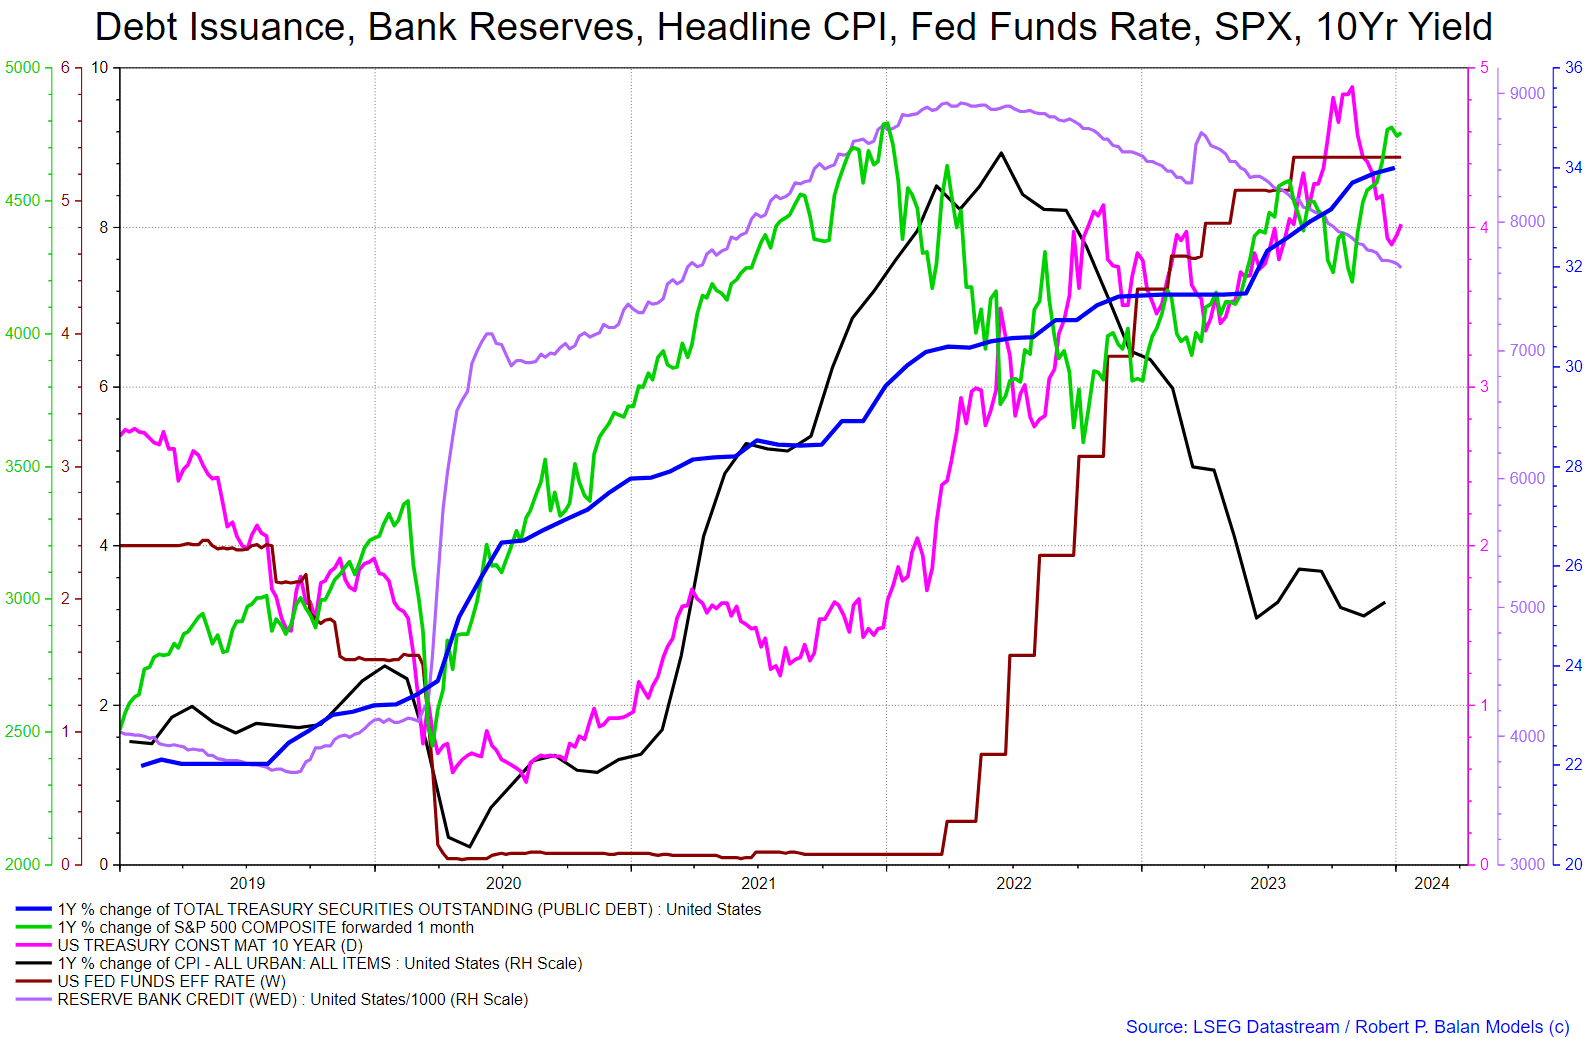
For the period from early 2020 until late 2021, the stock markets and bond yield were rising together. The bond yield rise was exacerbated further later by a sharp ratchet higher of monetary policy rates after consumer inflation started rising in tandem with the unprecedented money creation from both the Fed and the US Treasury. This helped foment the ensuing chaos between equity and bond markets.
A sharpening disconnect between Fed policy and US Treasury debt issuance
That positive correlation changed at the end of 2022, when the stock market peaked, as Debt Issuance rose significantly higher, well above multi-year trendlines and bond yields soared alongside. Since then, the stock markets (SPX as proxy) and bond yields (10Yr Yield as proxy) pursued inverse courses.
However, both the 10Yr Yield and the SPX follow the trend of nominal Debt Issuance higher, but flip over each other, Yin and Yang style, as the growth of Debt Issuance waxes and wanes (see chart below). There is a sharpening disconnect or divergence between the Fed's monetary policy and the Treasury's debt issuance guidance. As we explain later in the article, this is partly the reason for the inverse synchronization of the 10Yr Yield and SPX moves.
The nominal growth of Debt Issuance is almost monotonic at this point, but the growth of components of Debt Issuance do make a difference to the rise and fall of bond yields. And the rise and fall in bond yields have been a strong determinant of the fall and rise of the SPX, of late. The Yin-Yang correlation of the 10Yr Yield and the SPX is being reinforced every day. There is a reason for this, as explained below.
Change in growth of Debt Issuance is what matters to changes in risk asset valuations
We do have evidence that growth of Debt Issuance (and of the nominal amount of Debt) do have a positive effect on bond yields and the bond term premium. To us, debt issuance is the ultimate, bedrock liquidity source. The impact of Debt Issuance has macro (long term), and micro (short term) impacts, which we document at some length below.
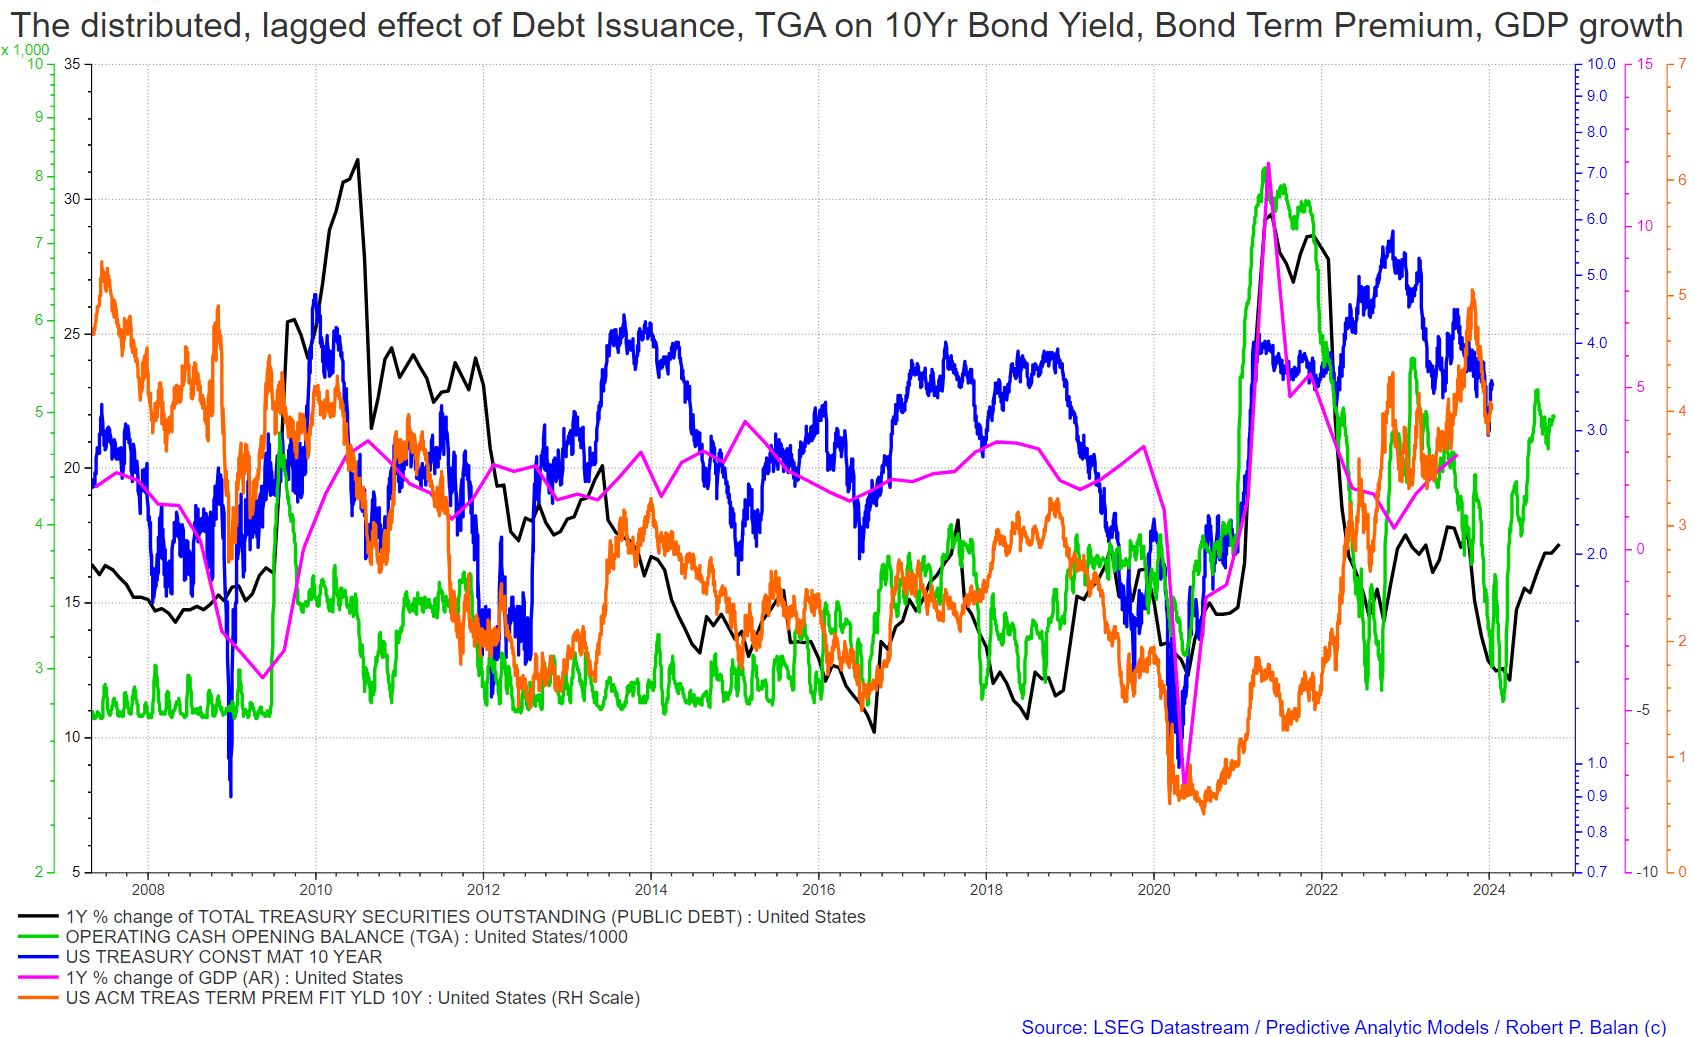
On the macro (long-term) side, the linkage runs through US GDP growth. Fiscal flows have positive, salubrious impact on GDP growth but the effect is normally lagged by about three quarters. And if that is the case, then 10yr bond yield and bond term premium should fall further during Q1 2024. Both bond yield and term premium is expected to rise during Q2 and part of Q3 (limit of the forecast horizon). See chart below.
If the lagged impact of Debt Issuance do run through GDP growth, then the same effect should be seen with regards to the SPX. That means that SPX should bottom sometime during Q1 2024 (probably in March), then should rise during Q2 and part of Q3 (again, the limit of the forecast horizon).
This is why the Yin-Yan relationship developed, and will likely persist
That background provided, we can now identify the exact causality of the 10Yr Yield's and SPX's continuing Yin-Yan relationship.
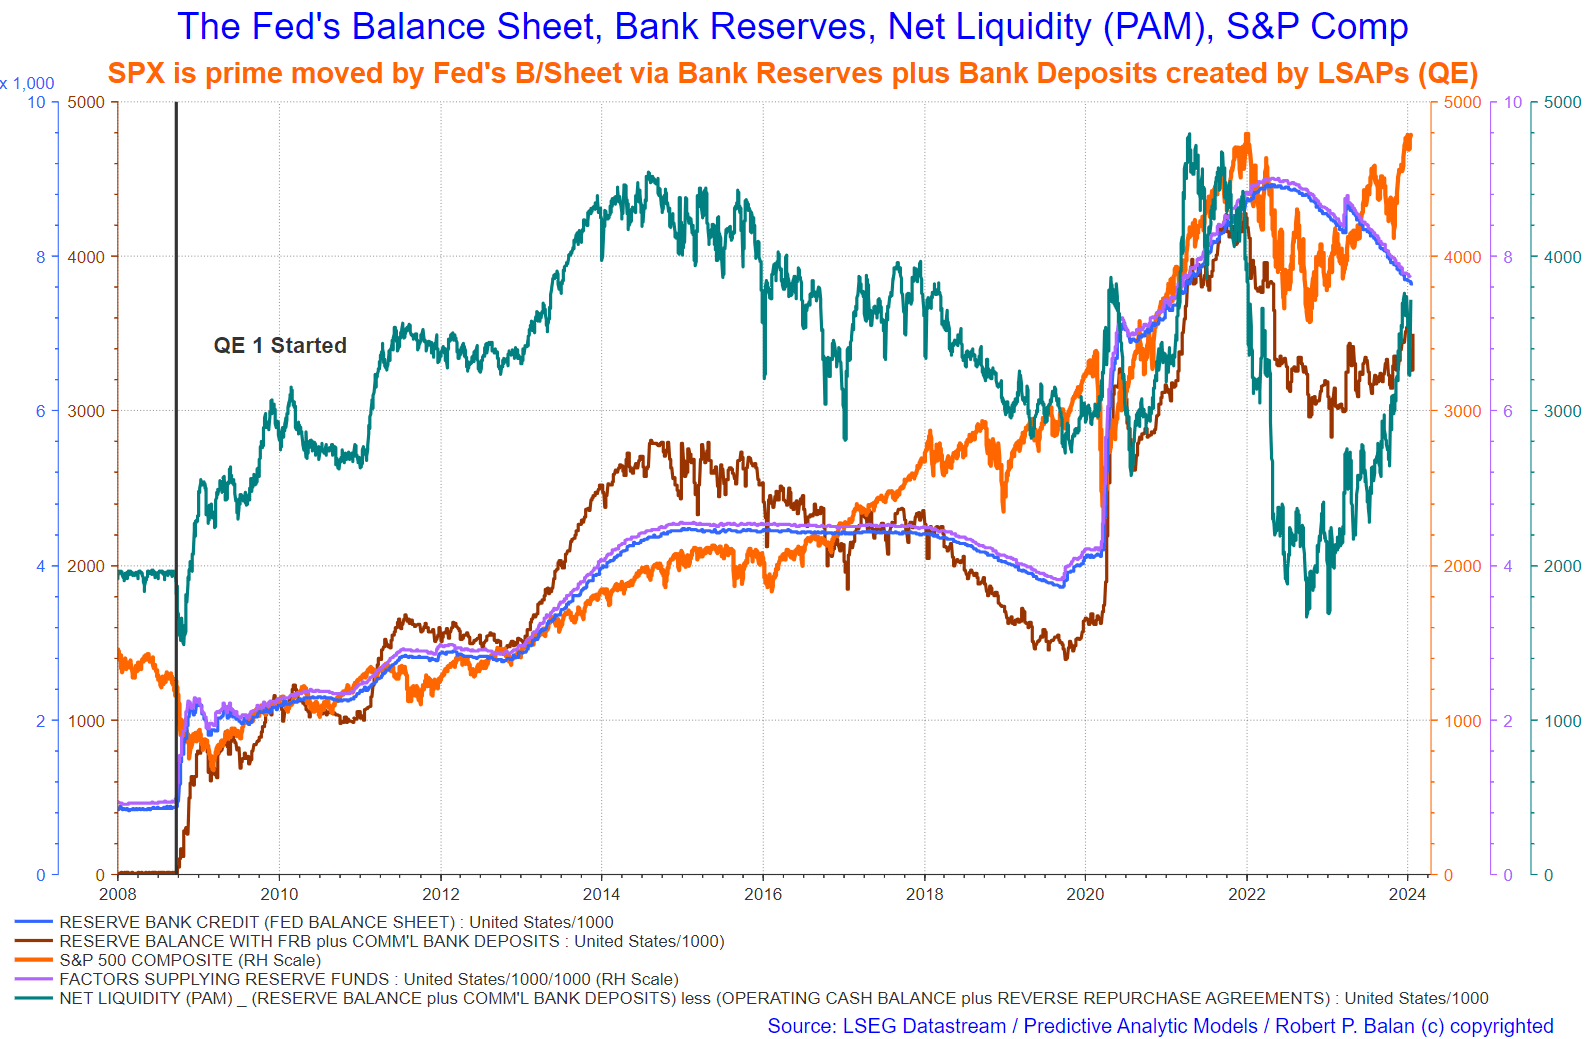
First, we identify the prime mover/s of the valuation of equities (SPX as proxy). After September 19, 2008, SPX started to be prime moved by Fed's Balance Sheet via Bank Reserves plus Bank Deposits which were created by several Large Scale Asset Purchases (LSAPS, QEs). The latest was on March 2, 2020, after the COVID epidemic paralyzed the global and US economy.
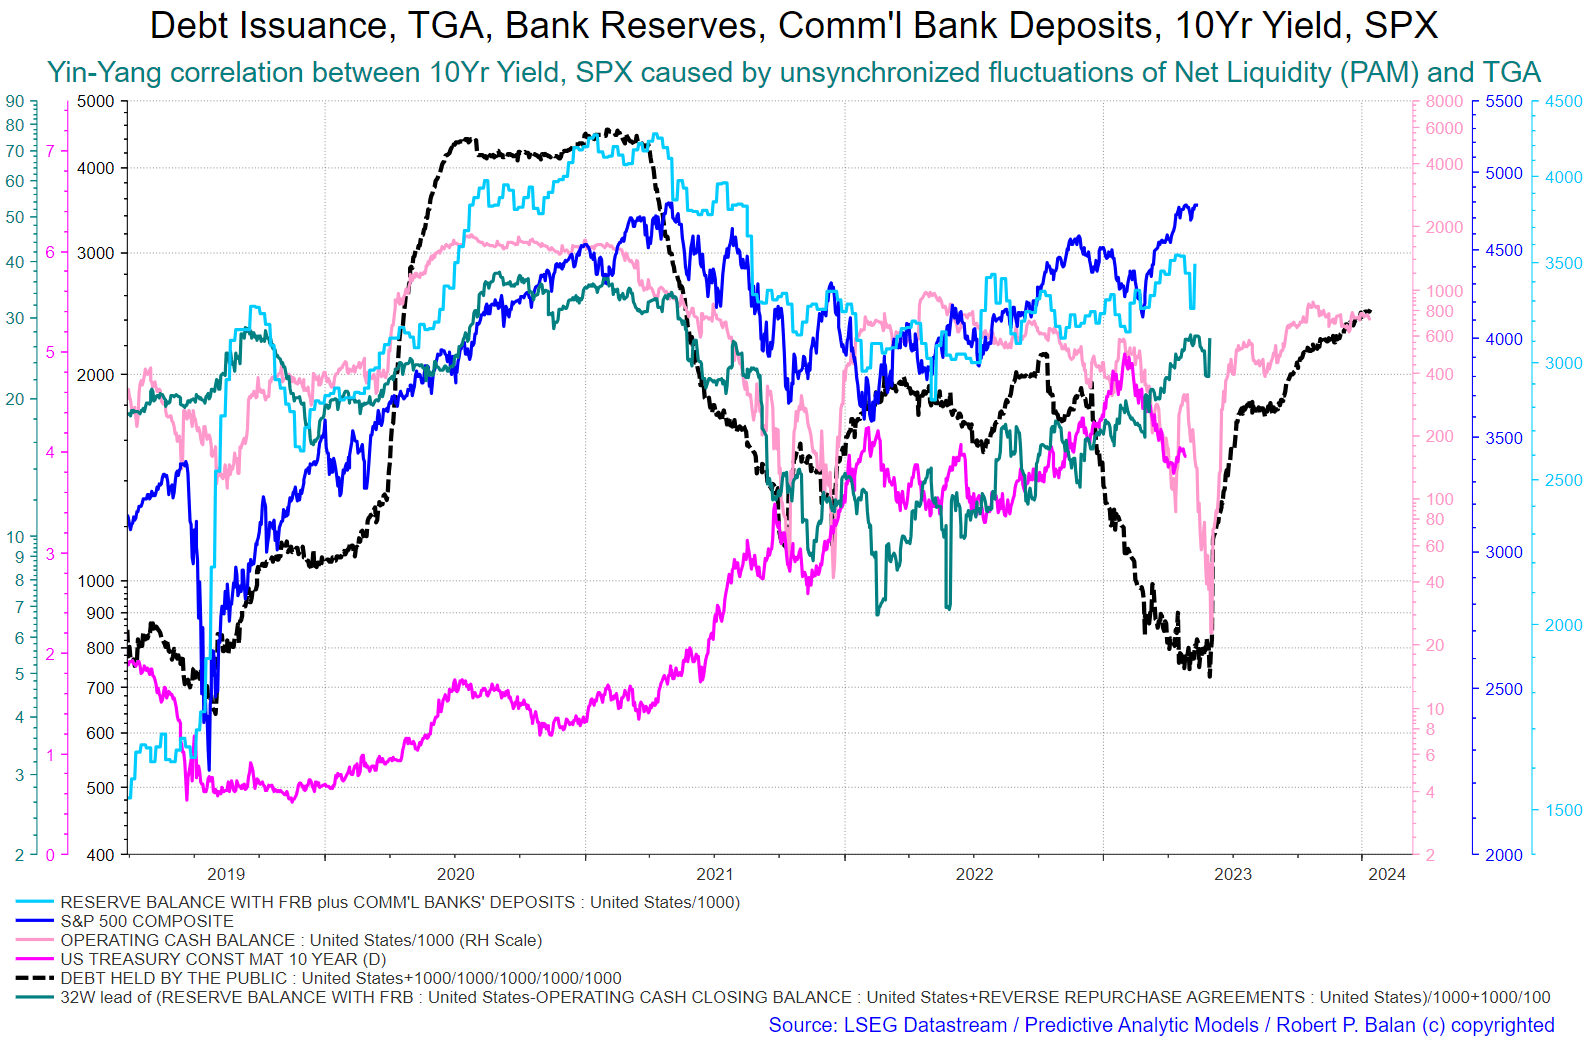
One useful tool is to look at Bank Reserve-centric flows in the form of Net Liquidity (PAM version), the sum of money creation done by the Fed (Bank Reserves and the corresponding Bank Deposits created) less the sum of O/N RRP stock and the TGA. This is fully illustrated in the chart below.
It is very worthy to note that our version of Net Liquidity (which includes the Commercial Bank Deposits which were created along with Bank Reserves after the Fed the LSAPs or QEs), has a very high Correlation Coefficient (R>2) with the SPX. It is 0.7 on a Least Squares Method regression analysis as from March 1, 2020, when the new monetary paradigm started (see chart below).
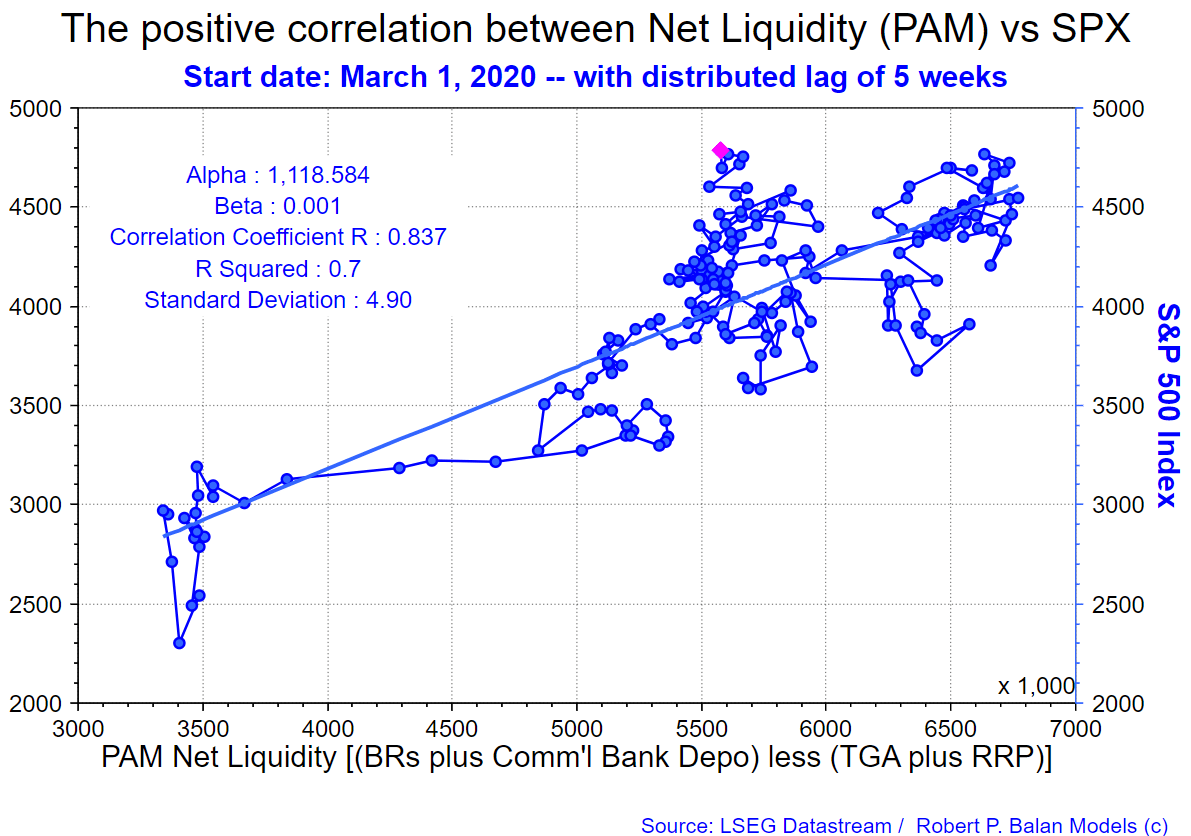
Net Liquidity ((PAM)) will provide an SPX tracking with higher R>2 of 0.7 against a simple Bank Reserve LSM's analysis yielding barely 0.5. The interpretation is that Net Liquidity ((PAM)) could explain 70 percent of the changes in the SPX since March 1, 2020 compared to the circa 50 percent efficacy of the study which used Bank Reserves as sole variable.
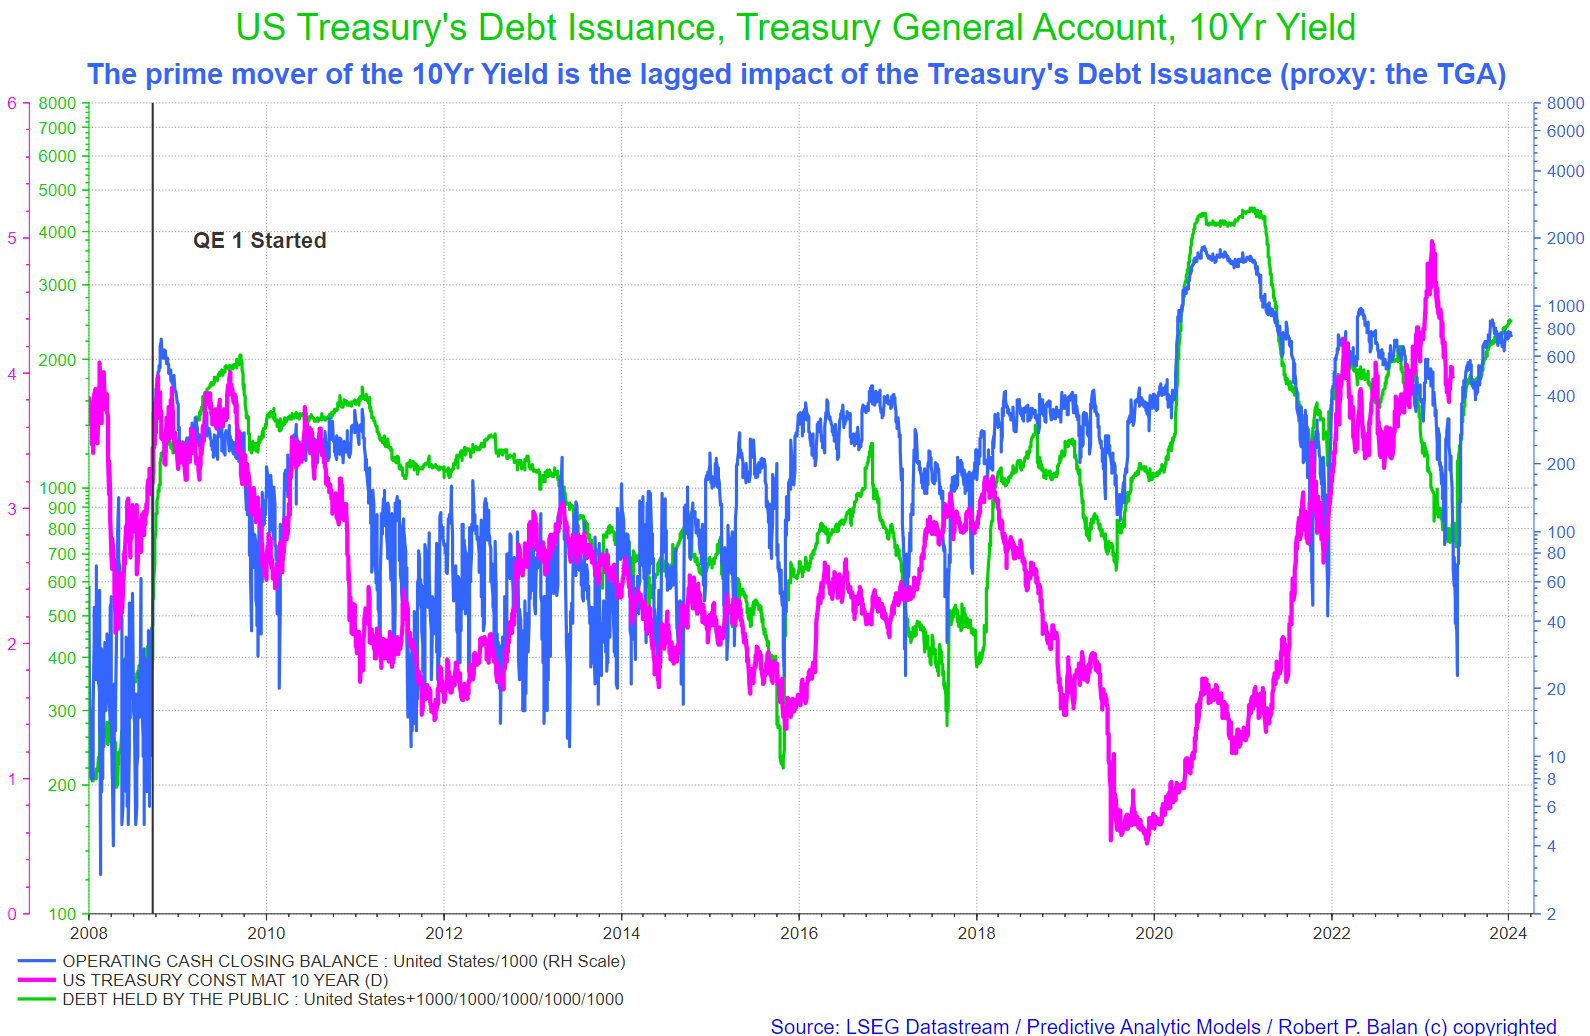
Second, we posit that the prime mover of the 10Yr Yield is the lagged impact of the US Treasury's Debt Issuance (and we use the Treasury General Account as proxy and confirmation).
As we showed in the two charts immediately above, debt issuance growth has a long lead over changes of the 10Yr Yield. Take note that the distributed lag is very variable, and so the lead time of issuance/TGA may need to be calibrated frequently, especially when we get to the daily yield/variable value changes.
Finally, we put all the prime moving variables and asset prices together, fully calibrated for a holistic view. It is clear (at least to us) that Yin-Yang correlation between 10Yr Yield, SPX is likely caused by unsynchronized fluctuations of Net Liquidity ((PAM)) and of the TGA.
That the 10Yr yield and SPX should move inversely is not a surprise at all, if we examine the relationship of their prime movers through an Asset-Liability lens (see graphics below). The causality flows from the fact that when the Treasury tops up the TGA, as it had done during most of H2 2023, Bank Reserves are mechanically expunged. Topping up the TGA requires prior debt issuance, and, as we illustrated in the previous charts above, TGA creation therefore causes the 10Yr Yield to rise (after a time lag). That also mechanically causes an SPX negative event because Bank Reserves as expunged on 1:1 ratio when the Treasury adds to the TGA stock.
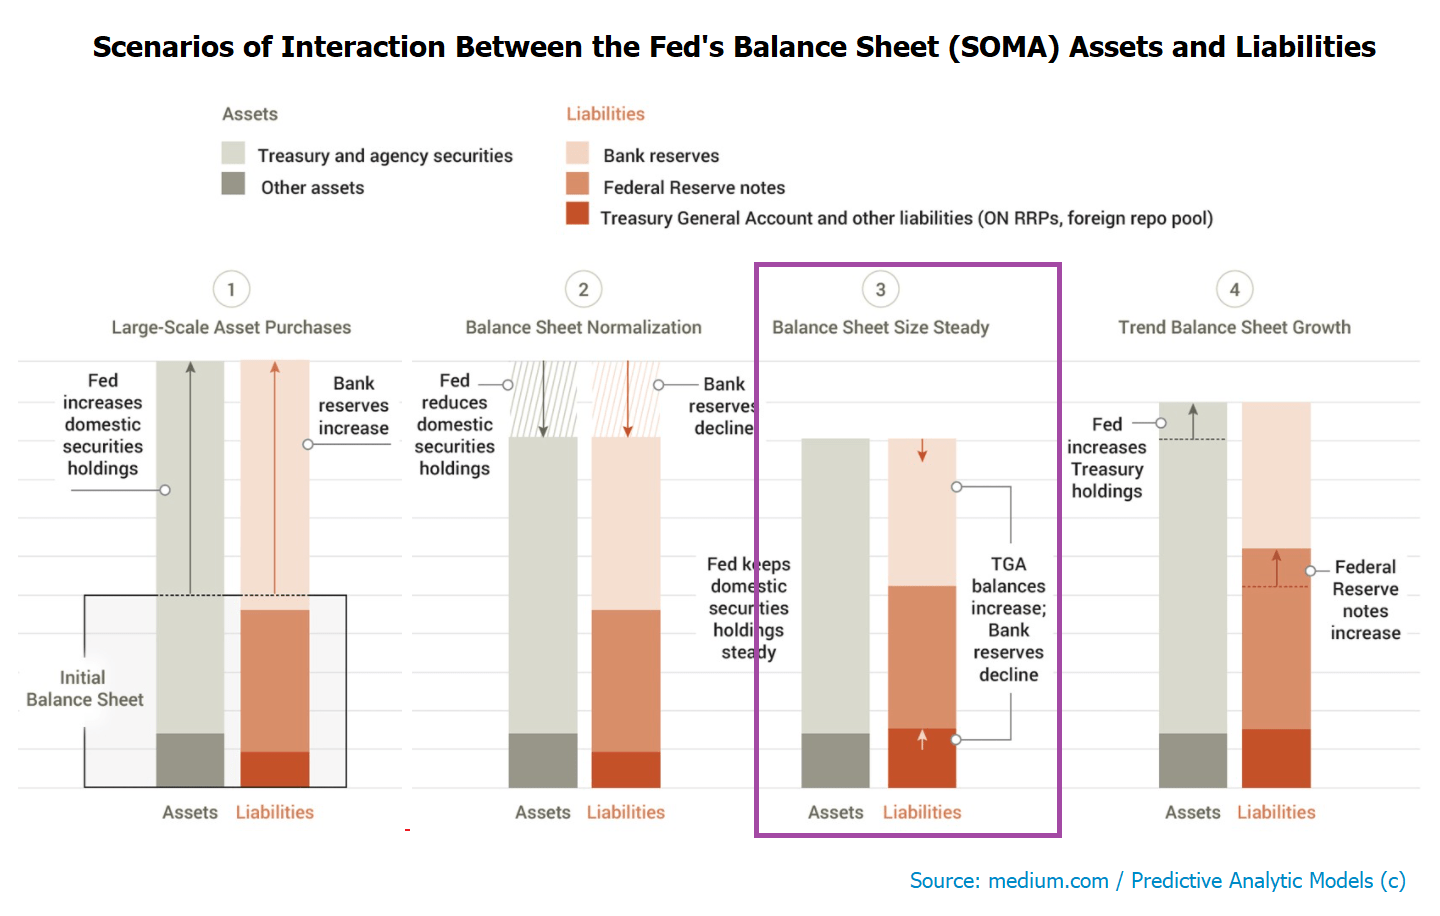
On the micro (short-term, high frequency) side, Debt Issuance growth has a profound, but lagged impact on 10Yr Yield, SPX, and on the PAM version of Net Liquidity on day to day. If the analytical construct is properly populated (has to be composed of several disparate variables) and correctly and frequently calibrated, issuance growth can be a very useful tool in calling likely trends in the 10Yr Yield, the SPX, and VIX Index several days ahead. See chart below.
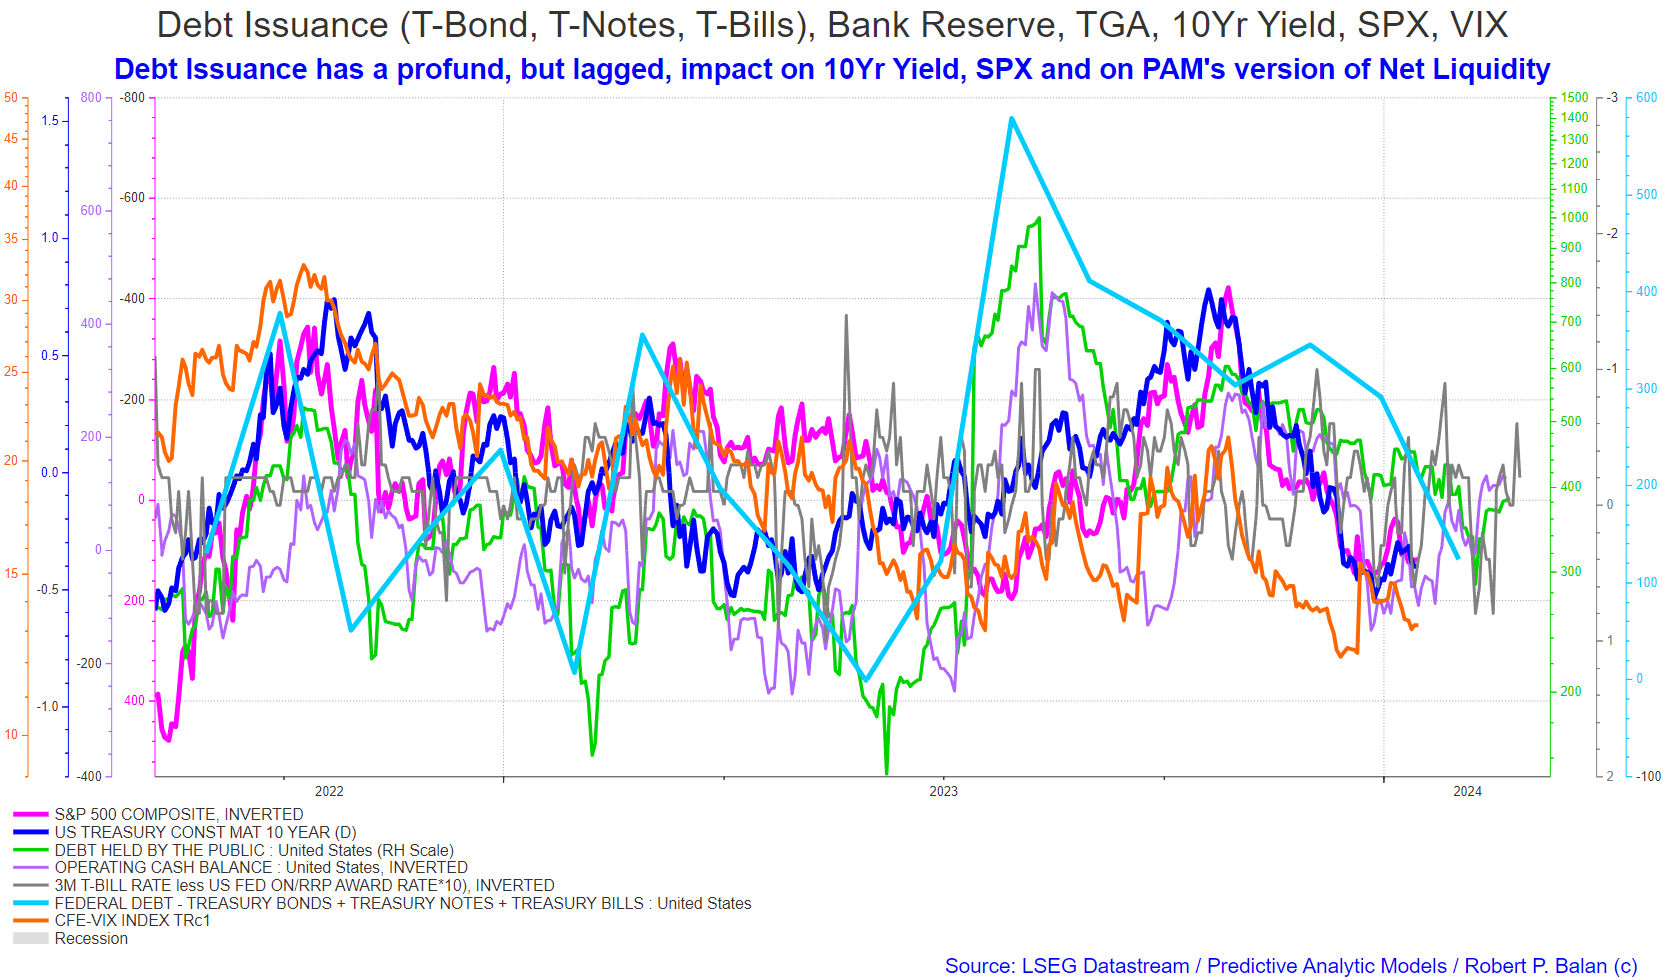
This is one primary diffusion tool which has enabled our community to perform well in both bond and equity trades (as well as in gold trades). Our community has used systemic liquidity flows since early 2018 as an analytical tool. I was one of the earliest proponents of using those variables to determine future valuation of risk assets. My articles on systemic liquidity flows are in the archives of Seeking Alpha.
So what happens next?
Bank of America's forecast for Treasury bond issuance in February 2024 has been revised upward to a record $1.34 trillion in 10-year equivalents, an increase of $90 billion from earlier predictions. The revisions come as rising interest rates are expected to intensify US deficits and impact deficit spending, leading to a larger UST issuance and a spiral effect due to increased financing costs.
Bank of America also projects the fiscal year 2023 deficit to rise from $1.8 trillion in 2024 to $2 trillion by 2026, while net interest payments are anticipated to constitute a record 3.5% of GDP in 2026.
As a result, the Treasury Department is likely to continue issuing debt, further expanding the already sizeable $25.8 trillion market. The ex-Fed 10-year bond supply is anticipated to reach a record $1.53 trillion in 2024 due to quantitative tightening.
There is a lot of Debt Issuance (and Duration) growth ahead of us
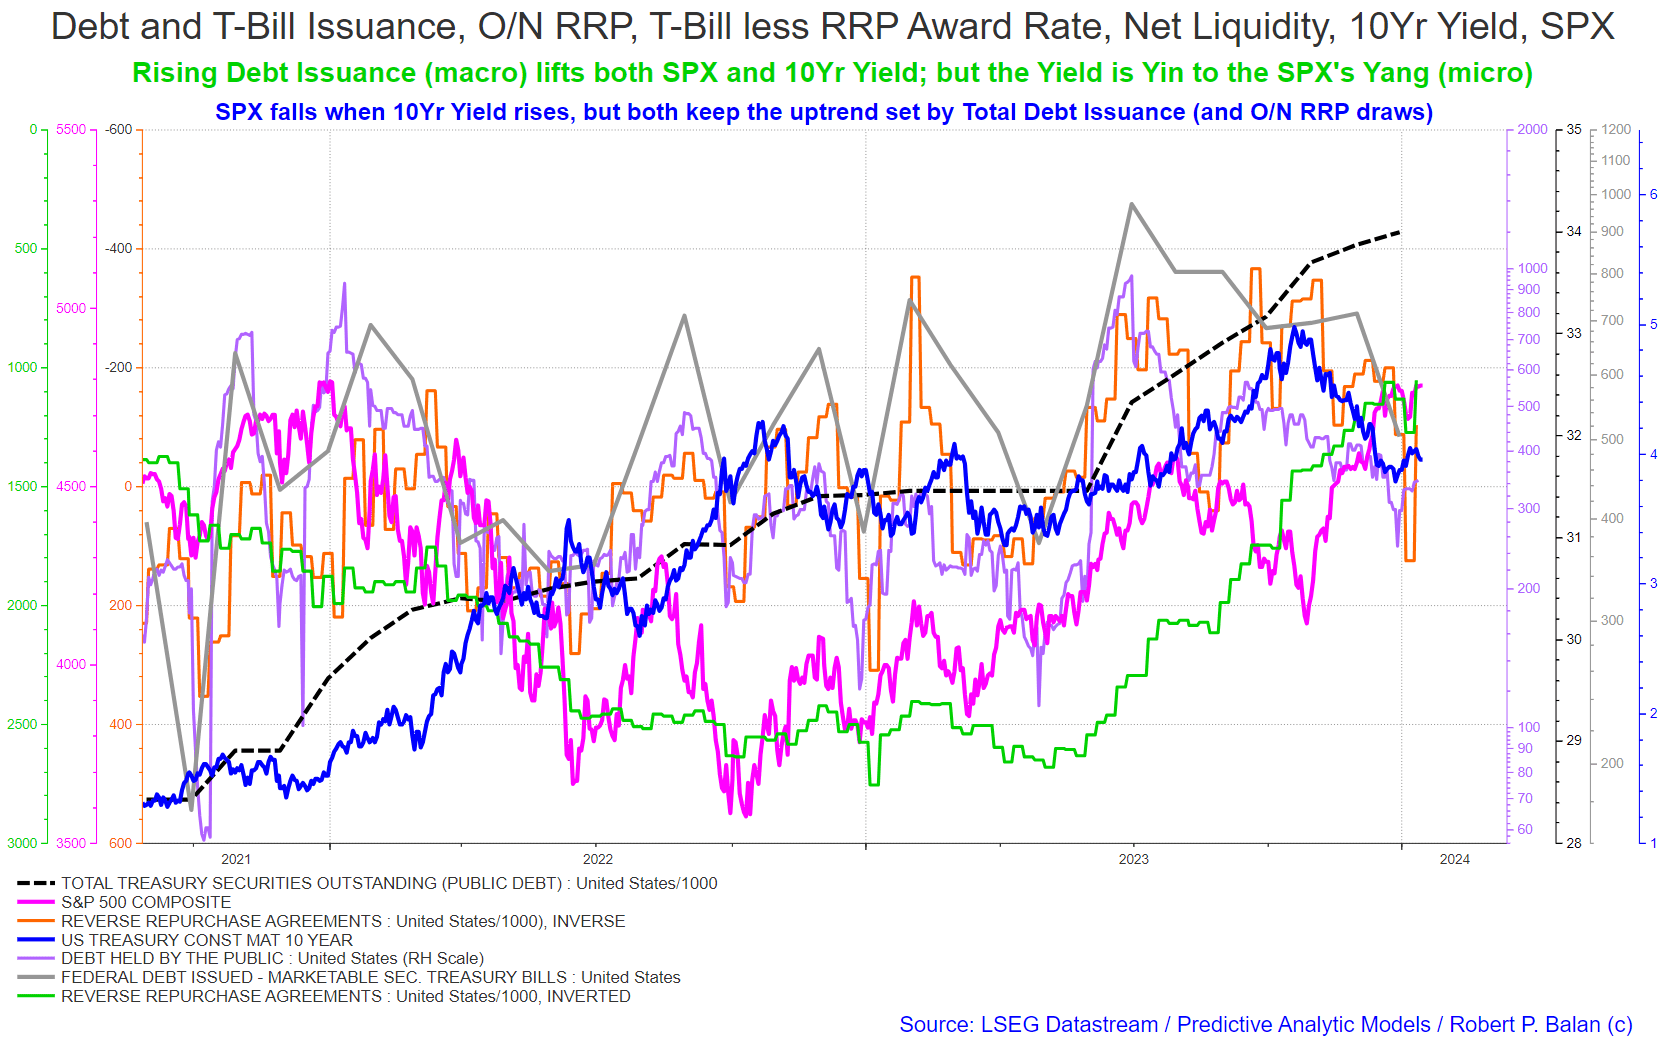
That is a lot of debt issuance (and duration) growth up ahead. Not only that the nominal amount will grow, but the rate of growth of debt will also rise sharply. The US Treasury will also start issuing more Treasury Bonds and Notes, and has already signaled its intention to sell securities with longer duration, with the latest Quarterly Refunding Announcement (QRA). These future developments tells us that risk assets prices AND the 10Yr Yield will rise for most of 2024. We illustrate that with the chart below.
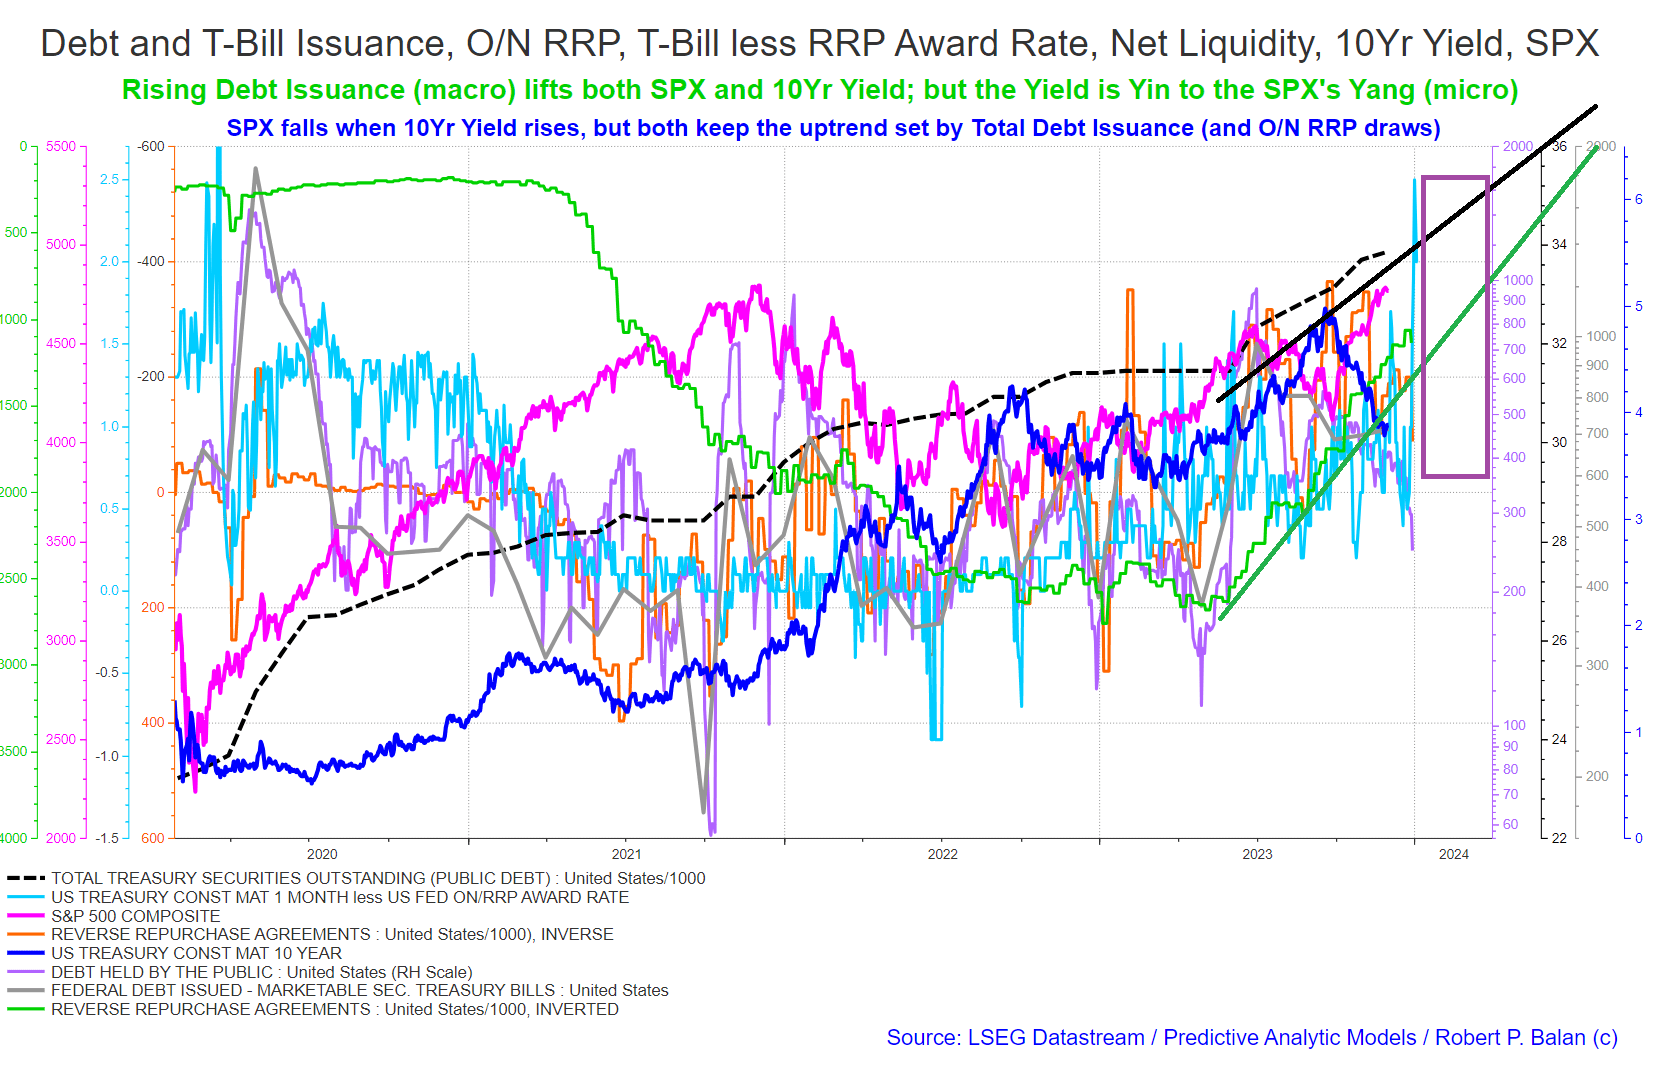
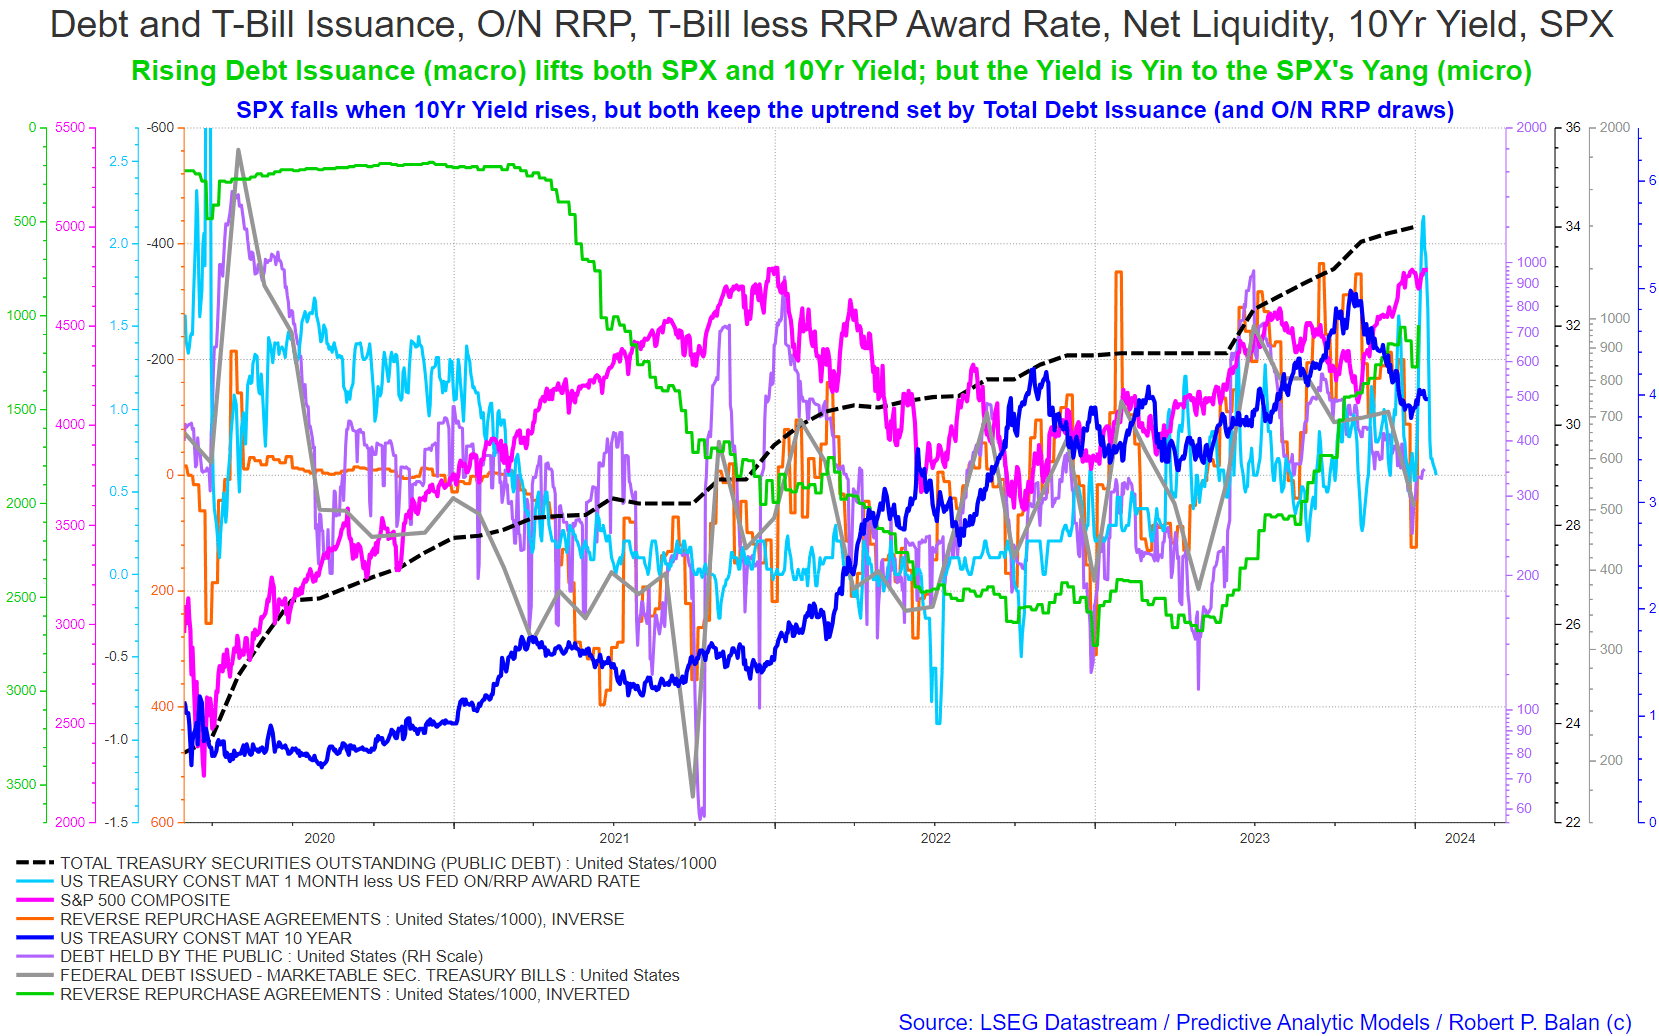
Rising Debt Issuance (macro) lifts both SPX and 10Yr Yield; but the Yield is Yin to the SPX's Yang (micro). SPX falls when 10Yr Yield rises, but both keep the uptrend set by Total Debt Issuance (solid black line) and by continuing O/N RRP draws (solid green line).
We expect the RRP facility to continue financing the Treasury's sale of securities, until it is drawn to zero, probably sometime during Q2 2024. The net impact of this RRP facility behavior is to delay the decline of Bank Reserves (which is being mechanically diminished by the Fed's Quantitative Tightening). This keeps underlying support for equities, as well as help moderate the 10Yr Yield's rise.
Nonetheless, we believe that the SPX will probably fall during late Q1 2024 (purple rectangle, chart above) while the 10Yr Yield will rise in synchronization. The SPX and the Yield will probably intersect at circa 4.3 pct as reckoned via the 10Yr Yield. Both SPX and the 10Yr Yield should rise as from Q2 2024, and should do so for most of the year. (Chart and text taken from a PAM post on Jan 1, 2024).
This is how the chart above looks today
We do post updates at the PAM blog (delayed 24 hours), which expound our analyses used during the previous day, and we also post our trades which were completed the day before (to fulfill Seeking Alpha's requirements for transparency). I invite you to visit us there.
For further details see:
Start Listening To Janet Yellen: Fiscal Policy Is Now Calling The Shots For Risk Asset Prices