STZHF - Stelco: The Benefits From High Steel Prices Are Likely Over
2023-04-18 15:18:52 ET
Summary
- Stelco has had a good run over the past few years but this is due to the tailwind from high steel prices. When steel prices decline, Stelco's performance will likely decline.
- Stelco serves the steel sector whose prices are cyclical. Any valuation of Stelco on a long-term perspective should be based on its performance over the cycle.
- But Stelco's performance is also dependent on its shipment volume. To address both, I developed a financial model with both shipment tonnage and Hot Roll steel prices as inputs.
- Using this model and based on its value over the cycle, there is no margin of safety at the current price.
Investment Thesis
Stelco Holdings Inc. ( STZHF ) (Stelco) serves the steel sector whose prices are cyclical, and so an analysis and valuation of Stelco from a long-term perspective should be based on its performance over the steel price cycle.
At the same time, steel-making is a capital-intensive business with high fixed costs. Any changes in shipment volume would also impact its performance.
I developed a financial model linking steel prices and shipment tonnage to Operating Profits. Linking this to my valuation model, I found that there is no margin of safety based on its cyclical performance.
Thus I believe there is no investment opportunity in Stelco, even though the company is financially strong.
Thrust of my analysis
In my Sep 2022 article, I valued Stelco to be between CAD 42 per share to CAD 54 per share. Refer to “ Stelco Holdings: Grossly under-priced cyclical growth company ”. At that juncture, Stelco’s market price was CAD 38 per share.
The market price of Stelco is today CAD 49 per share (14 Apr 2023). Is there still a margin of safety?
To answer the question, I looked at Stelco’s business from a different perspective from what I did in Sep 2022. At that juncture, the lower value was based on assuming that the 2018 to 2020 performance represented its cyclical one. More importantly, I assumed that the changes in performance were just due to changes in steel prices.
But steel production is a capital-intensive business with high fixed costs. Changes in the shipment (production) volume will also have an impact on performance.
A more realistic picture would be to consider both the changes in shipment volume (tonnage) and steel prices. This is the focus of this article.
To account for both shipment volume and steel prices, I developed a financial model linking these 2 parameters to profits. I then used this as the basis to estimate the value of Stelco over the Hot Roll steel price cycle. I used the US Hot Roll steel prices (based on FRED) as the reference price in my analysis.
Based on this approach, I found that there is no margin of safety at the current market price.
Performance
Stelco is a Canadian integrated steel manufacturer that IPO'd in 2017. Its products include flat-rolled valued-added steel, coated pre-painted cold-rolled and hot-rolled sheet products. In 2022, hot-rolled steel accounted for 72% of the total shipments.
Since its IPO, Stelco has had a good run as illustrated in Chart 1.
- Revenue had grown by 34.5% CAGR.
- It went from a loss in 2017 to generating CAD 997 million of net income in 2022.
- Gross profitability also showed tremendous improvements.
But you can see from Chart 1 that a significant portion of this growth came from the last 2 years.
Chart 1: Performance (Author)
Notes to Chart 1:
a) Stelco IPO in 2017 with 6 months results. The 2017 performance indices were thus extrapolated for the full year.
b) The index for each metric was based on dividing the value for each year by the respective 2017 value.
But this growth was driven by price growth. You should not be surprised by this as Hot Roll steel prices grew at a 10.9% CAGR during this period. In terms of physical shipments, Stelco shipped 2.6 million tons of products in 2022 compared to 2.0 million in 2017. This was equal to a 5.6% CAGR.
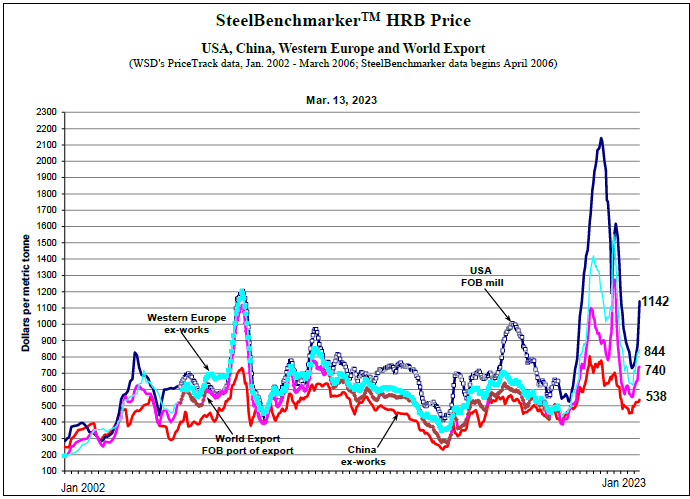
The Hot Roll steel prices for the past 2 years were extraordinarily higher than those before 2020. Refer to Chart 2. Looking at this chart, you can see that there is a long history of lower steel prices (relative to the past 2 years).
It is obvious looking at Charts 1 and 2 that Stelco’s good performance over the past few years was due to the tailwinds from the high steel prices. But prices are cyclical. The question then is how Stelco would perform if the long-term steel prices follow the pre-2020 pattern.
In my previous article, I had shown that Stelco is a cyclical company. From 2015 to 2022 there is a 0.96 correlation between Stelco revenue and the Hot Roll steel prices. I will not belabor this point except to point out the impact of this on financial risk and valuation.
Chart 2: Hot Roll steel price trends (Steelbenchmarker)
Financial strengths
As a cyclical company, the performance of Stelco will eventually decline following any decline in the steel prices. We do not know when or how long the downtrend leg of the next cycle will be. But we want companies to be financially sound to withstand any prolonged downtrend.
In this context, I rate Stelco as financially strong based on the following:
- As of the end Dec 2022, it has CAD 810 million of cash. This is about 26 % of the total assets.
- It has a Debt Equity ratio of 0.6 as of the end of Dec 2022. But this was only because it returned about CAD 1 billion to shareholders in 2022 in terms of share buybacks and dividends. Without these, the Debt Equity ratio would be about 0.35.
- Since its IPO in 2017, there was only one year (in 2017 itself) when it incurred negative Cash Flow from Operations. Cumulatively from 2017 to 2022, it generated CAD 2.6 billion in Cash Flow from Operations. This is significant considering that its average total assets over this period amounted to CAD 2.1 billion.
- If its Debt was rated, I believe it would have a triple A rating. This was based on Damodaran synthetic rating approach using the average past 6 years’ interest coverage ratio.
Valuation of cyclical companies
Damodaran has this to say about valuing cyclical companies:
Cyclical and commodity companies share a common feature, insofar as their value is often more dependent on the movement of a macro variable (the commodity price or the growth in the underlying economy) then it is on firm-specific characteristics…the biggest problem we face in valuing companies tied to either is that the earnings and cash flows reported in the most recent year are a function of where we are in the cycle, and extrapolating those numbers into the future can result in serious misvaluation.
To overcome the cyclical issue, we have to normalize the performance over the cycle. The challenge for Stelco is that steel production is a capital-intensive business with high fixed costs. Any changes in shipment volume will also have a significant impact on its profits.
Table 1 illustrates what I mean. You can see that over the past 8 years, there were different combinations of shipment and Hot Roll steel prices. You can see that from 2015 to 2017 and 2019, the Hot Roll steel prices for each year were about the same. But the shipment tonnage varied and this impacted the Operating Income.
A more realistic picture of Stelco has to account for both shipment and steel prices. To do this, I developed a financial model of Stelco where the operating profits were tied to both shipment tonnage and Hot Roll steel prices.
Table 1: Past 8 years operating parameters (Author)
Note to Table 1: Stelco IPO in 2017 with half-year results. The 2017 operating income was extrapolated to the full year.
Financial model
My financial model was based on the data shown in Table 1. I used EXCEL to establish a linear multiple regression equation linking operating profits (EBIT) with shipment tonnage and Hot Roll steel price per ton.
This equation as shown below had a 0.98 R square. This meant that 98% of the variance in the EBIT is explained by the variances in shipment tonnage and Hot Roll steel prices. It is very significant.
EBIT = (0.14 X Shipment) + (1.86 X Hot Roll Steel Price) – 1427.72.
To validate the model, I tested the projected results with the actual operating profits for the past 5 years as shown in Table 2. I have also tabulated the difference between the projected profits and the actual profits. You can see that it varied from about +- 40%. If I use this model to determine the intrinsic value, I should look for a 40% margin of safety.
Table 2: Validating the financial model (Author)
Notes to Table 2.
a) Actual shipment for the year.
b) Hot Roll Steel prices as per FRED.
c) EBIT as projected by the model.
d) Actual Operating profit.
e) Difference = Sqrt [ (c - d) ^ 2] / average of (c and d).
Valuation of Stelco
I valued Stelco based on the single-stage Free Cash Flow to the Firm (FCFF) model:
Value of operating assets = FCFF X (1+ g) / (WACC – g).
Where:
FCFF = EBIT X (1 – t) X (1 – Reinvestment Rate).
EBIT = operating profit that is linked to the shipment tonnage and Hot Roll steel price as per my financial model.
g = growth rate. I set this to the long-term US GDP growth rate of 4%. The growth rate is based on the fundamental growth rate = Return X Reinvestment Rate where:
Return = EBIT(1 -t) / TCE.
TCE = Total Capital Employed = Total Equity + Total Debt – Cash.
Reinvestment Rate = g / [ EBIT(1 – t) / TCE ].
WACC = weight average cost of capital. This was derived based on the first page results of a Google search for the term “Stelco WACC” as summarized in Table 3. I took the average values for my valuation.
Table 3: WACC (Various sources)
t = tax rate. I assumed a nominal rate of 24%.
Value of the firm = Value of operating assets + Cash + Excess TCE.
I often find that the cyclical TCE is less than the actual TCE. I interpret this to mean that there is excess capital over what is required for the business. This excess can be returned to shareholders. Refer to Notes n in Table 4.
Value of equity = Value of firm – Minority Interests – Total Debt.
The valuation of Stelco is illustrated in Table 4.
Table 4: Computing the intrinsic value (Author)
I used the valuation model to look at several scenarios and focused on 3 as shown in Table 5.
- Optimistic one based on the average 2021 and 2022 shipment tonnage and average 2015 to 2022 Hot Roll steel prices.
- Pessimistic one where the steel prices excluded the extraordinarily high prices of the past 2 years. I still based this on the average 2021 and 2022 shipment tonnage.
- Expected scenario where the steel prices were based on 95% of 2015 to 2020 ones and 5 % of the past two years. This was the same pricing formula I used in my Sep 2022 analysis. I still based this on the average 2021 and 2022 shipment tonnage.
Table 5: Summary of valuation (Author)
The green highlights show the cases where the intrinsic value exceeded the market price. You can see that there is some margin of safety only for the Earnings Value with growth under the Optimistic scenario.
The value of Stelco would depend on how you view the long-term Hot Roll steel price.
Some analysts think that steel prices in the future in North America would be higher than in the past. This is because of the Biden Administration's Infrastructure Bill and the continuation of the trade tariffs. However, if you look at Chart 2, you can see close linkages between steel prices around the world.
There is currently excess global steel-making capacity.
“The industry has been in a serious excess capacity crisis for more than a decade… with the capacity-demand reaching 568 million metric tons in 2020…” Global Forum on Excess Capacity.
This will mean that prices will revert to the historical low once the supply chain problems and low economic growths due to Covid-19 are behind us. As such I am more likely to follow the Expected scenario.
To match the market price, Stelco would have to ship 3.3 million tons at the Expected scenario price. This tonnage is 10% higher than the current shipment capacity.
You can understand why I think Stelco is overpriced.
Risks and limitations
You should consider the following risks and limitations when looking at my valuations:
- Small sample size.
- High WACC.
- Potential improvements excluded.
- Higher shipments not considered.
My financial model drives the valuation. I only had 8 sets of data points to derive the regression equation. I was surprised by the high correlation and I suspect that with more data points, the correlation would drop. But I would have preferred an equation derived from more data points.
Related to this is the error (Differences as per Table 2) when validating my model. In other words, I should be looking for a 40% margin of safety. But we don’t have this even under the Optimistic Earnings with growth case.
The WACC was based on the current situation of high inflation with the prospect of a recession. We also have the Ukraine invasion. This meant higher risk-free rates and higher equity risk premiums compared to the values over the cycle. Thus my valuation is likely on the conservative side. If you want more details on the impact of a cyclical cost of capital, refer to my blog post "Base rates for US cyclical companies."
My valuation have not considered any improvements that would come from the various plans that Stelco has to improve profitability. This includes the benefits of lower energy costs from the Cogen initiative as well as the plans to produce more advanced steel grades.
At the same time, Stelco has a 3 million tons shipment capacity. In my analysis, I have only assumed that it shipped about 88% of this.
But can I achieve a 40% margin of safety taking all the above into account? I don't think so.
Conclusion
Stelco serves the steel sector whose prices are cyclical. As such and valuation of Stelco’s from a long-term perspective should be based on its performance over the cycle.
There are 2 steel price challenges for Stelco:
- High steel prices will eventually decline. When this happens, I expect Stelco’s performance to decline as well.
- The past two years of steel prices were extraordinarily high. Given the global excess steel-making capacity, I would expect that in the long term, steel prices would revert to the pre-2020 average. This average is much lower than those of the past 2 years.
To address the former, I looked at the performance over the cycle. To address the latter, I used a conservative price estimate.
The crux of my analysis is that Stelco’s performance is not just dependent on steel prices but also on its shipment tonnage. To see the impact of both shipment and steel prices, I developed a financial model. Linking this to my valuation model, I found that there is no margin of safety.
I am a long-term value investor holding stocks for 6 to 8 years. My analysis and valuation is based on this perspective.
If you invest in Stelco currently, it must be because you believe that steel prices will be much higher than what it was in the past. Or you believe that Stelco can ship more that its current shipment capacity. I think these are stretching things a bit.
For further details see:
Stelco: The Benefits From High Steel Prices Are Likely Over