FSI - Stepan Company: Expect Outperformance To Continue
Summary
- Stepan Company has had a nice run in recent months, with shares pushed higher by strong sales and growing profits.
- There is no clear end in sight for this trend and shares of the business look cheap for the most part.
- This all points to further upside from this point, which could prove great for long-term investors.
Many people don't realize this, but the fact of the matter is that chemicals have a significant role to play in our everyday lives. They go into practically everything that we produce and consume in some way, shape, or form. So naturally, it should stand to reason that there would be companies that would develop that would do well by creating their own chemical compounds. One example of this can be seen by looking at Stepan Company ( SCL ), an enterprise that produces surfactants, polymers, and other specialty products such as those found in food and flavoring. Recently, the company has done incredibly well, especially given the uncertain environment that we are in. Sales and profits continue to rise nicely, while cash flows follow suit. Because of this, shares of the company have outperformed the broader market. Even with this upside, however, shares do look rather cheap on an absolute basis as well as slightly cheap relative to similar firms. So even though I do believe that the easy money has been made regarding the business, I would make the case that shares offer further upside potential from here.
Robust performance continues
Back in April of this last year, I wrote a rather bullish thesis on Stepan Company. In that article , I talked about how the company's shares had exhibited some downside in the prior few months. This was driven largely by a broader market decline and by some margin compression the company had exhibited. Even with that pain though, I felt as though the company offered enough upside to warrant a 'buy' rating, a rating that demonstrates my belief that shares should outperform the broader market moving forward. Since the publication of that article, the company has achieved precisely that. While the S&P 500 is down 13%, shares have generated upside for investors of 9.4%.
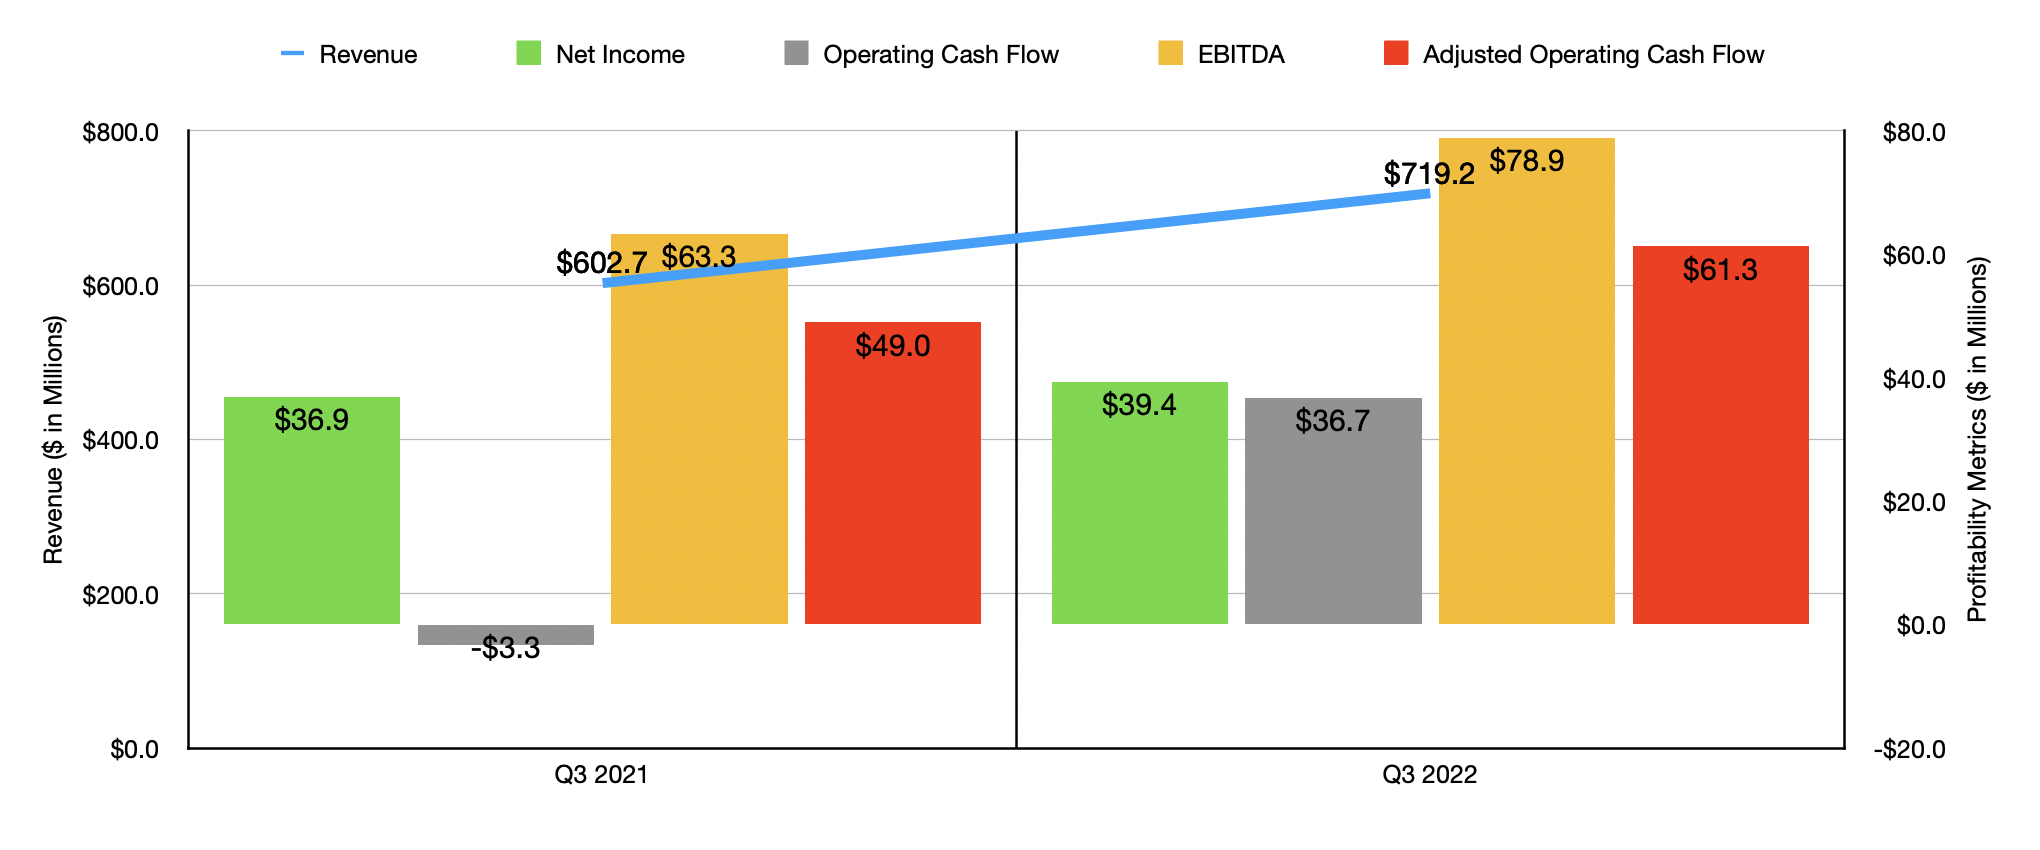
This performance is not, in my opinion, based on luck. Instead, it stems from robust financial performance. To see what I mean, we need only a look at data covering the most recent quarter for which data is available. This is the third quarter of the company's 2022 fiscal year . During that time, revenue for the company came in at $719.2 million. That's 19.3% higher than the $602.7 million the company generated the same time of its 2021 fiscal year. According to management, this revenue surge was driven mostly by a 22% rise in sales associated with its surfactants. This increase, amounting to $87.1 million, was driven by higher selling prices that positively impacted sales to the tune of $136.2 million. Unfortunately, foreign currency translation had an unfavorable impact of $19.3 million, while sales volume declines hit the company to the tune of $29.8 million. On a percentage basis though, the real driver was the specialty products side of the business. Sales here skyrocketed 83%, rising from $16.1 million to $29.5 million. This increase, management asserted, was driven by higher selling prices and a 10% increase in sales volume for the company.
With the rise in revenue, we also saw profitability improve. Even though inflationary pressures proved problematic, net income still managed to rise from $36.9 million to $39.4 million. Operating cash flow went from negative $3.3 million to positive $36.7 million. If we adjust for changes in working capital, it would have gone from $49 million to $61.3 million. And over that same window of time, EBITDA for the business rose from $63.3 million to $78.9 million.
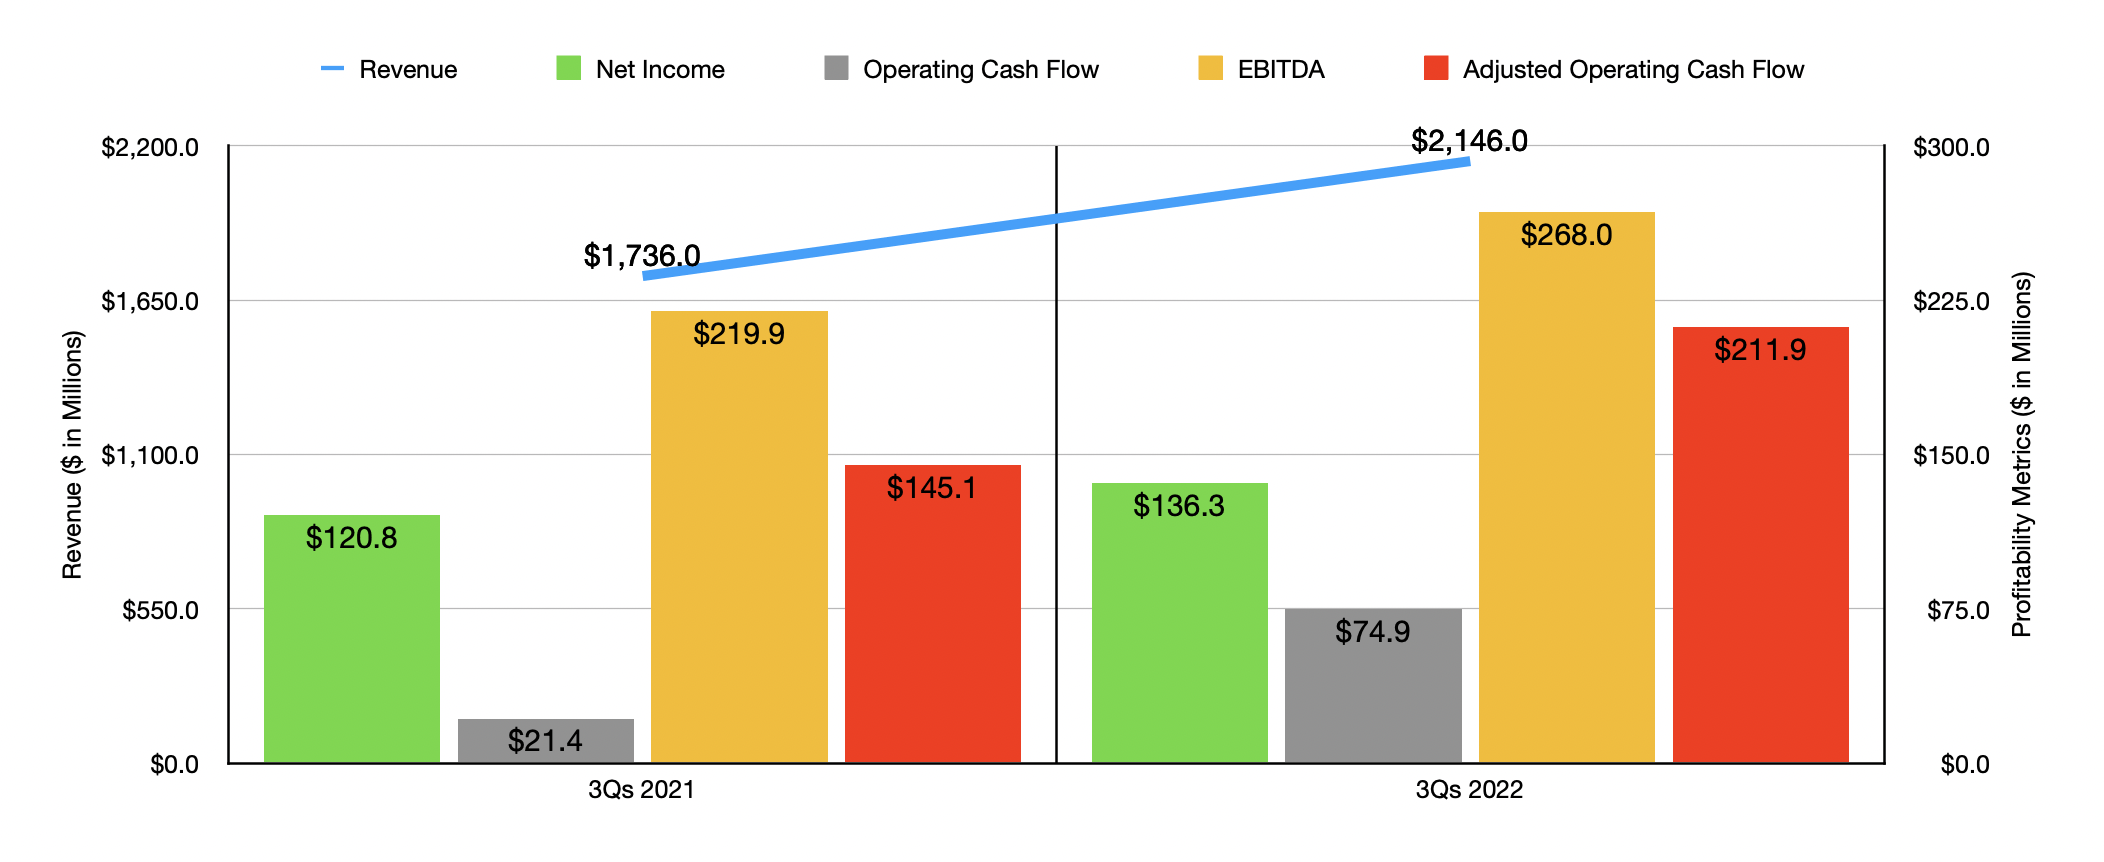
When it comes to the first nine months of 2022 as a whole, the picture looked very similar. Sales of $2.15 billion beat out the $1.74 billion reported the same time last year. It is worth noting that the company did benefit from higher revenue associated with some acquisition activities. This included one acquisition in 2022 and at least two noteworthy acquisitions throughout 2021. Over the same window of time, profits rose from $120.8 million to $136.3 million. Operating cash flow more than tripled from $21.4 million to $74.9 million, while the adjusted figure for this grew from $145.1 million to $211.9 million. Also on the rise was EBITDA, a metric that increased from $219.9 million to $268 million.
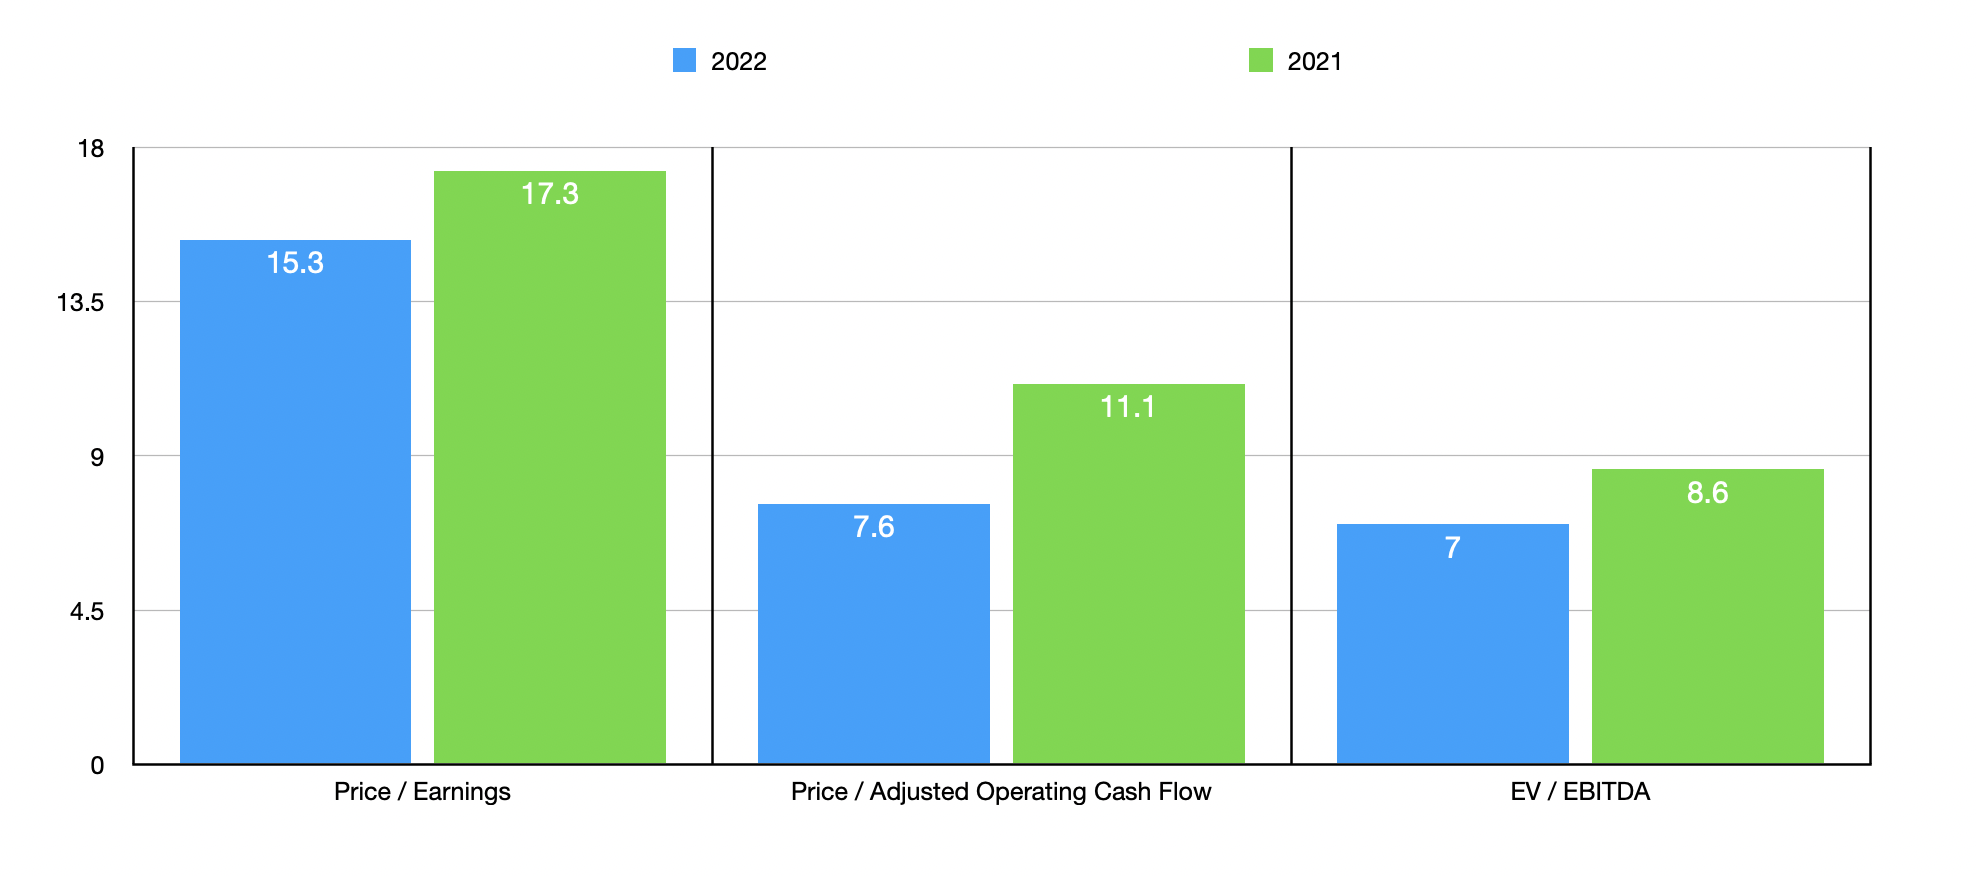
Unfortunately, management has not really provided any guidance when it comes to the 2022 fiscal year in its entirety. But if we annualize results experienced so far for the year, we should anticipate net income of $155.5 million, adjusted operating cash flow of $311.9 million, and EBITDA of roughly $395.2 million. Using these figures, I calculated that the company is trading at a forward price-to-earnings multiple of 15.3. The forward price to adjusted operating cash flow multiple should be 7.6, while the forward EV to EBITDA multiple should come in at 7. By comparison, using the data from 2021, these multiples would be 17.3, 11.1, and 8.6, respectively.
As part of my analysis, I also decided to compare the company to five similar enterprises. On a price-to-earnings basis, these companies ranged from a low of 6.7 to a high of 16.4. In this case, three of the five firms were cheaper than our prospect. Using the price to operating cash flow approach, the range was from 6 to 35.5. In this scenario, only one of the five firms was cheaper than our target. And when it comes to the EV to EBITDA approach, the range was from 5.2 to 14.2. In this case, two of the five companies were cheaper than Stepan Company.
| Company |
| Price / Earnings |
| Price / Operating Cash Flow |
| EV / EBITDA |
| Stepan Company |
| 15.3 |
| 7.6 |
| 7.0 |
| Celanese Corporation ( CE ) |
| 6.7 |
| 6.0 |
| 5.2 |
| Flexible Solutions International ( FSI ) |
| 9.9 |
| 16.8 |
| 5.3 |
| Minerals Technologies ( MTX ) |
| 13.9 |
| 15.0 |
| 9.1 |
| Albemarle Corp ( ALB ) |
| 16.4 |
| 31.5 |
| 14.2 |
| Innospec Inc ( IOSP ) |
| 19.6 |
| 35.5 |
| 11.5 |
Takeaway
Based on all the data at my disposal, I must say that I remain impressed by the continued robust financial performance achieved by Stepan Company. Sales continue to climb at a nice pace while profits and cash flows follow suit. On an earnings basis, shares aren't exactly cheap. But they are cheap, I would assert, from a cash flow perspective. This is true on an absolute basis and somewhat true relative to similar businesses. Because of all of these factors and no end in sight to the company's current state, I would make the case that shares still deserve a 'buy' rating at this time.
For further details see:
Stepan Company: Expect Outperformance To Continue