WWW - Steven Madden: A Shoe-In Candidate For Your Portfolio
Summary
- Steven Madden continues to post sales increases, but the most recent data available shows some weakness on the bottom line.
- While this may be disappointing to some investors, the stock looks cheap enough to overlook this.
- The firm also has a robust balance sheet that significantly reduces risk for investors.
One of the beautiful things about value investing is that companies don't always need to post robust fundamental performance in order for their share prices to rise. Because of how cheap the stocks in question are, they can even appreciate in response to year-over-year declines in profitability so long as those declines look modest. One company I could point to as an example here is Steven Madden ( SHOO ), an enterprise engaged in fashion-forward branded and private-label footwear, accessories, and apparel. Overall, sales for the company continued to rise, but profits and cash flows have taken a slight step back. This has not stopped shares from generating attractive upside for shareholders, thanks largely to the fact that the stock in question is already trading at low levels. As long as recent developments are not an indicator of a longer-lasting trend, I would even make the case that shares should move higher from here for the foreseeable future.
Robust investor sentiment
Near the end of September of last year, I wrote an article discussing the investment opportunity presented by Steven Madden. At that time, I talked about how well the company had done in growing both its top and bottom lines over the prior few years. That growth was continuing into the 2022 fiscal year, with no evidence of a worsening and operations. I also found myself attracted to how cheap the shares were. All of these items coalesced to cause me to rate the enterprise a 'buy', a rating that I use to assert my opinion that shares should outperform the broader market for the foreseeable future. And so far, outperform the company. While the S&P 500 is up 5% since the publication of that article, shares of Steven Madden have seen upside of 15.5%.
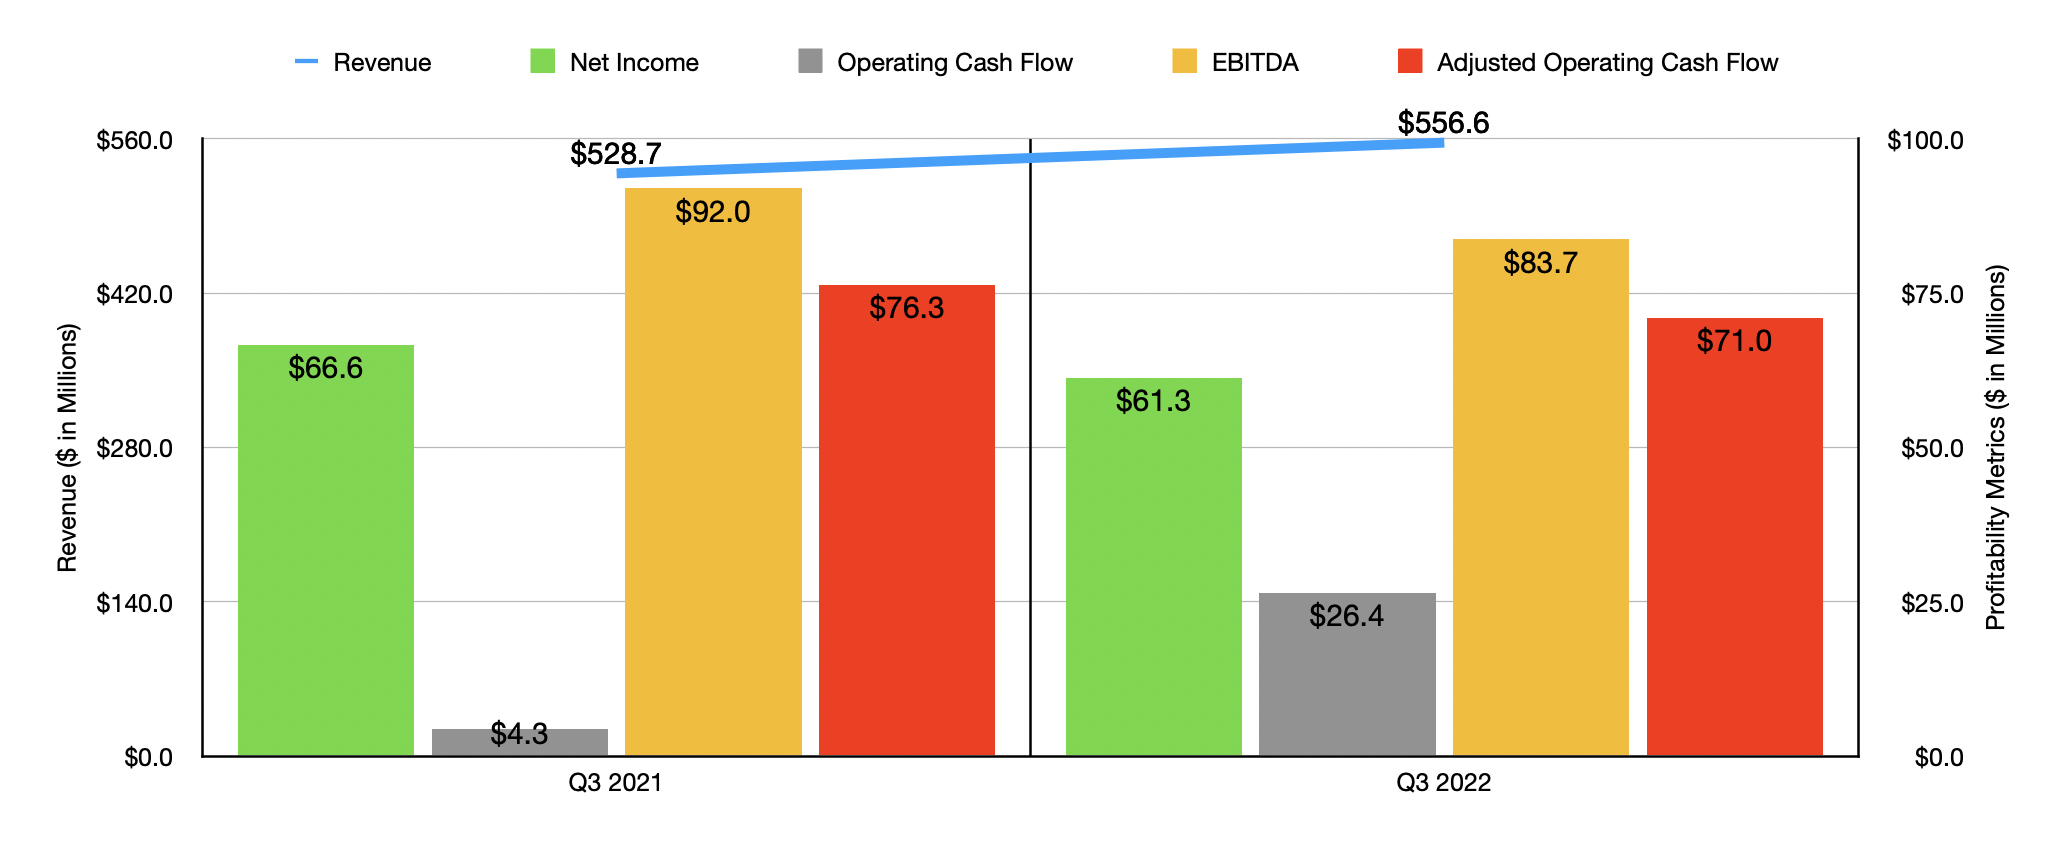
At this point, it would likely be best to cover the company's most recent financial performance. This involves the financial data covering the third quarter of the company's 2022 fiscal year. This is the only quarter for which new data is available that was not previously available when I wrote about the firm last year. According to management, sales during this time came in at $556.6 million. That's a 5.3% increase over the $528.7 million generated the same time one year earlier. The biggest contributor to this sales increase was the Wholesale Footwear segment of the enterprise. Revenue from that segment jumped 8.7% year over year, climbing from $304.2 million to $330.8 million. This increase, according to management, was largely driven by a few key brands experiencing robust demand. Unfortunately, management has not provided much in the way of detail on specifics. The biggest weakness for the company, meanwhile, came from its Direct-to-Consumer segment, which reported a decline of 3.7% because of weaker e-commerce sales. As the economy reopened, more people started visiting the company's 216 brick-and-mortar stores instead of shopping online.
Unfortunately, the rise in revenue did not bring with it an increase in profitability. Net income actually fell year over year, dropping from $66.6 million to $61.3 million. Even though the company benefited from the rise in revenue, profits for the company shrank. Its gross profit margin, for instance, declined from 41.6% to 41.2%, while operating expenses rose from 24.9% of sales to 27.1%. The gross profit problems for the company were largely driven by a shift in revenue mix from the higher margin Direct-to-Consumer operations of the company to the lower margin wholesale business. Increased promotional activity for the Direct-to-Consumer segment also weighed on the company. The rise in operating expenses relative to sales, meanwhile, was largely due to higher warehouse expenses, salaries, advertising expenses, and the accelerated amortization of a trademark. Other profitability metrics, sadly, followed a similar trajectory. Although operating cash flow for the company rose from $4.3 million to $26.4 million, this figure actually dropped from $76.3 million to $71 million if we adjust for changes in working capital. Meanwhile, EBITDA for the company fell from $92 million to $83.7 million.
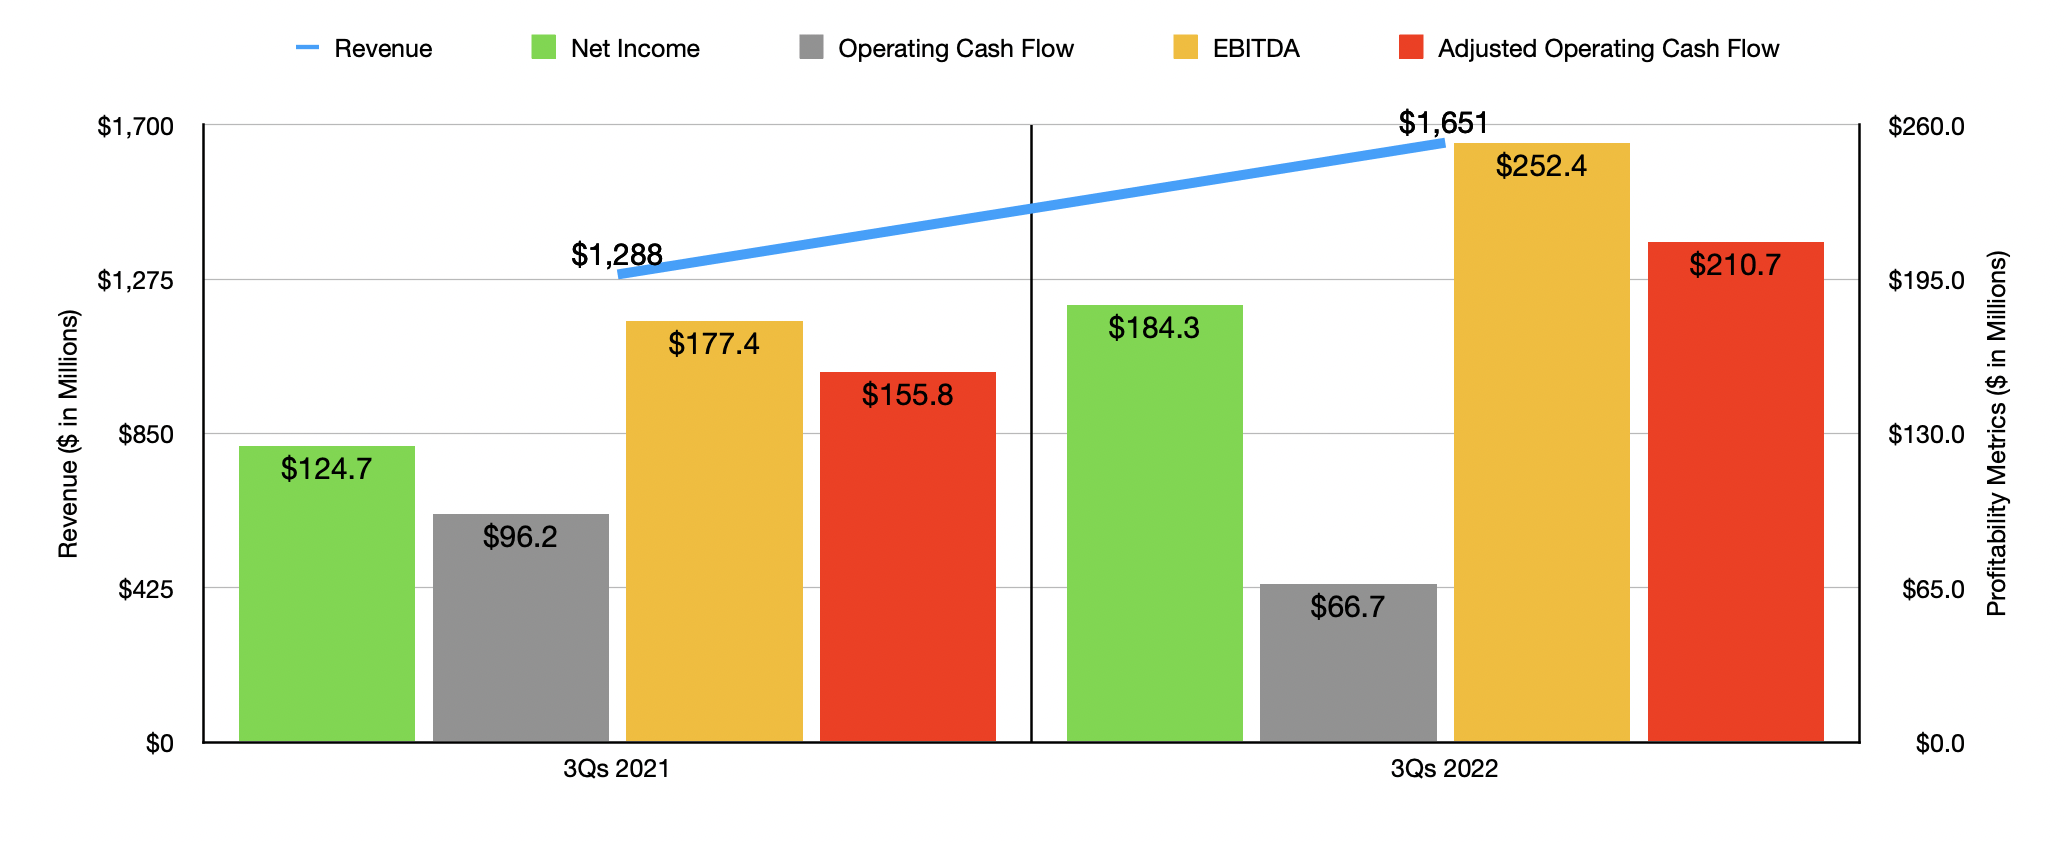
The weakness demonstrated in the third quarter was actually a lot different than what the company experienced for the first nine months of 2022 as a whole. Yes, revenue still did increase year over year, climbing from $1.29 billion to $1.65 billion. But profits for the first nine months of the year came in at $184.3 million. That's up from the $124.7 million reported the same time one year earlier. Operating cash flow still managed to fall, dropping from $96.2 million to $66.7 million. But on an adjusted basis, it managed to increase from $155.8 million to $210.7 million, while EBITDA for the company rose from $177.4 million to $252.4 million.
For 2022 as a whole, management said that revenue should come in about 12.5% to 13.5% higher than it did in 2021. They also said that earnings per share should be between $2.77 and $2.79, with adjusted earnings of between $2.77 and $2.82. Using the midpoint for the adjusted earnings figure, we would get net income of $216.3 million. If we annualize the other profitability metrics for the company, we would get adjusted operating cash flow of $323.4 million and EBITDA of $373.8 million.
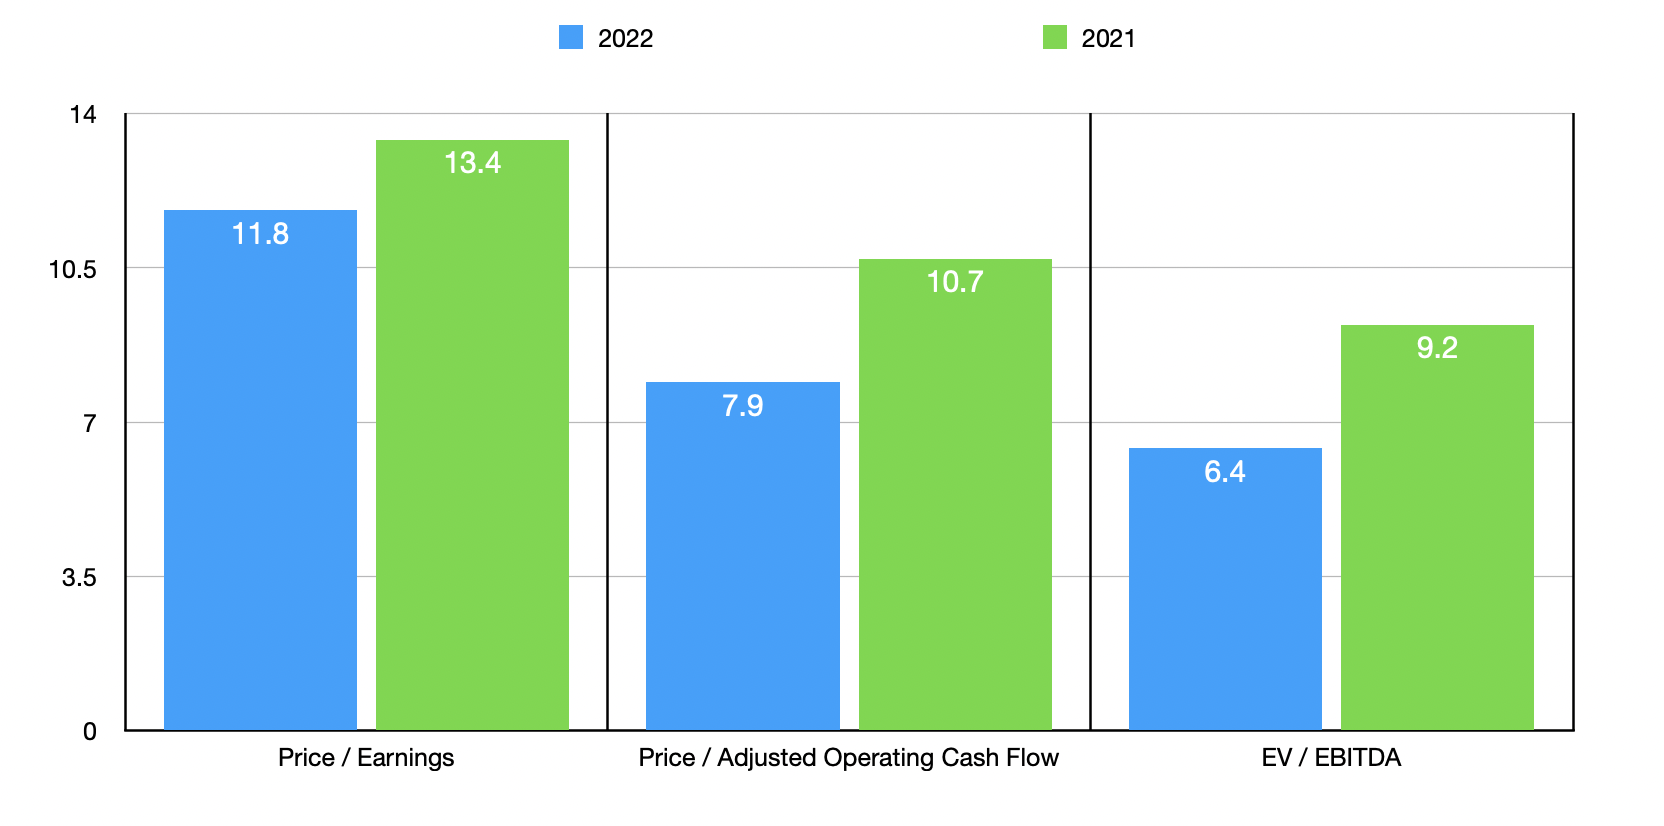
Using these figures, I calculated that the company is trading at a price-to-earnings multiple of 11.8. The price to adjusted operating cash flow multiple would be 7.9, while the EV to EBITDA multiple would come in at 6.4. By comparison, if we were to use the data from the 2021 fiscal year, these numbers would be 13.4, 10.7, and 9.2, respectively. Just as I do with other companies that I write about, I decided to compare Steven Madden to five similar enterprises. On a price-to-earnings basis, these companies ranged from a low of 6.9 to a high of 25.5. Three of the five companies were cheaper than Steven Madden. Using the price to operating cash flow approach, we end up with a range of 16.4 to 107.8. And when it comes to the EV to EBITDA approach, the range should be from 8.6 to 17.9. In both of these cases, our prospect is the cheapest of the group.
| Company |
| Price/Earnings |
| Price/Operating Cash Flow |
| EV/EBITDA |
| Steven Madden |
| 11.8 |
| 7.9 |
| 6.4 |
| Wolverine World Wide ( WWW ) |
| 6.9 |
| 22.0 |
| 9.0 |
| Rocky Brands ( RCKY ) |
| 8.4 |
| N/A |
| 8.6 |
| Crocs ( CROX ) |
| 13.5 |
| 16.4 |
| 12.2 |
| Skechers U.S.A. ( SKX ) |
| 10.5 |
| 107.8 |
| 10.4 |
| Deckers Outdoor Corporation ( DECK ) |
| 25.5 |
| 49.4 |
| 17.9 |
Takeaway
Fundamentally speaking, Steven Madden seems to be showing a bit of weakness. But all things considered, the company is still doing quite well. The firm is generating a significant amount of cash, and it has cash in excess of debt of $148.2 million. Add on top of this how cheap shares are, both on an absolute basis and relative to similar firms, and I cannot help but to remain bullish on the company for now.
For further details see:
Steven Madden: A Shoe-In Candidate For Your Portfolio