IWM - Stock Bond And Consumer Behavior During Past Fiscal Crises
2023-05-24 12:28:01 ET
Summary
- In this article, I look at how financial and consumer markets reacted to the debt ceiling crises of 2011 and 2013, as well as the “fiscal cliff” of 2012.
- Their reactions were markedly different. During both the 2011 and 2013 crises, long-term bond yields declined sharply, while short-term yields spiked.
- During both the 2011 and 2013 crises, stocks declined as concerns grew more serious.
- Conversely, markets were generally untroubled by the prospect of the expiration of the Bush tax cuts at the end of 2012.
- Provided there is no actual credit breach, a quick rebound could be anticipated.
Introduction
The debt ceiling is looming and could be hit as soon as the end of next week. While there have been plenty of analyses about how the ending might pan out, there has been little commentary about the behavior of financial markets in previous similar scenarios.
But there were 3 previous episodes similar to our current one in the past 12 years: debt ceiling debacles in 2011 and 2013, and the “fiscal cliff” at the end of 2012. This article looks at how financial (and consumer) markets behaved during each - because there was a lot of consistency.
Stocks
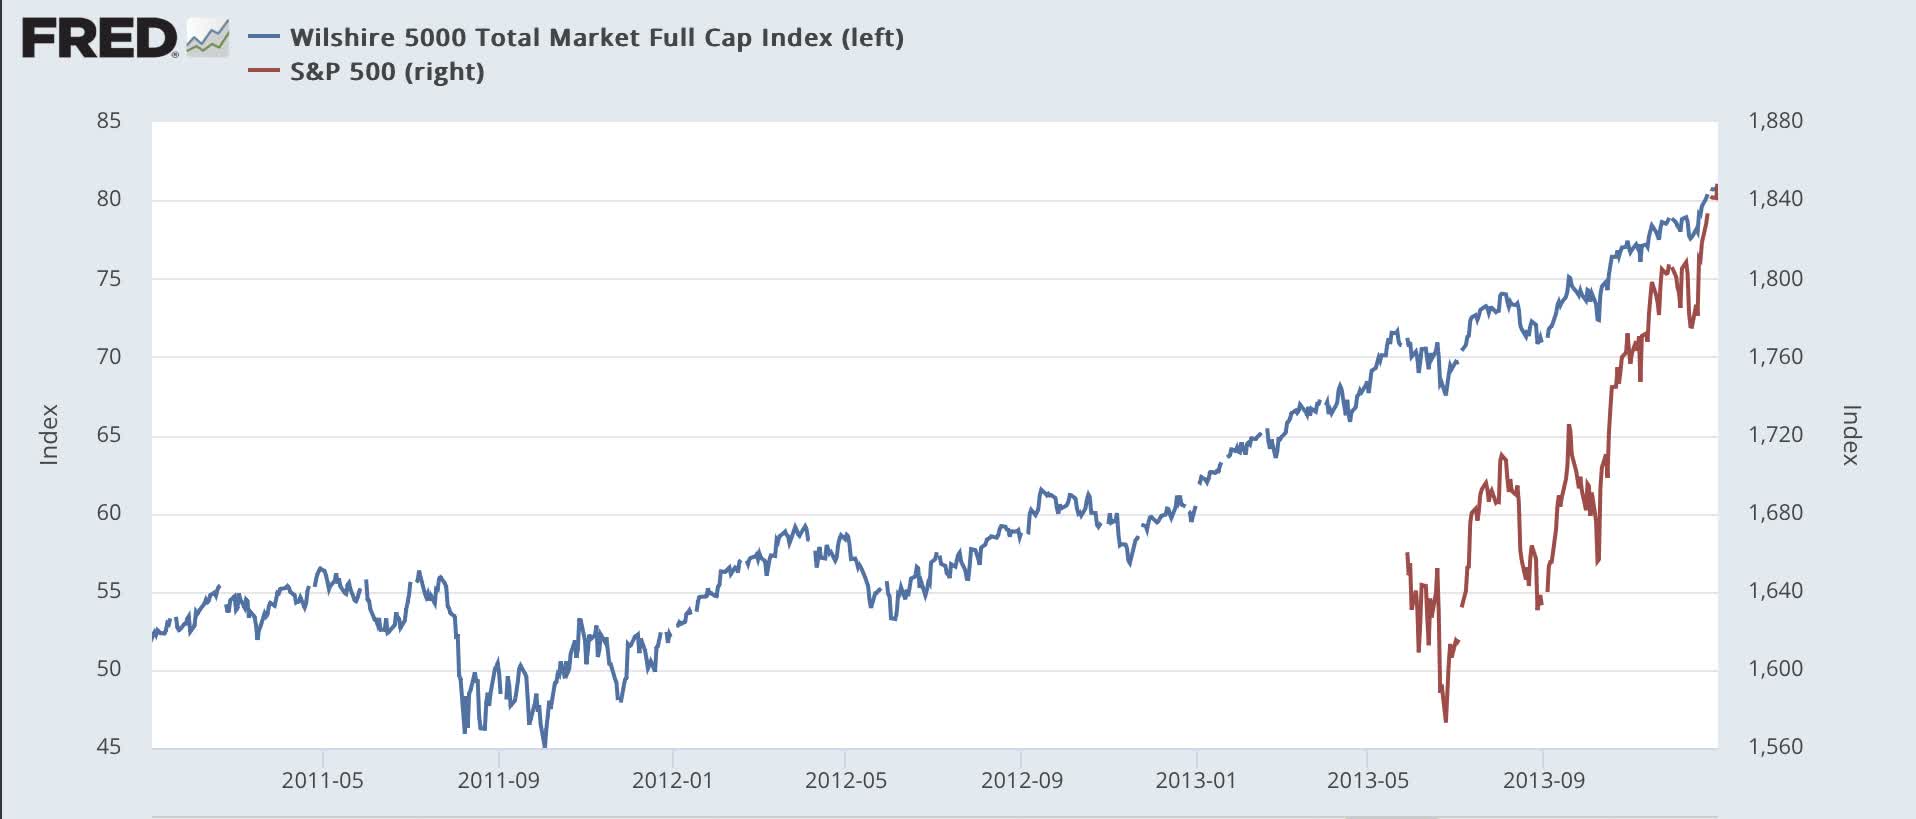
Here is how stocks – including the S&P 500 (SP500) from May 15, 2013 on – performed from the beginning of 2011 to the end of 2013:
There were significant selloffs during both the 2011 and 2013 debt ceiling cliffhangers, with only a small one at the end of 2012.
Generally speaking, the 2011 event was the most serious crisis: this is the one that led the S&P rating agency to downgrade U.S. debt from AAA to AA+ on August 5. Meanwhile, from a peak of July 22, 2011 at the beginning, stocks – as represented by the Wilshire 5000 (WFIVX) – declined -18% until the resolution of the crisis on August 8.
The 2012 “fiscal cliff” was about the expiration date for the Bush tax cuts at the end of the calendar year. There was less concern that a deal would be made, and indeed between December 20 and December 28, 2012, stocks only declined -2.4%.
The 2013 debt ceiling cliffhanger was a slow-rolling crisis that started in January and was not finally resolved until October. There were no debt downgrades, but there was a serious government shutdown, as on October 1, 800,000 federal workers were furloughed, and things like the National Parks closed. Stocks had several sharp declines, only one of which - in September and October - was directly related to the debt ceiling. There, the Wilshire 5000 declined by -7.3% and the S&P 500 by -4.1%. Nevertheless, from the opening of the event in mid-January until its resolution in October, the Wilshire 5000 actually *rose* by 16.3%.
Thereafter, on all three occasions, stocks rapidly regained all of their lost ground. The moral of the story has been, so long is there is no actual “credit event,” there have been brief and, with one exception not that deep, declines.
Until this week, stocks during this debt ceiling cliffhanger generally rose, before selling off by 1% on Tuesday. If it begins to appear like there might actually be a breach in credit, then a sharp 2011 style downturn would appear to be likely.
Bonds
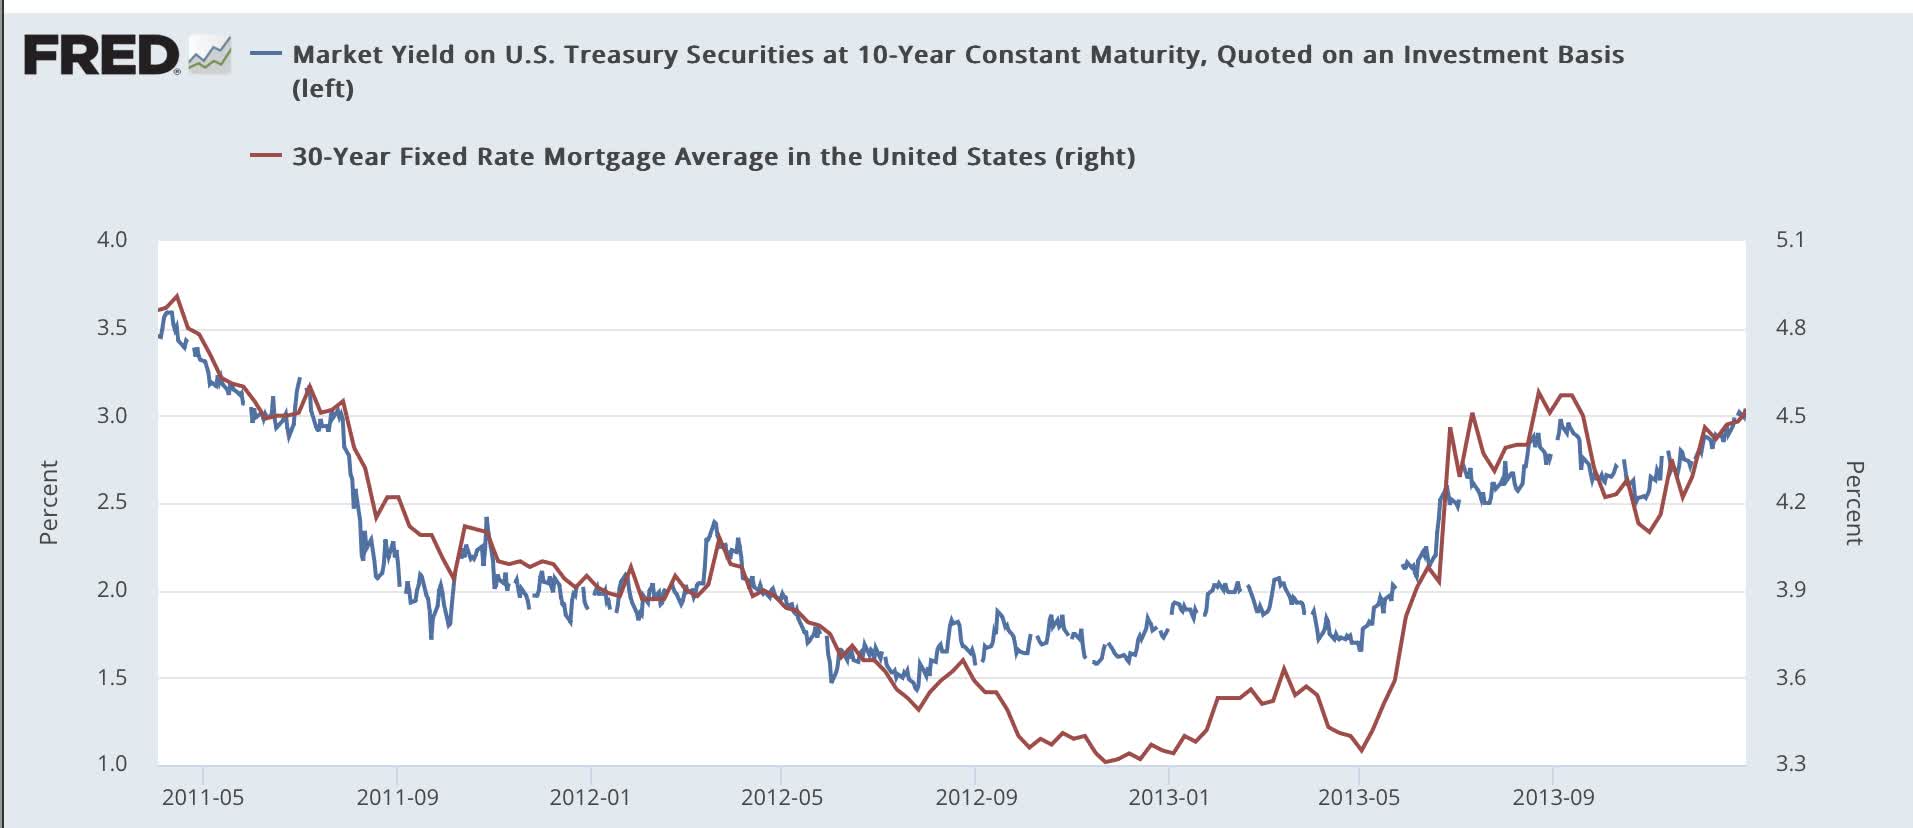
The story is quite different as between short and long-term bonds. Longer term bonds actually declined sharply in yield during all 3 events (first graph below), while short-term bonds only twitched (second graph).
In 2011, from July 27 to September 22, the 10 year note declined in yield from 3.01% to 1.72%, which at that point was a new 50 year low. And from September 5, 2013 to October 23, the 10 year note (US10Y) declined in yield from 2.98% To 2.51%.
By contrast, during the “fiscal cliff,” bond yields actually rose from 1.58% to a high of 1.93% on January 4, 2013.
Note that mortgages (red) followed a similar trajectory.
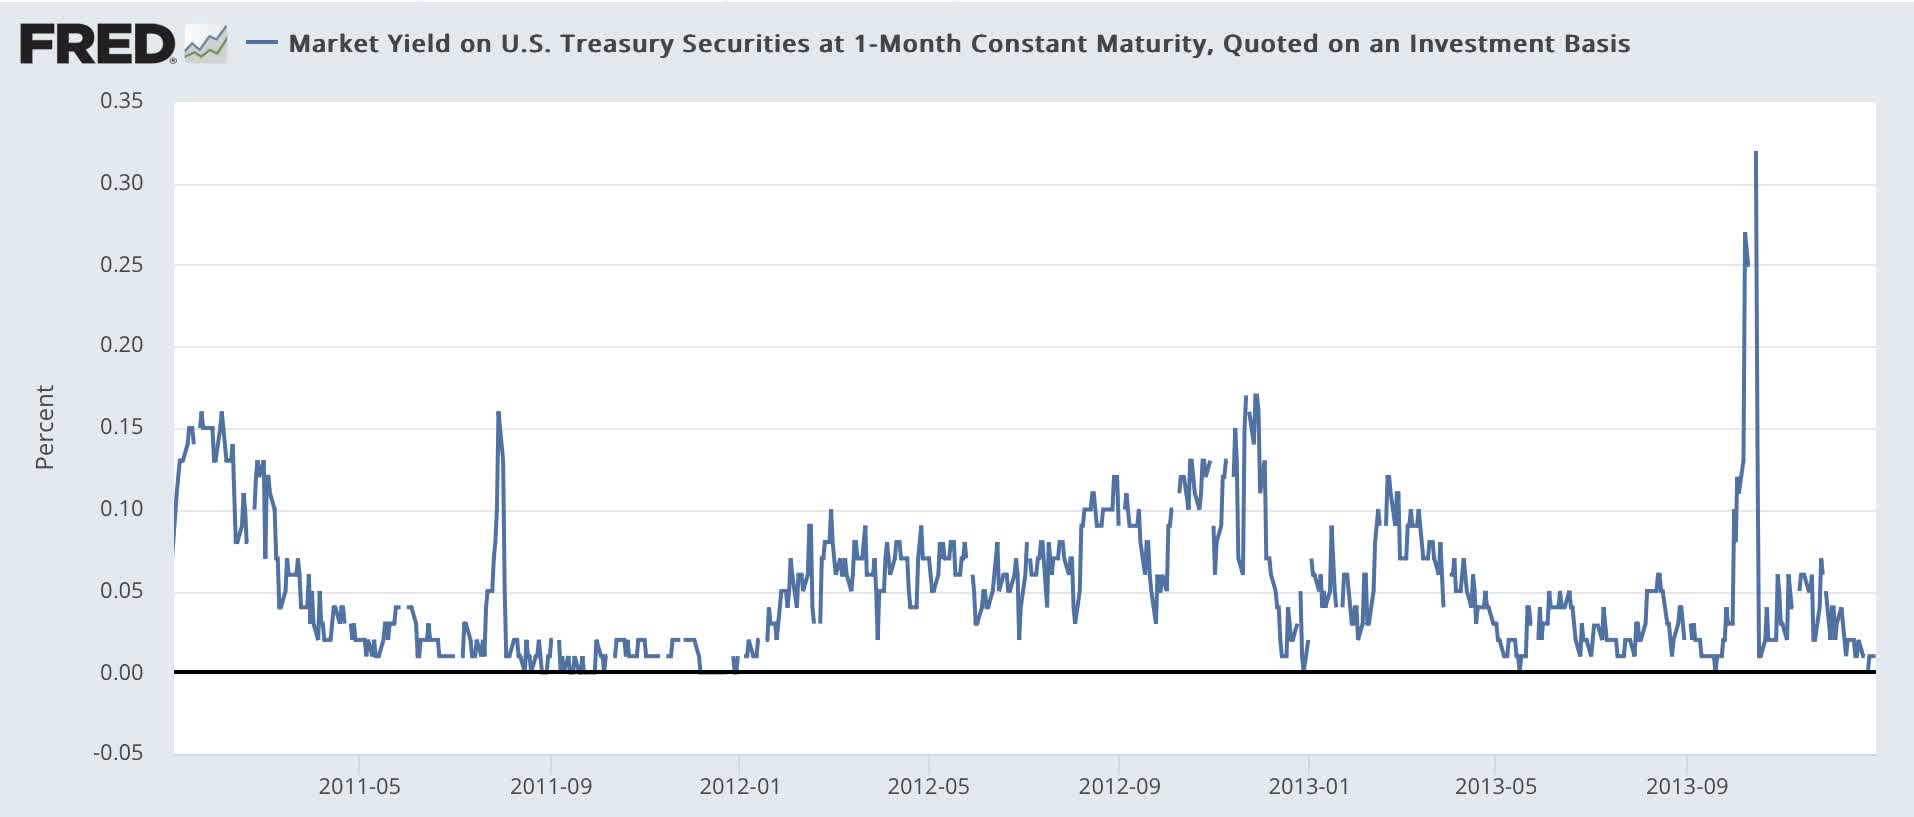
Now let’s turn to short-term bonds, in the form of the 1 month note. Here there is a very different story:
There were very clear spikes in yield during the events. In 2011, from July 20 to July 29, yields rose from .01% to .16%. And from September 19 through October 15, 2013, yields spiked from 0.0% to .32%. In both cases, once the debt ceiling was resolved, short term yields immediately reverted to baseline.
By contrast, from November 27 to December 28, 2012, yields declined from .17% to 0.0%!
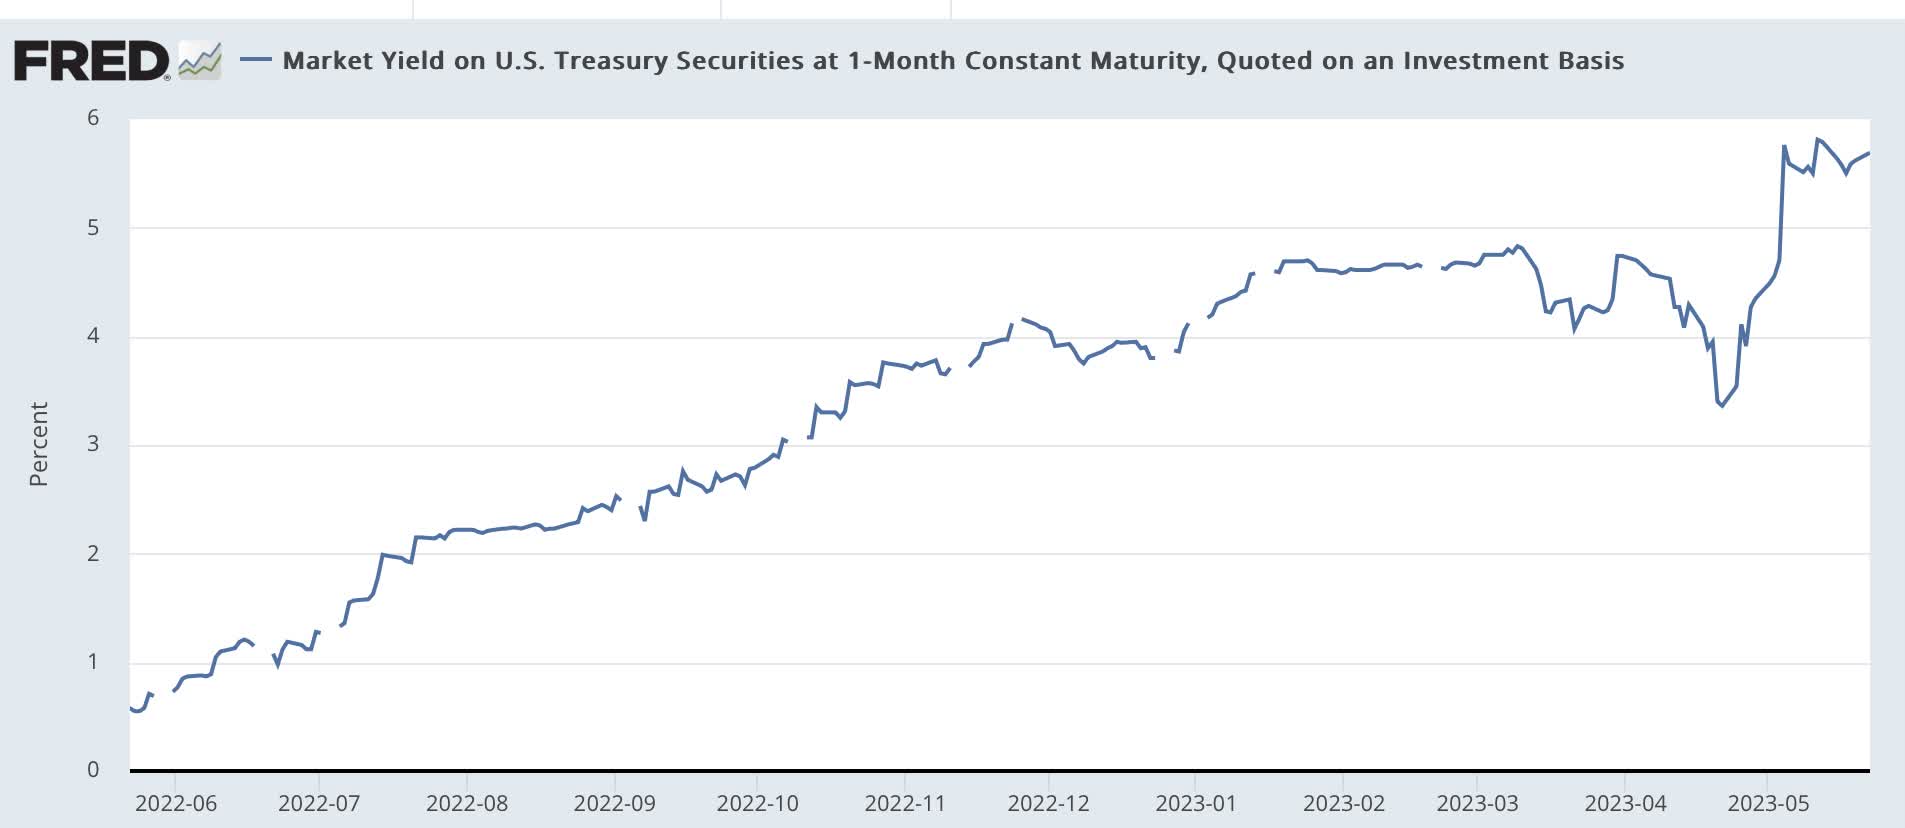
This year, short-term yields have once again spiked, this time more significantly. Yields on the 1 month note (US1M) have risen from 3.36% on April 21 to as high as 5.81% on May 11:
The story here is that, as fears of a debt ceiling breach grew, recession fears also intensified. And since recessions *always* lead to disinflation if not deflation, long-term bonds reacted to that possibility. Meanwhile, uncertainty about a possible missed payment on a note coming due immediately after such a breach caused the only short-term spikes of any significance above .05% between 2010 and 2016. But the potential expiration of the Bush tax cuts was not treated as potentially deflationary. Indeed, the action of the stock and bond markets combined appears to have treated the potential expiration of those tax cuts as a potential boon to the economy.
Consumer spending and confidence
The consumer reaction to the 2011, 2012, and 2013 events was more mixed.
Here is consumer sentiment as measured by the University of Michigan during the last expansion:
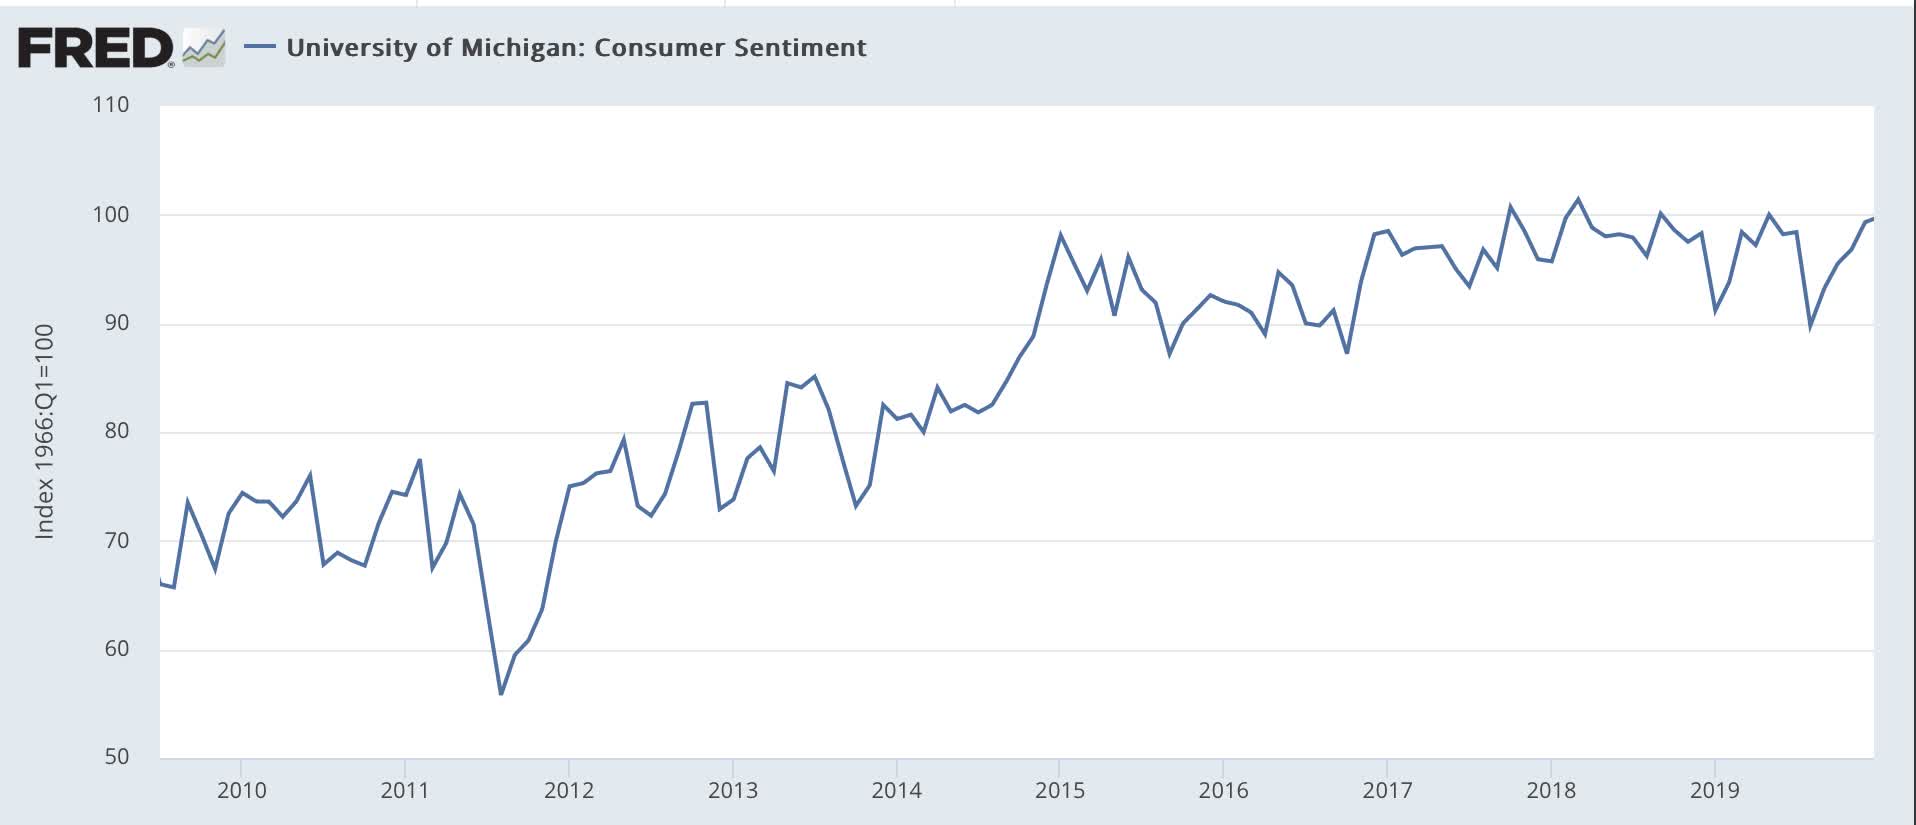
There are big sawtooths exactly marking the three cliffhangers, with the biggest dip in confidence in August 2011. There are also smaller, but significant dips during both December 2012 and October 2013.
Now here is an updated graph:
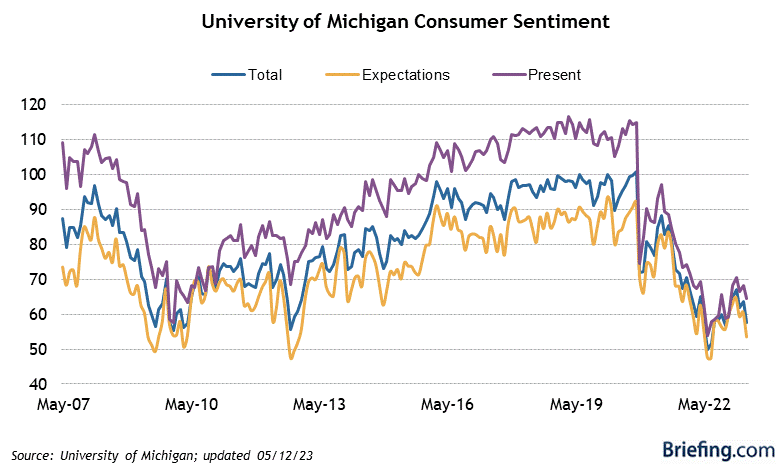
There was a big downturn in confidence in the first reading this month, two weeks ago. The final reading will be released on Friday.
But if consumers expressed nervousness about potential debt ceiling breaches, their wallets told a much more equivocal story:
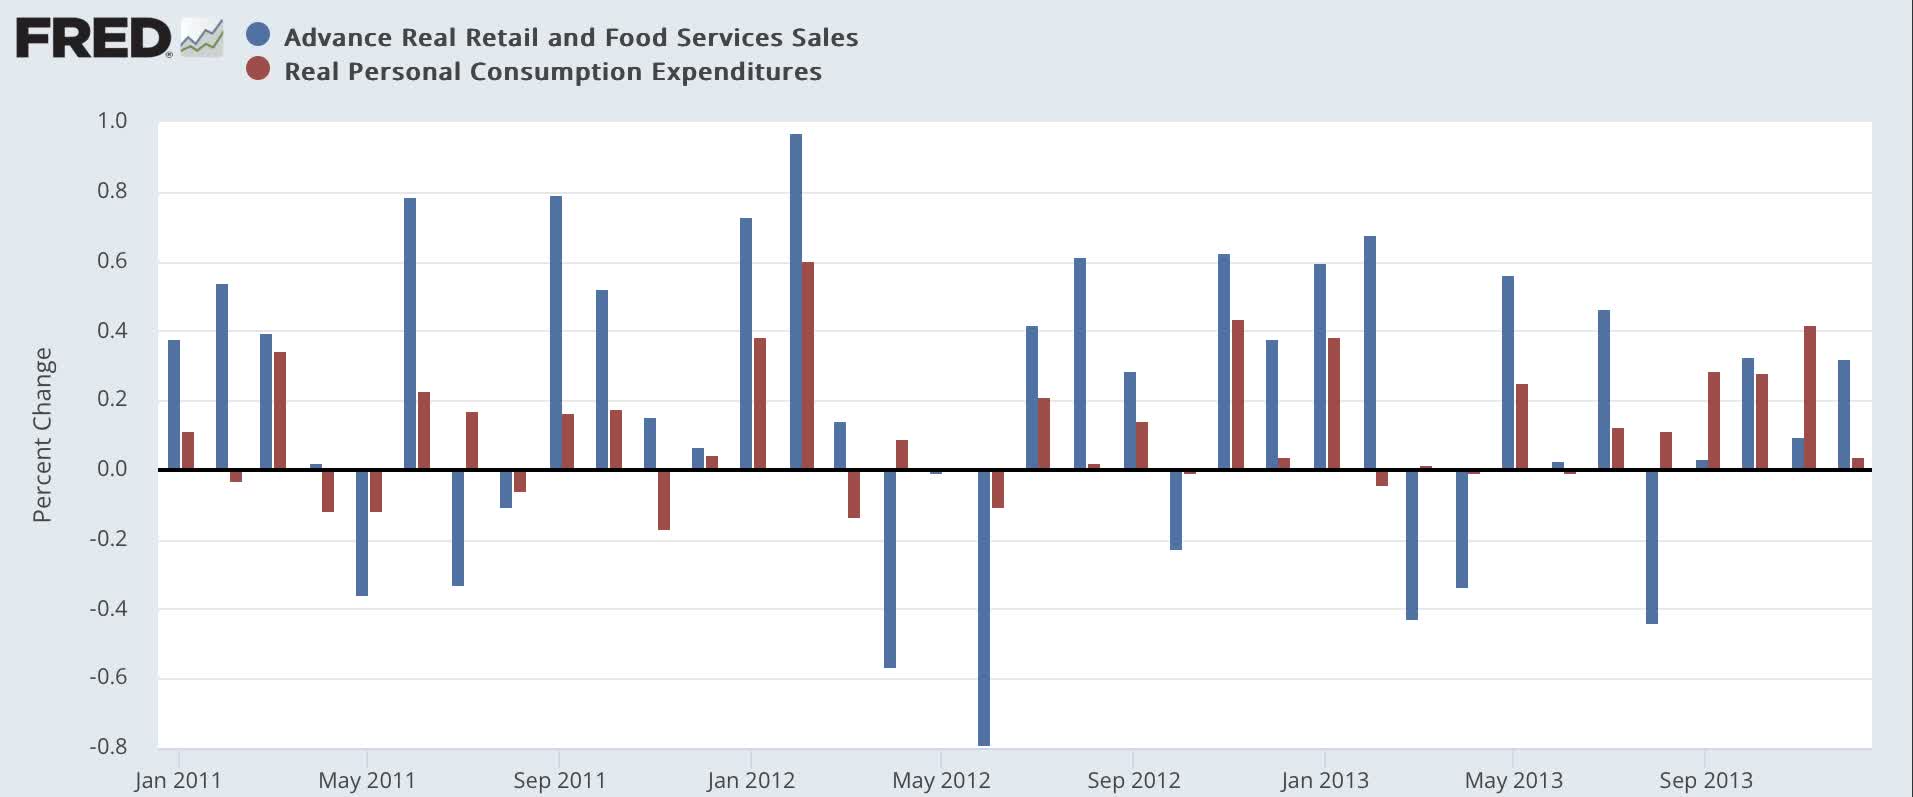
Real retail sales did decline in July and August 2011, and in August 2013, but in neither case by an unusual amount. Meanwhile real personal consumption expenditures declined only slightly in July 2011 and actually rose during August and September 2013. Neither series declined during the period of the “fiscal cliff.”
Conclusion
During both the 2011 and 2013 debt ceiling crises, stocks sold off (much more during 2011 than 2013) and long-term bond yields declined sharply. Short term bond obligations that might come due during any potential default did spike noticeably, compared with the baseline yield. The more likely an actual breach appeared, the more both stocks and bonds reacted, treating any such potential default as a recession-causing, deflationary event.
Provided there is an actual resolution of the debt ceiling cliffhanger without impairment of the U.S. credit rating, both stocks and bonds can be expected to bounce back almost immediately.
For further details see:
Stock, Bond, And Consumer Behavior During Past Fiscal Crises