IWM - Stock Market Mid-February Chart Storm (Technical Analysis)
Summary
- Higher inflation and higher interest rates remain a headwind.
- International stock market indices are doing better than major U.S. stock market indices.
- There is a case for the continuation of the downtrend or a new uptrend.
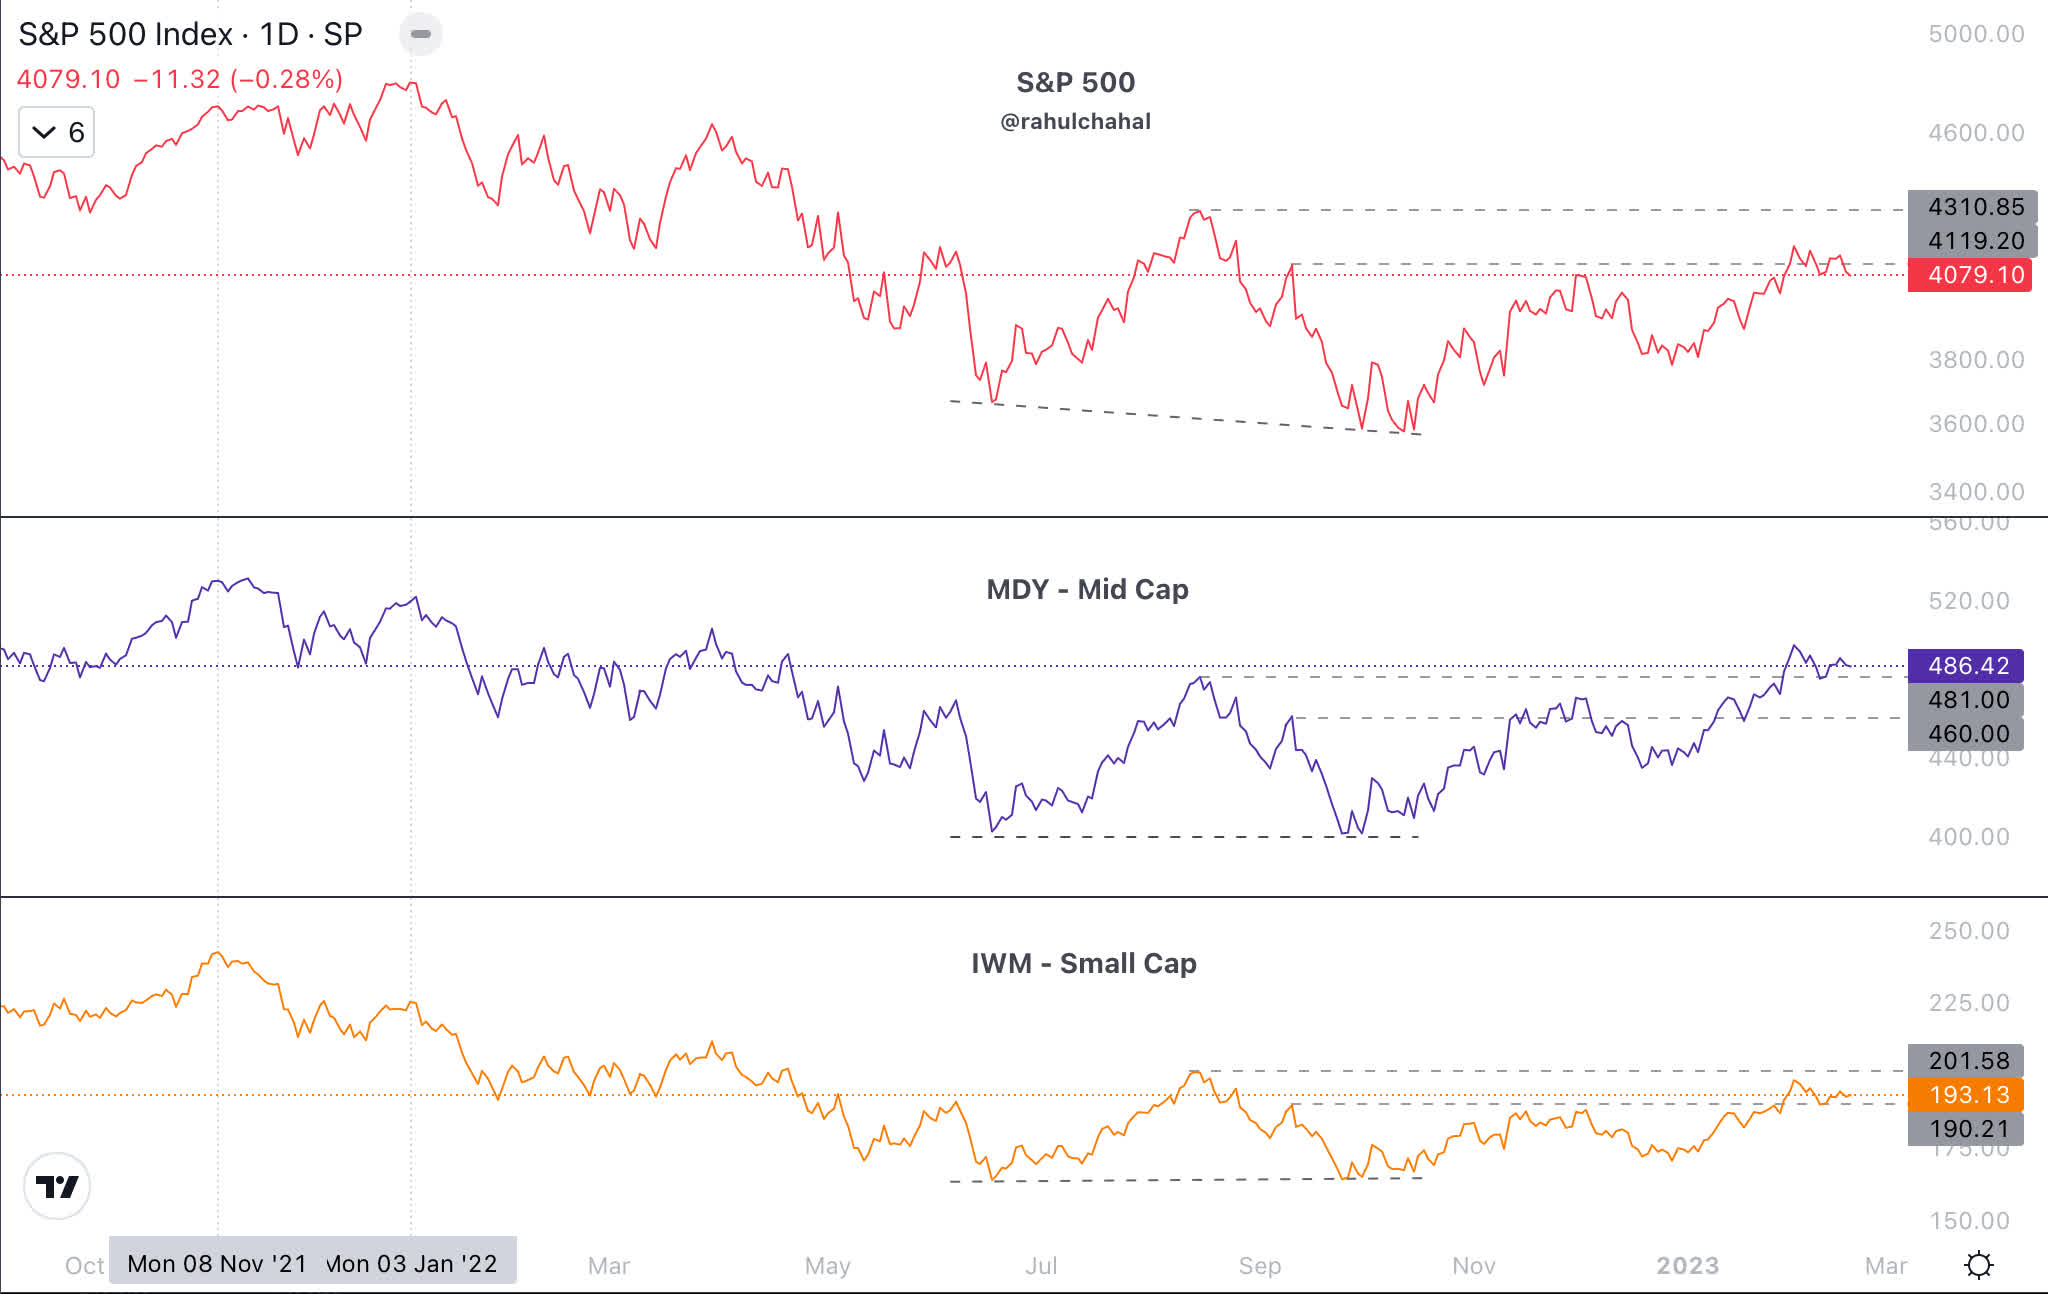
In this article we will review economic data, the bond market, commodities, the U.S. Dollar Index ( DXY ), stock market charts, market sentiment, and other information to determine if we are about to start an uptrend or continue with the downtrend for the S&P 500 Index ( SP500 ). Below are charts of the S&P 500, mid-cap ( MDY ), and small-cap ( IWM ). Mid-caps are outperforming and above their August 2022 level.
Economic Data
Inflation data comes in as expected but is hotter than previous months. Unless inflation comes down meaningfully in coming months, both stock and bond markets could remain under pressure.
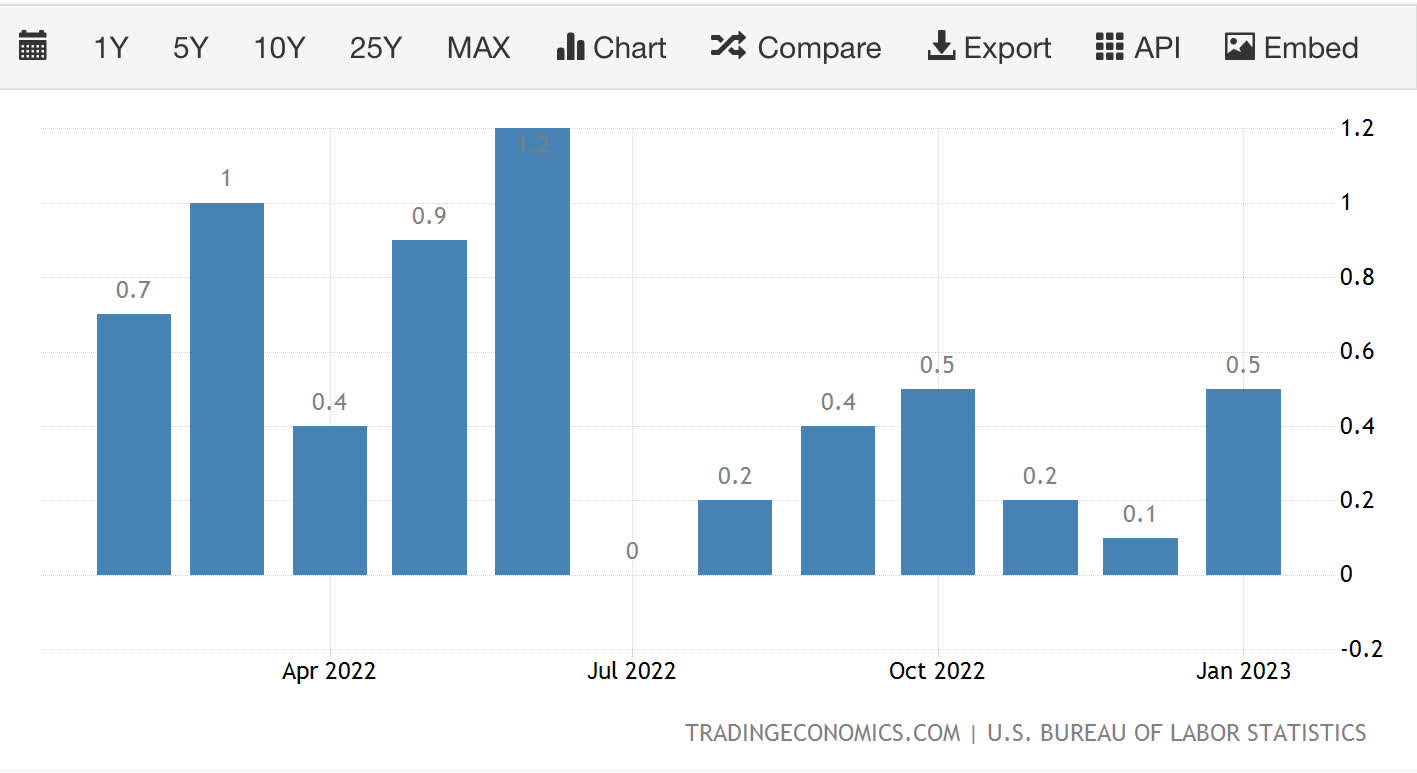
Inflation
CPI month-over-month for January 2023 came in at 0.5 as expected. However, the overall trend is lower than in Q1 and Q2 2022.
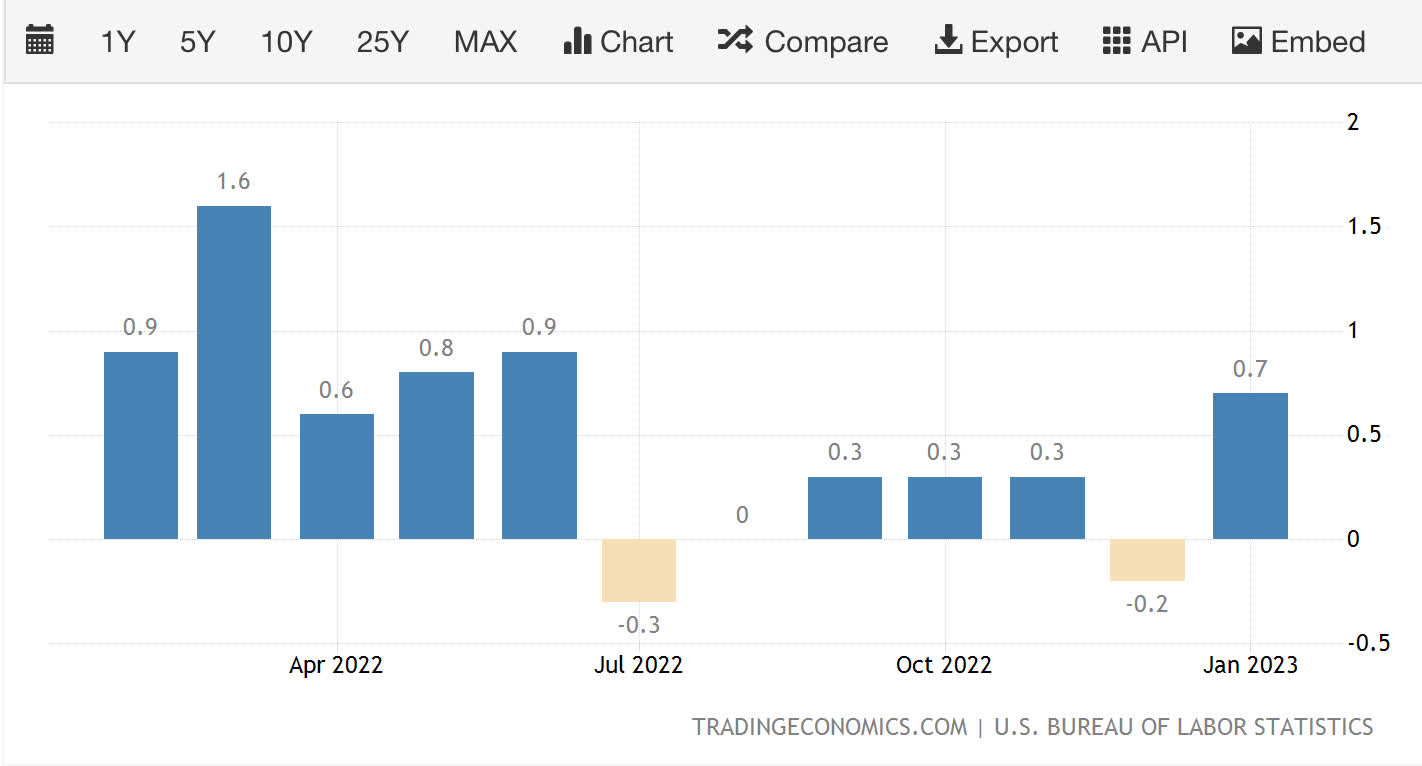
PPI month over month reading for January 2023 also came in as expected but was the highest reading in over 6 months.
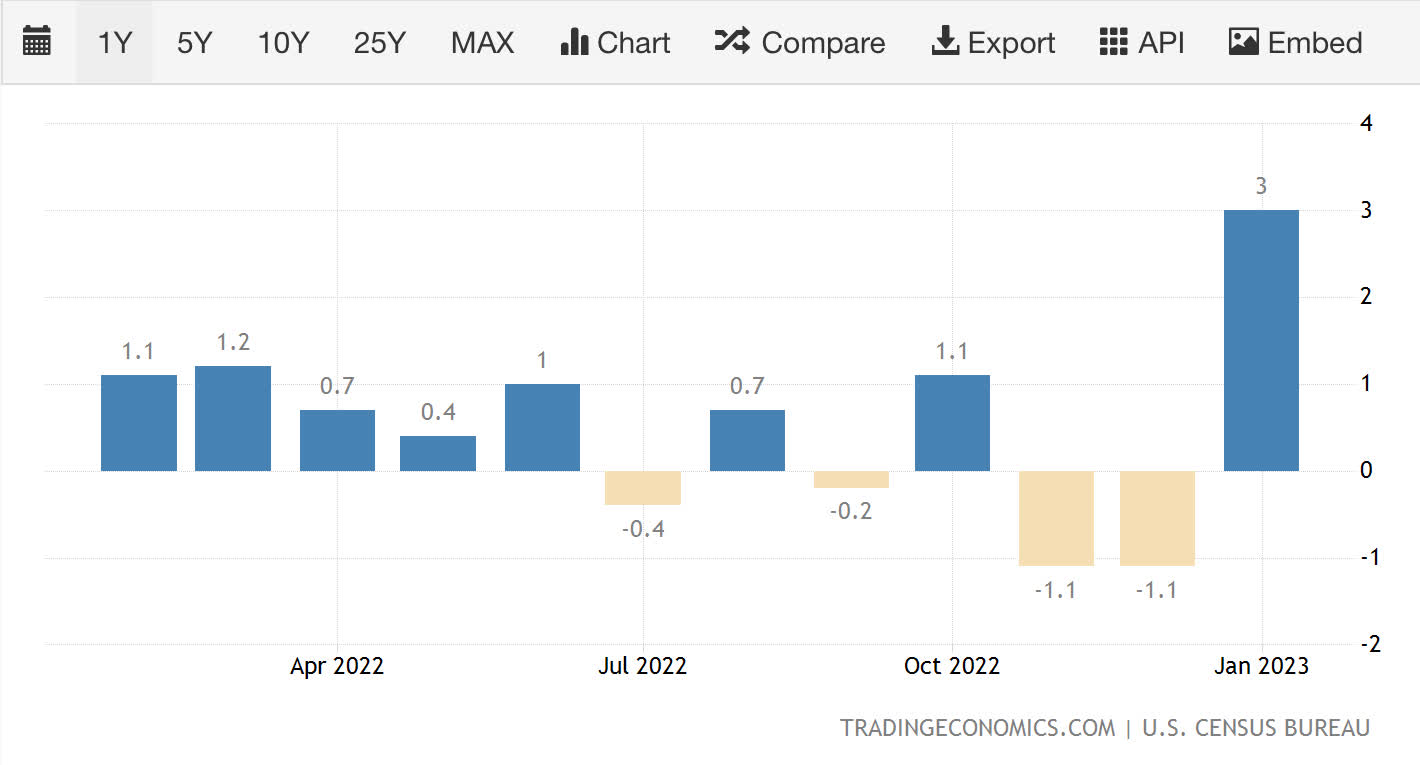
Retail Sales
Advanced retail sales reading for January 2023 came in surprisingly at 3%, which is well above the expected 1.8%.
Bond Market
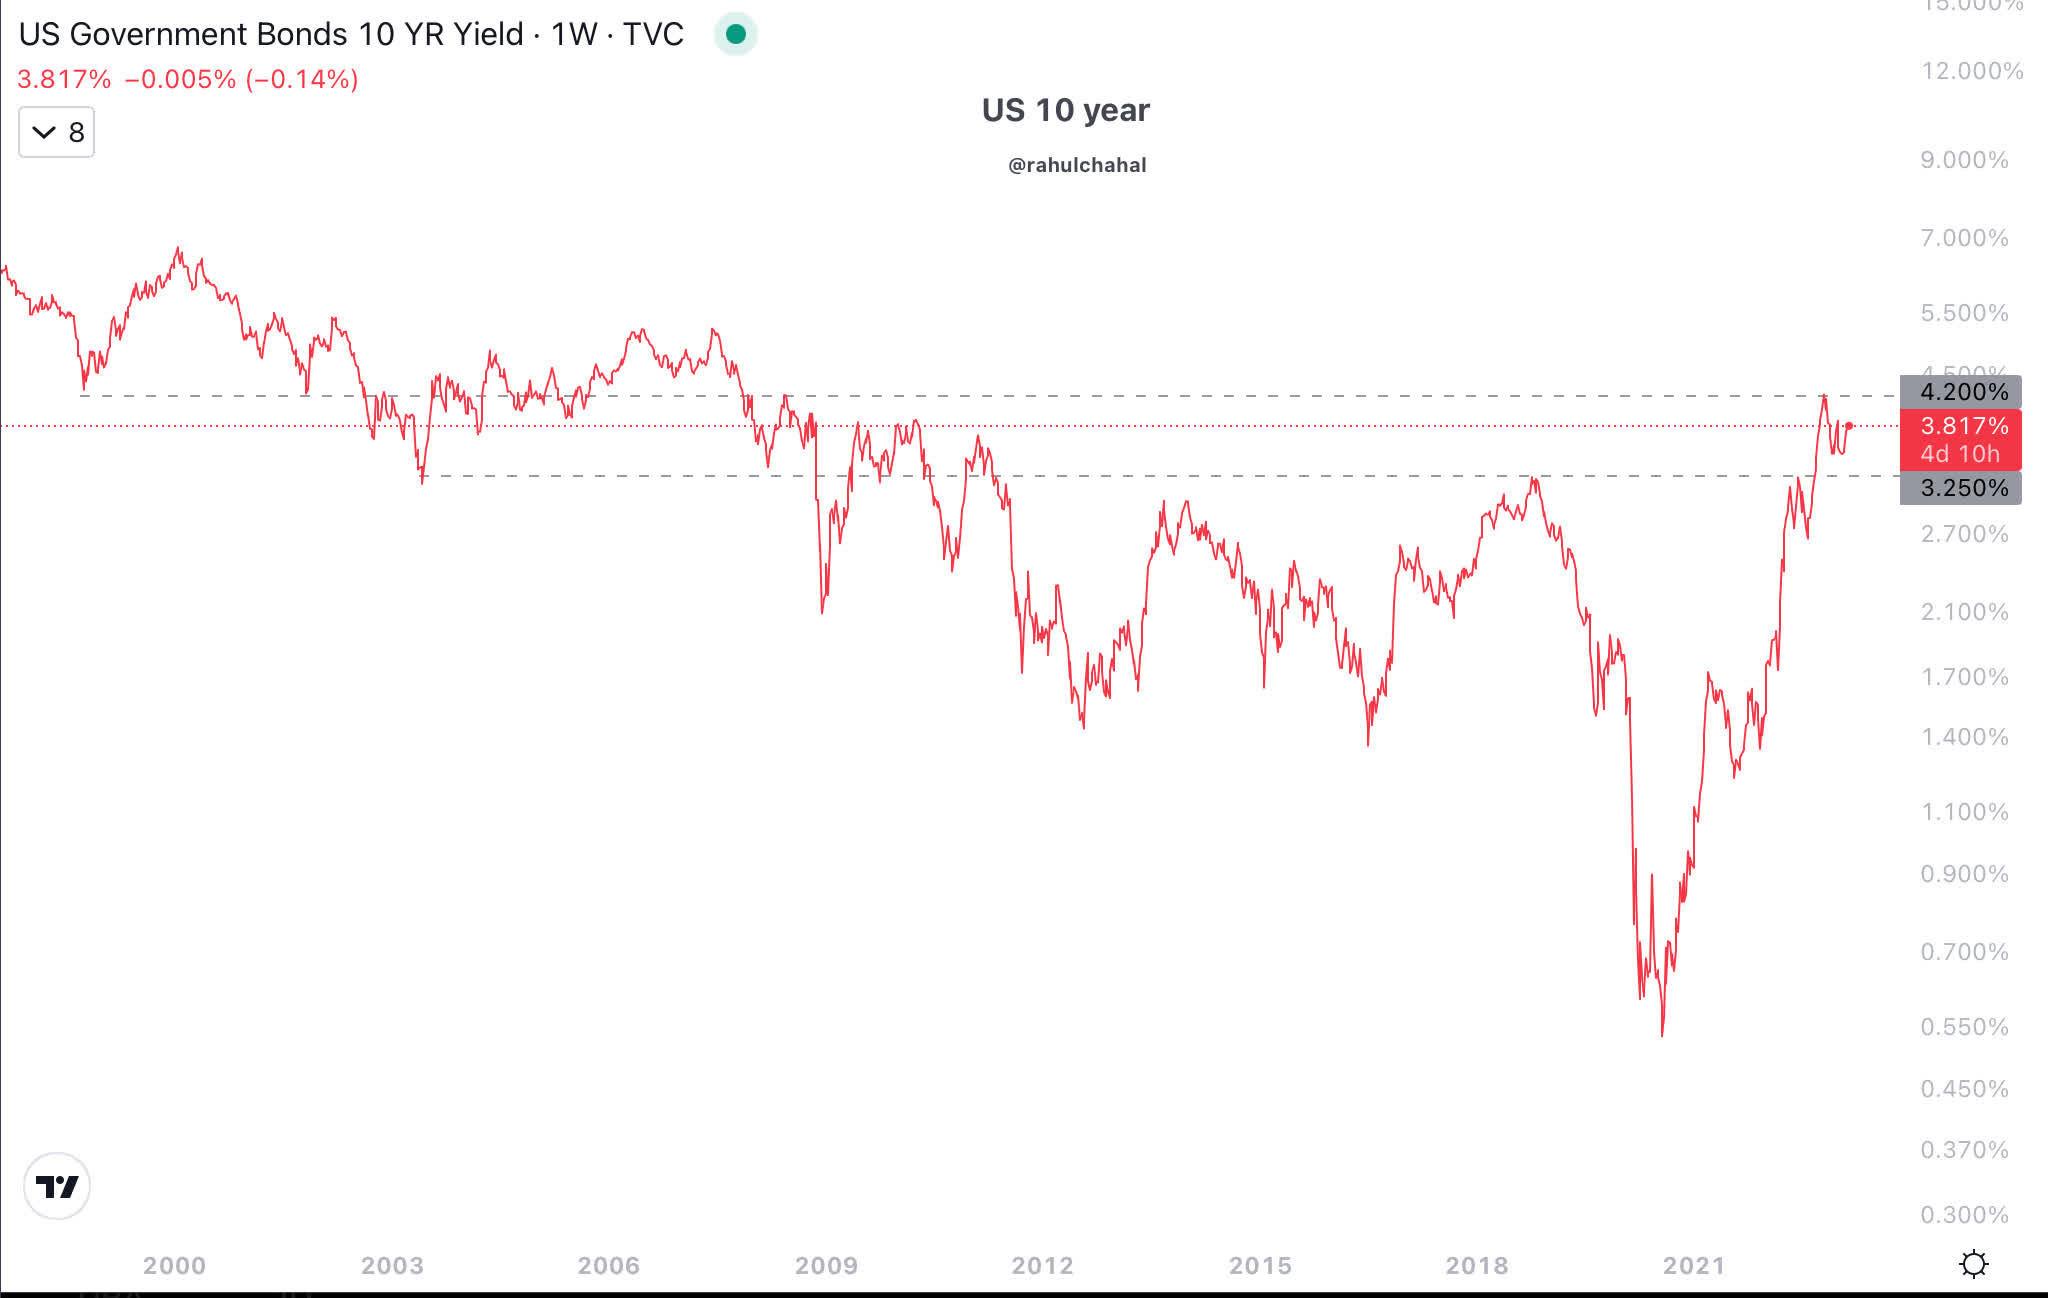
Inflation drives the bond market, which affects corporate earnings and valuation. This is due to the fact that investments of any kind are based off the risk-free rate from government securities like the U.S. treasuries.
The 10 year treasury bond has bounced up to around 3.8%, after dropping down to 3.5% in December 2022. Stock valuation and investor expectations might have to adjust with the change in risk-free rate. Higher 10 year would be a headwind for equities, especially considering the rich valuations in certain large-cap stocks and some tech stocks.
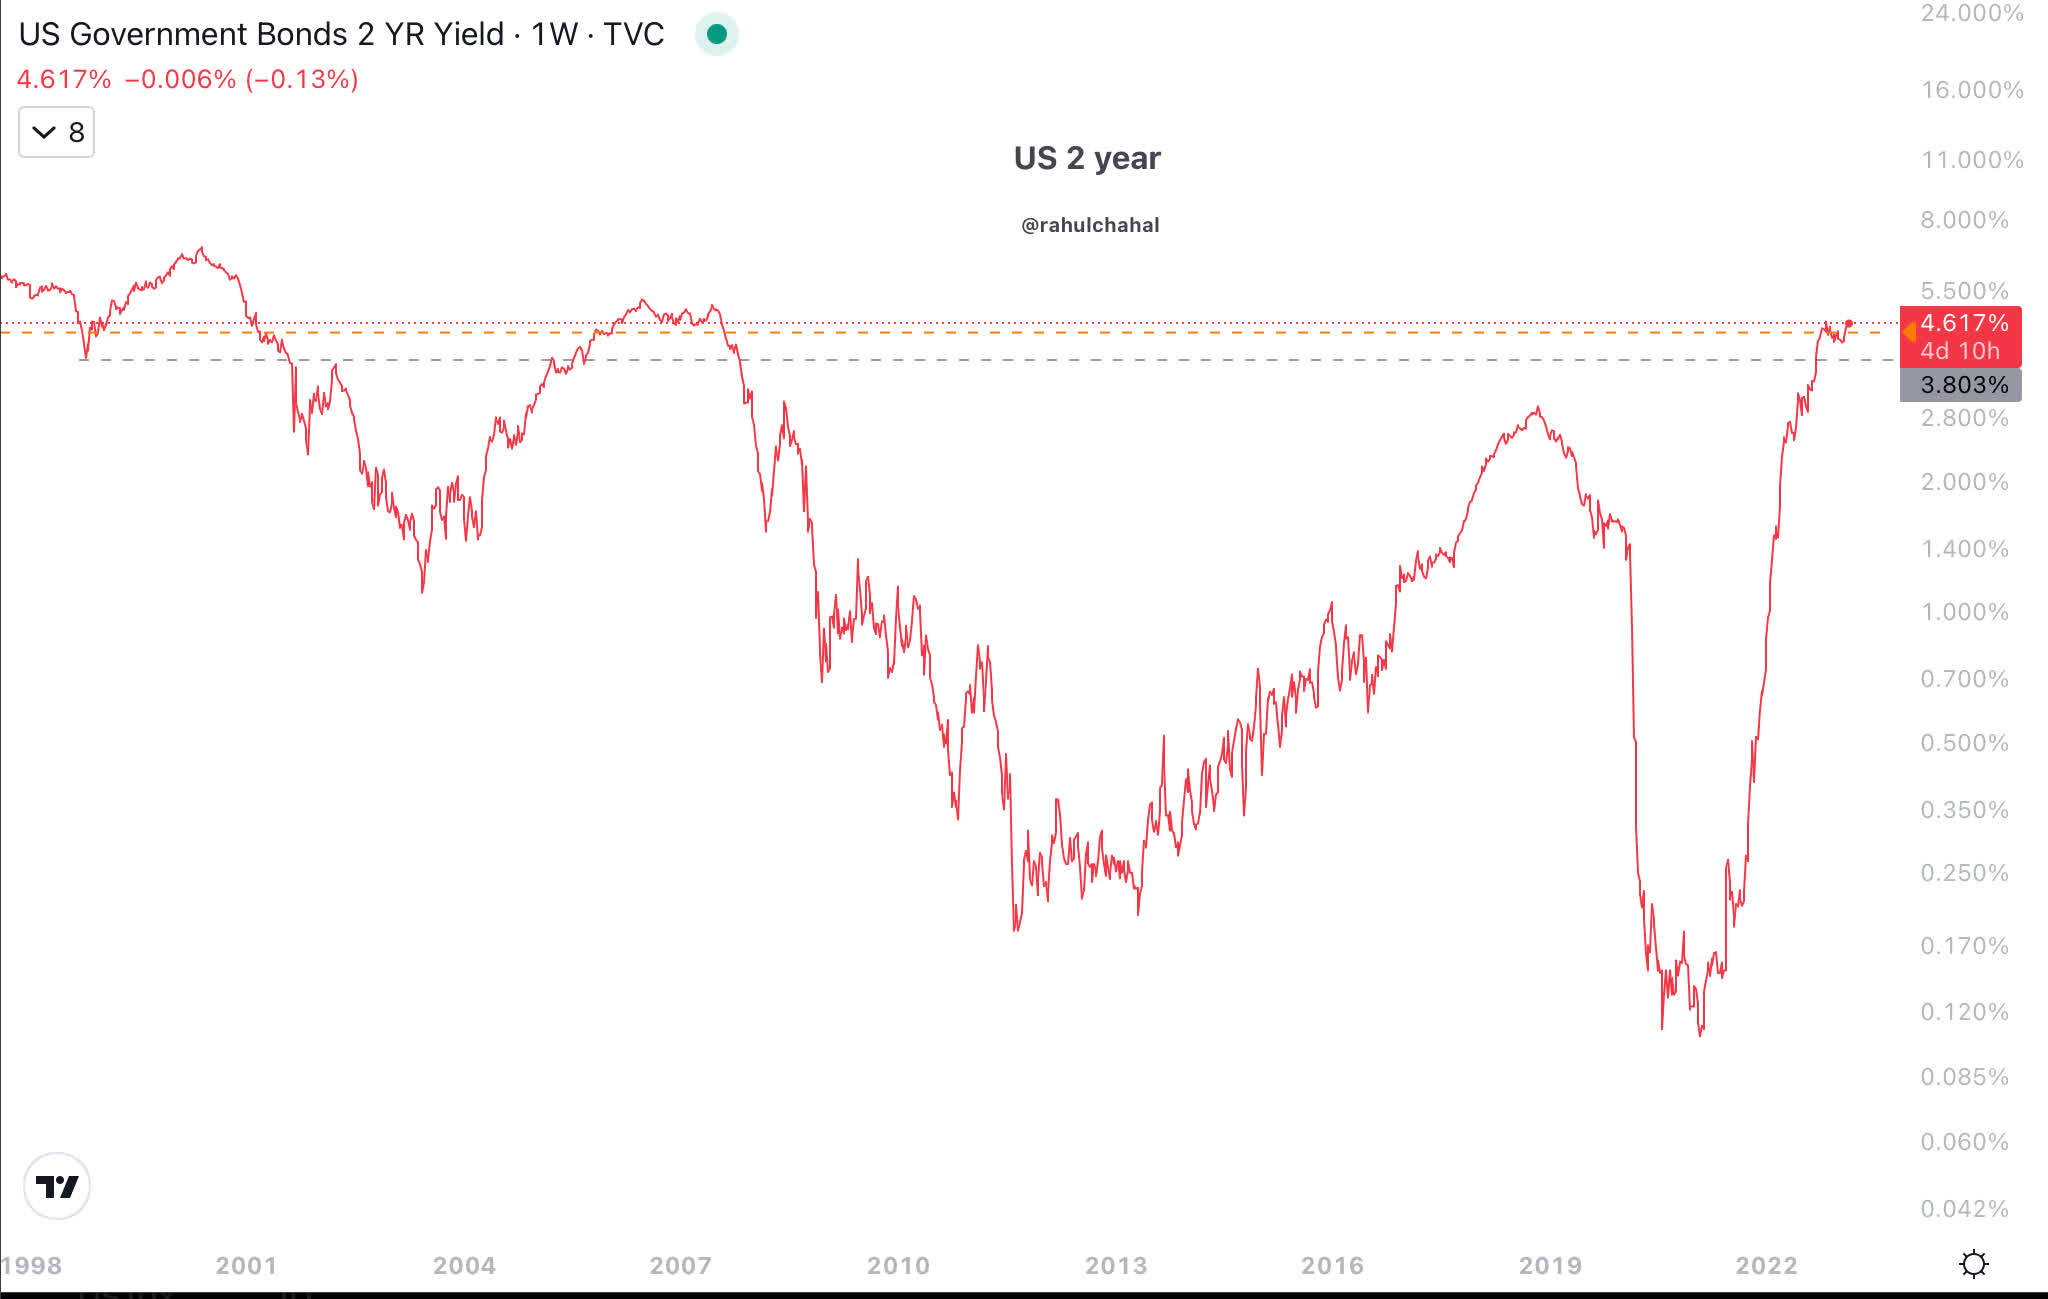
The 2 year treasury bond is at 4.6% and it has bounced from just above 4%.
Treasury yield curve is inverted and has been for weeks. Fed actions based on inflation and inflation expectations are driving interest rates and will for months to come.
Inverted Yield Curve (Guru focus)
Corporate Bond
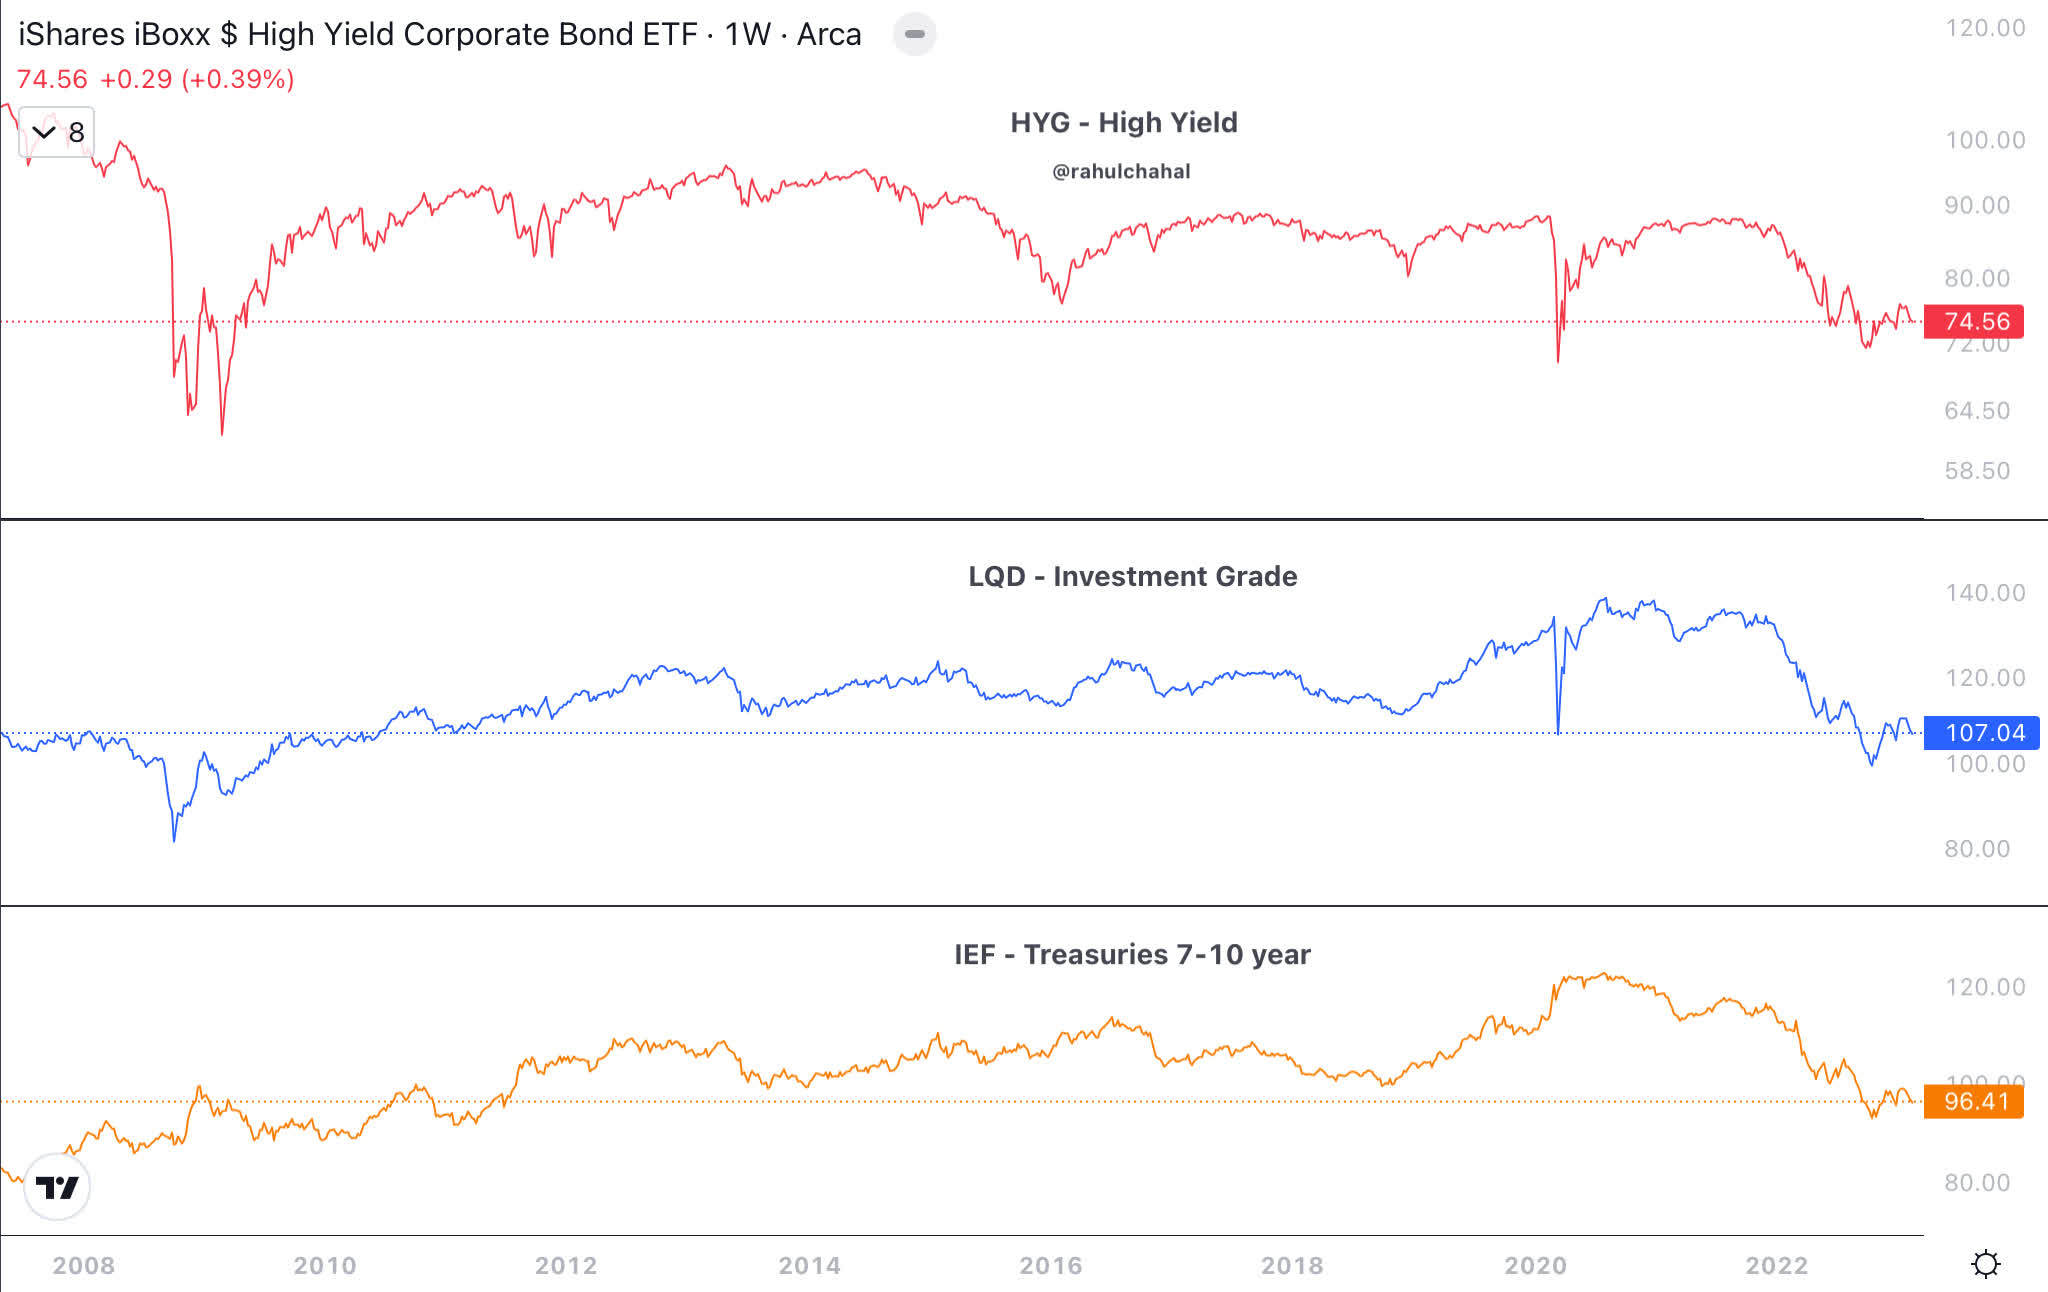
High Yield Corporate ( HYG ) and Investment Grade ( LQD ) are still at levels that convey higher levels of risk. The chart should be very concerning for those who are bullish equities.
Ratio Treasuries Corporate
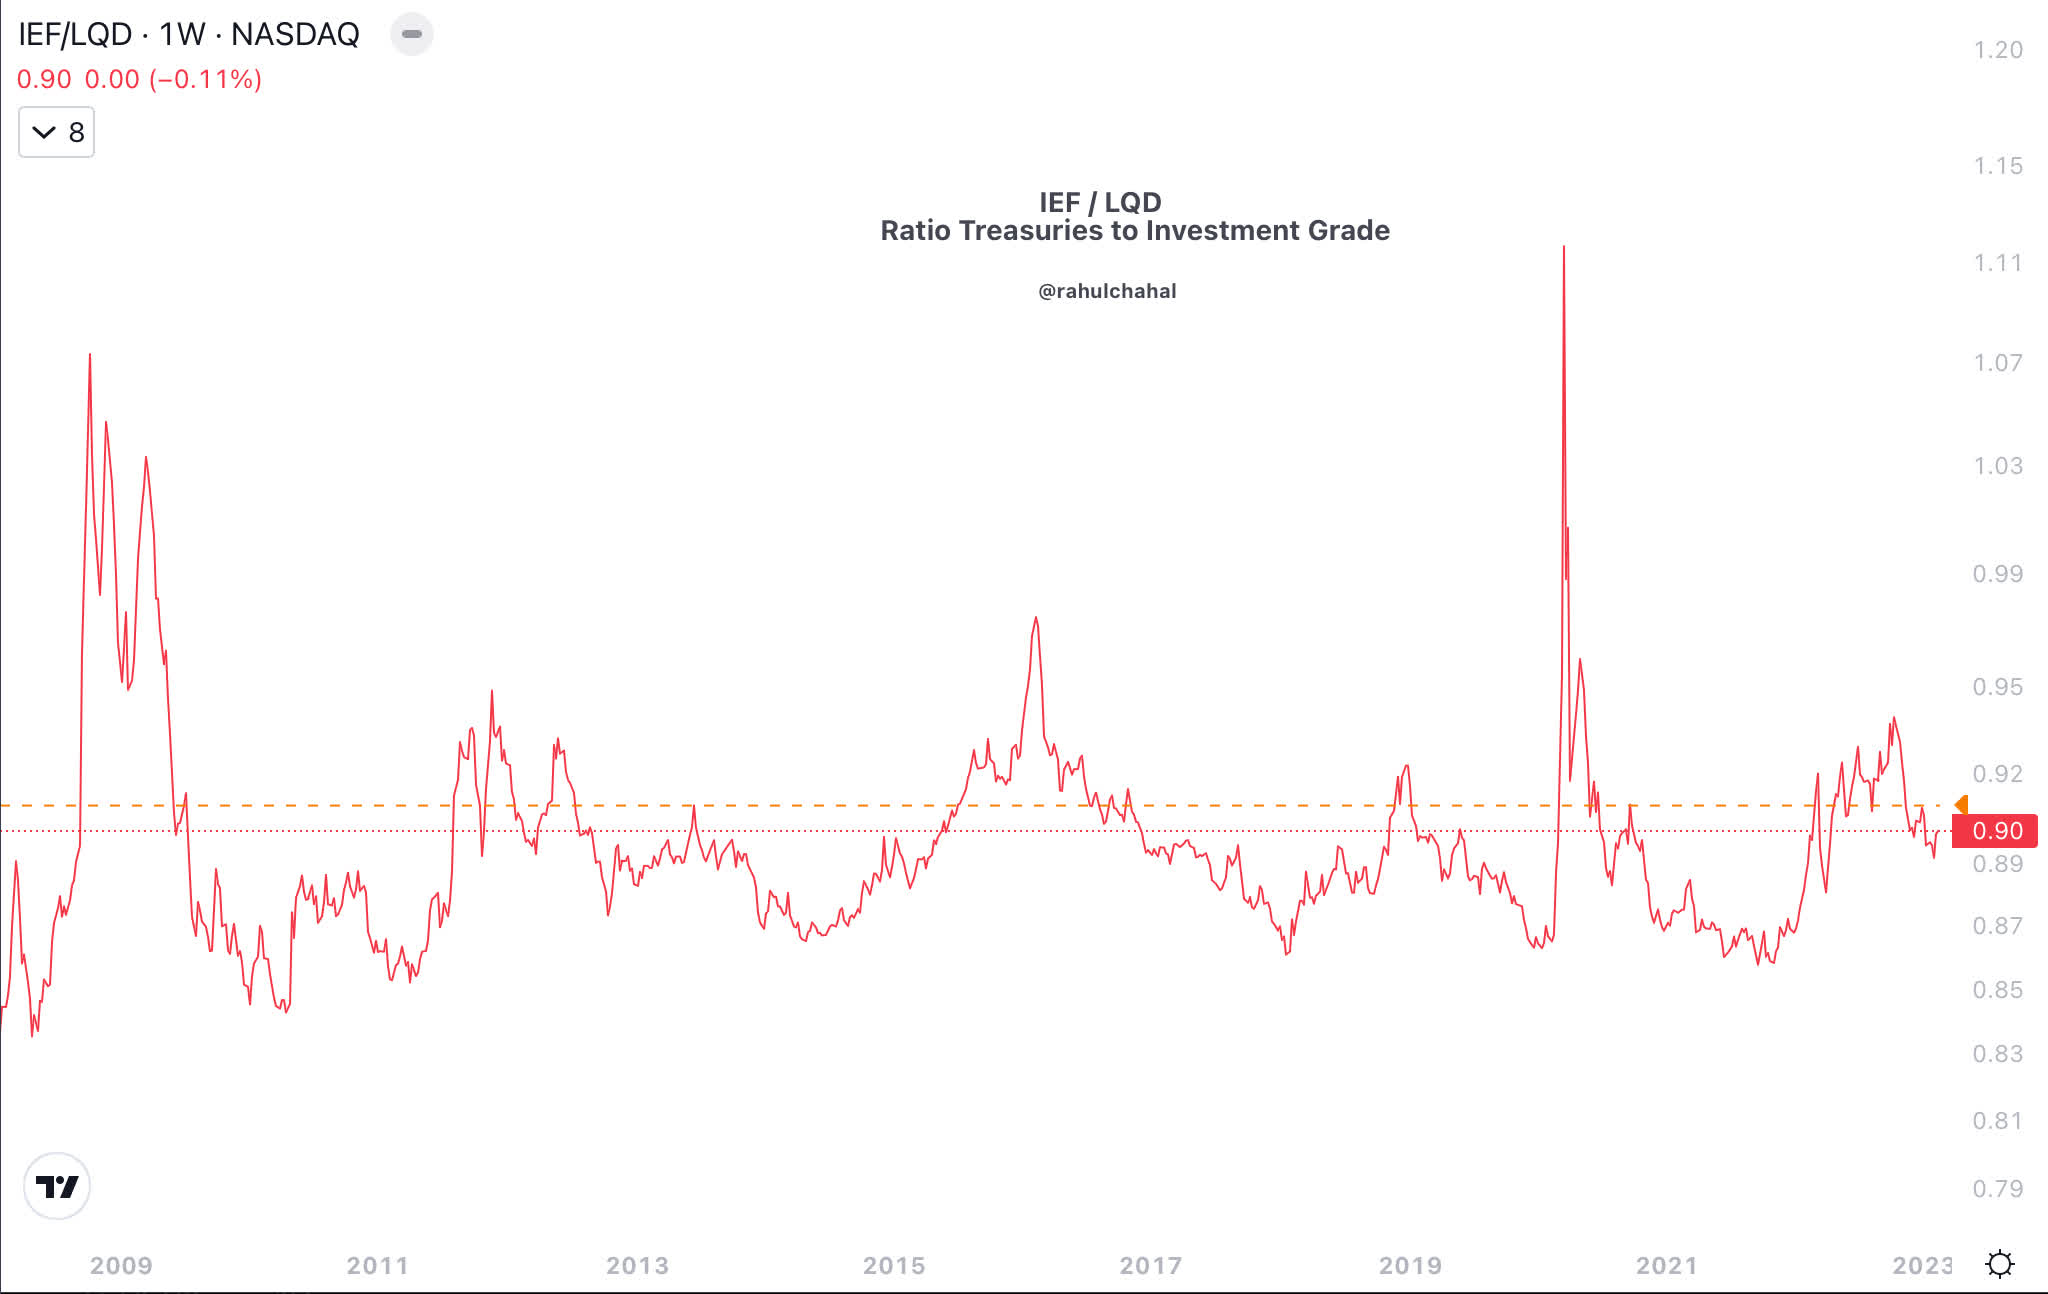
The ratio of treasuries ( IEF ) to investment grade corporate bonds ( LQD ) helps determine risk-on or risk-off environment, as is determined collectively by bond investors. Below is the chart of IEF/LQD, which shows there is elevated level of risk.
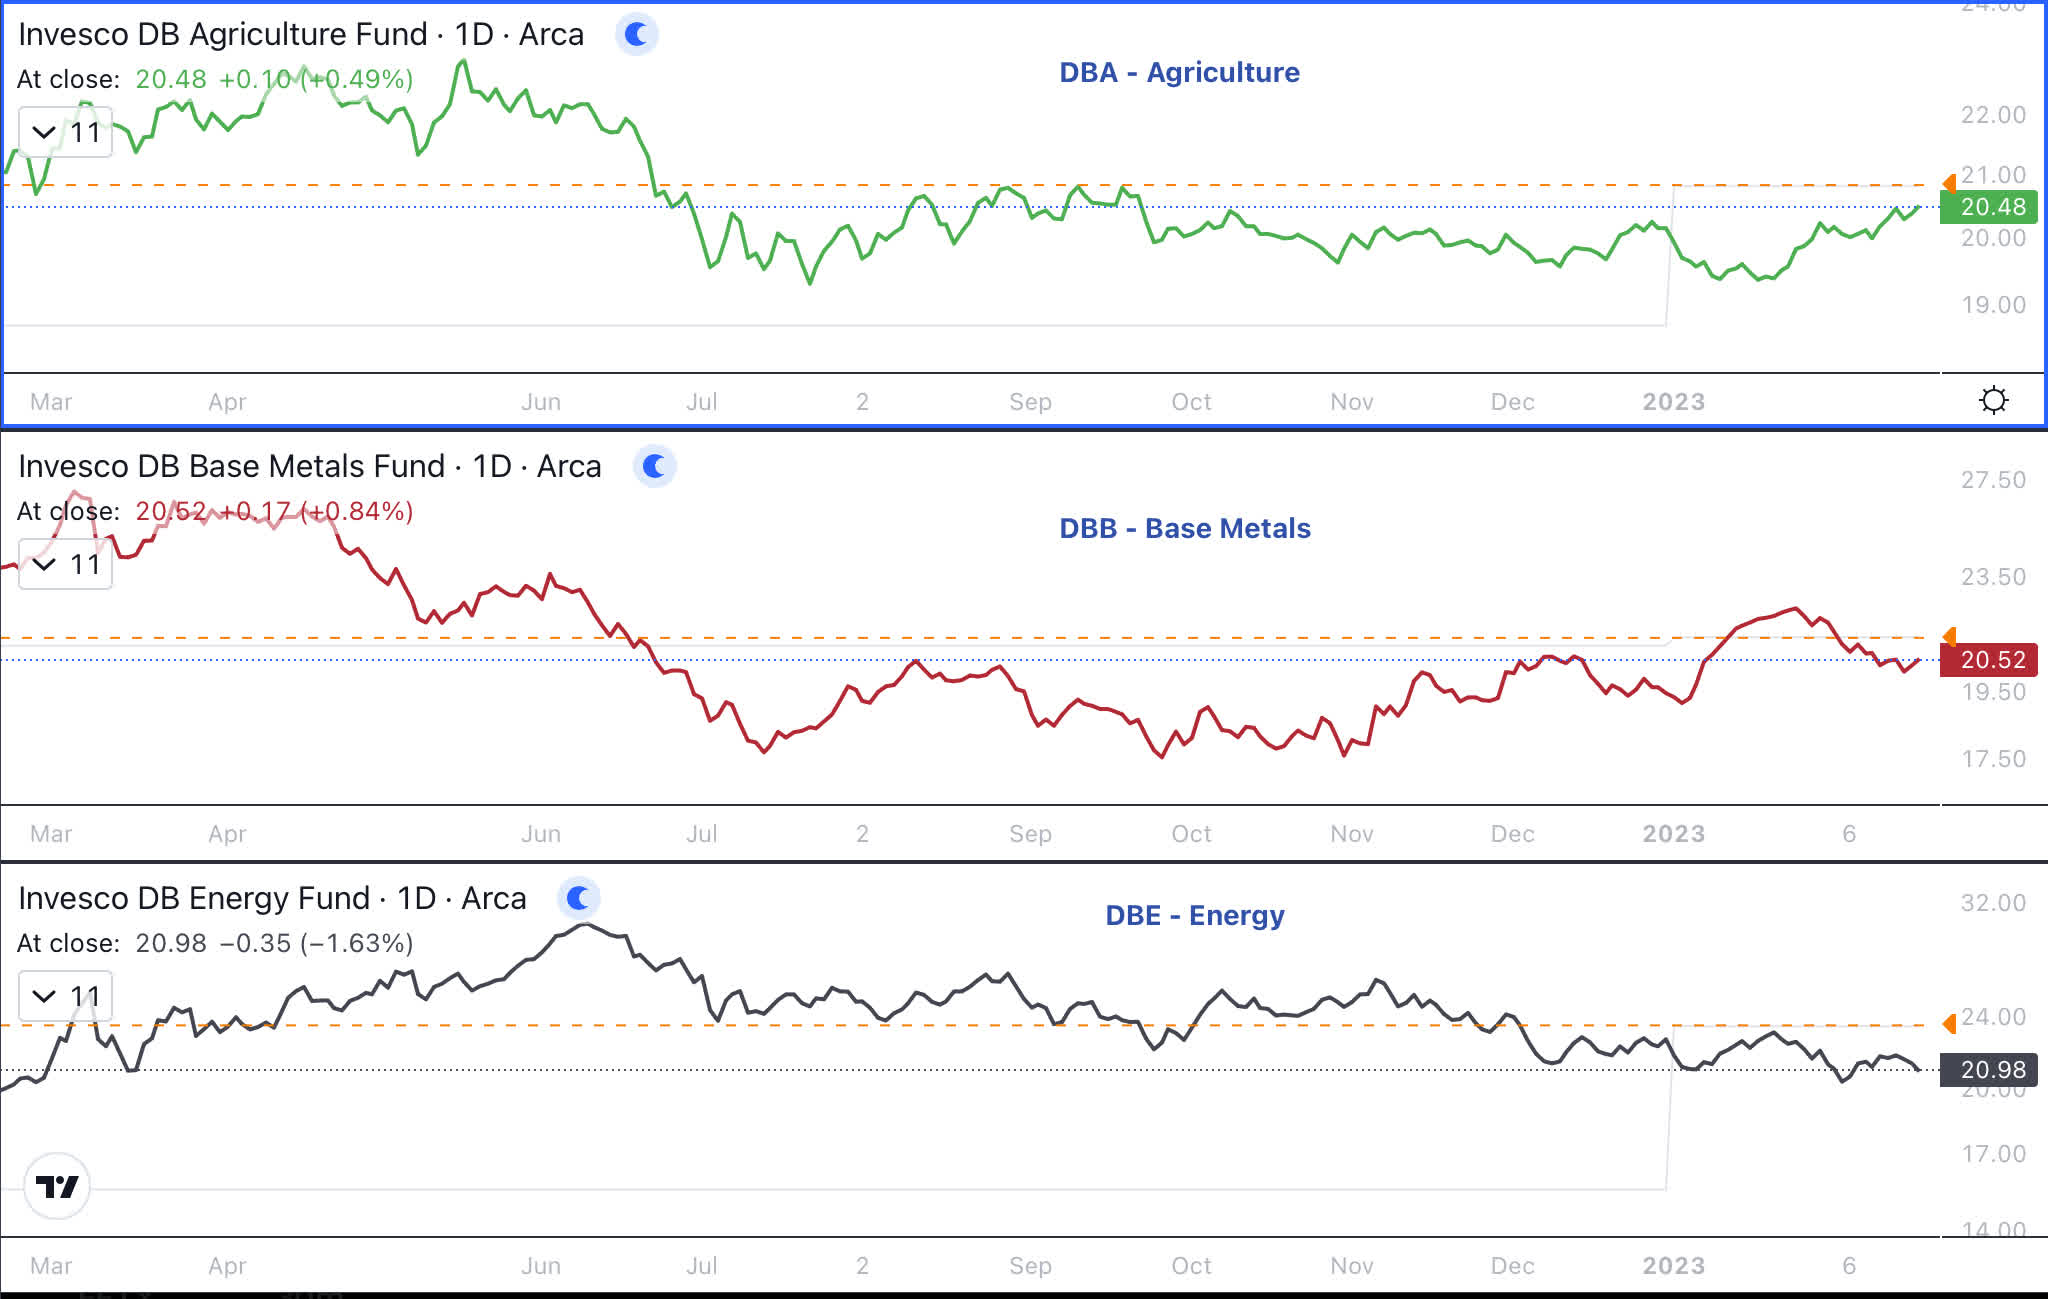
Commodities
DBA and DBC which track agriculture and energy commodities are trending lower. DBB which tracks base metals had moved higher possibly due to China reopening, but is trending lower again. Based on these charts, as long as prices of commodities do not move measurably higher, they will be supportive in reducing inflation in the coming months.
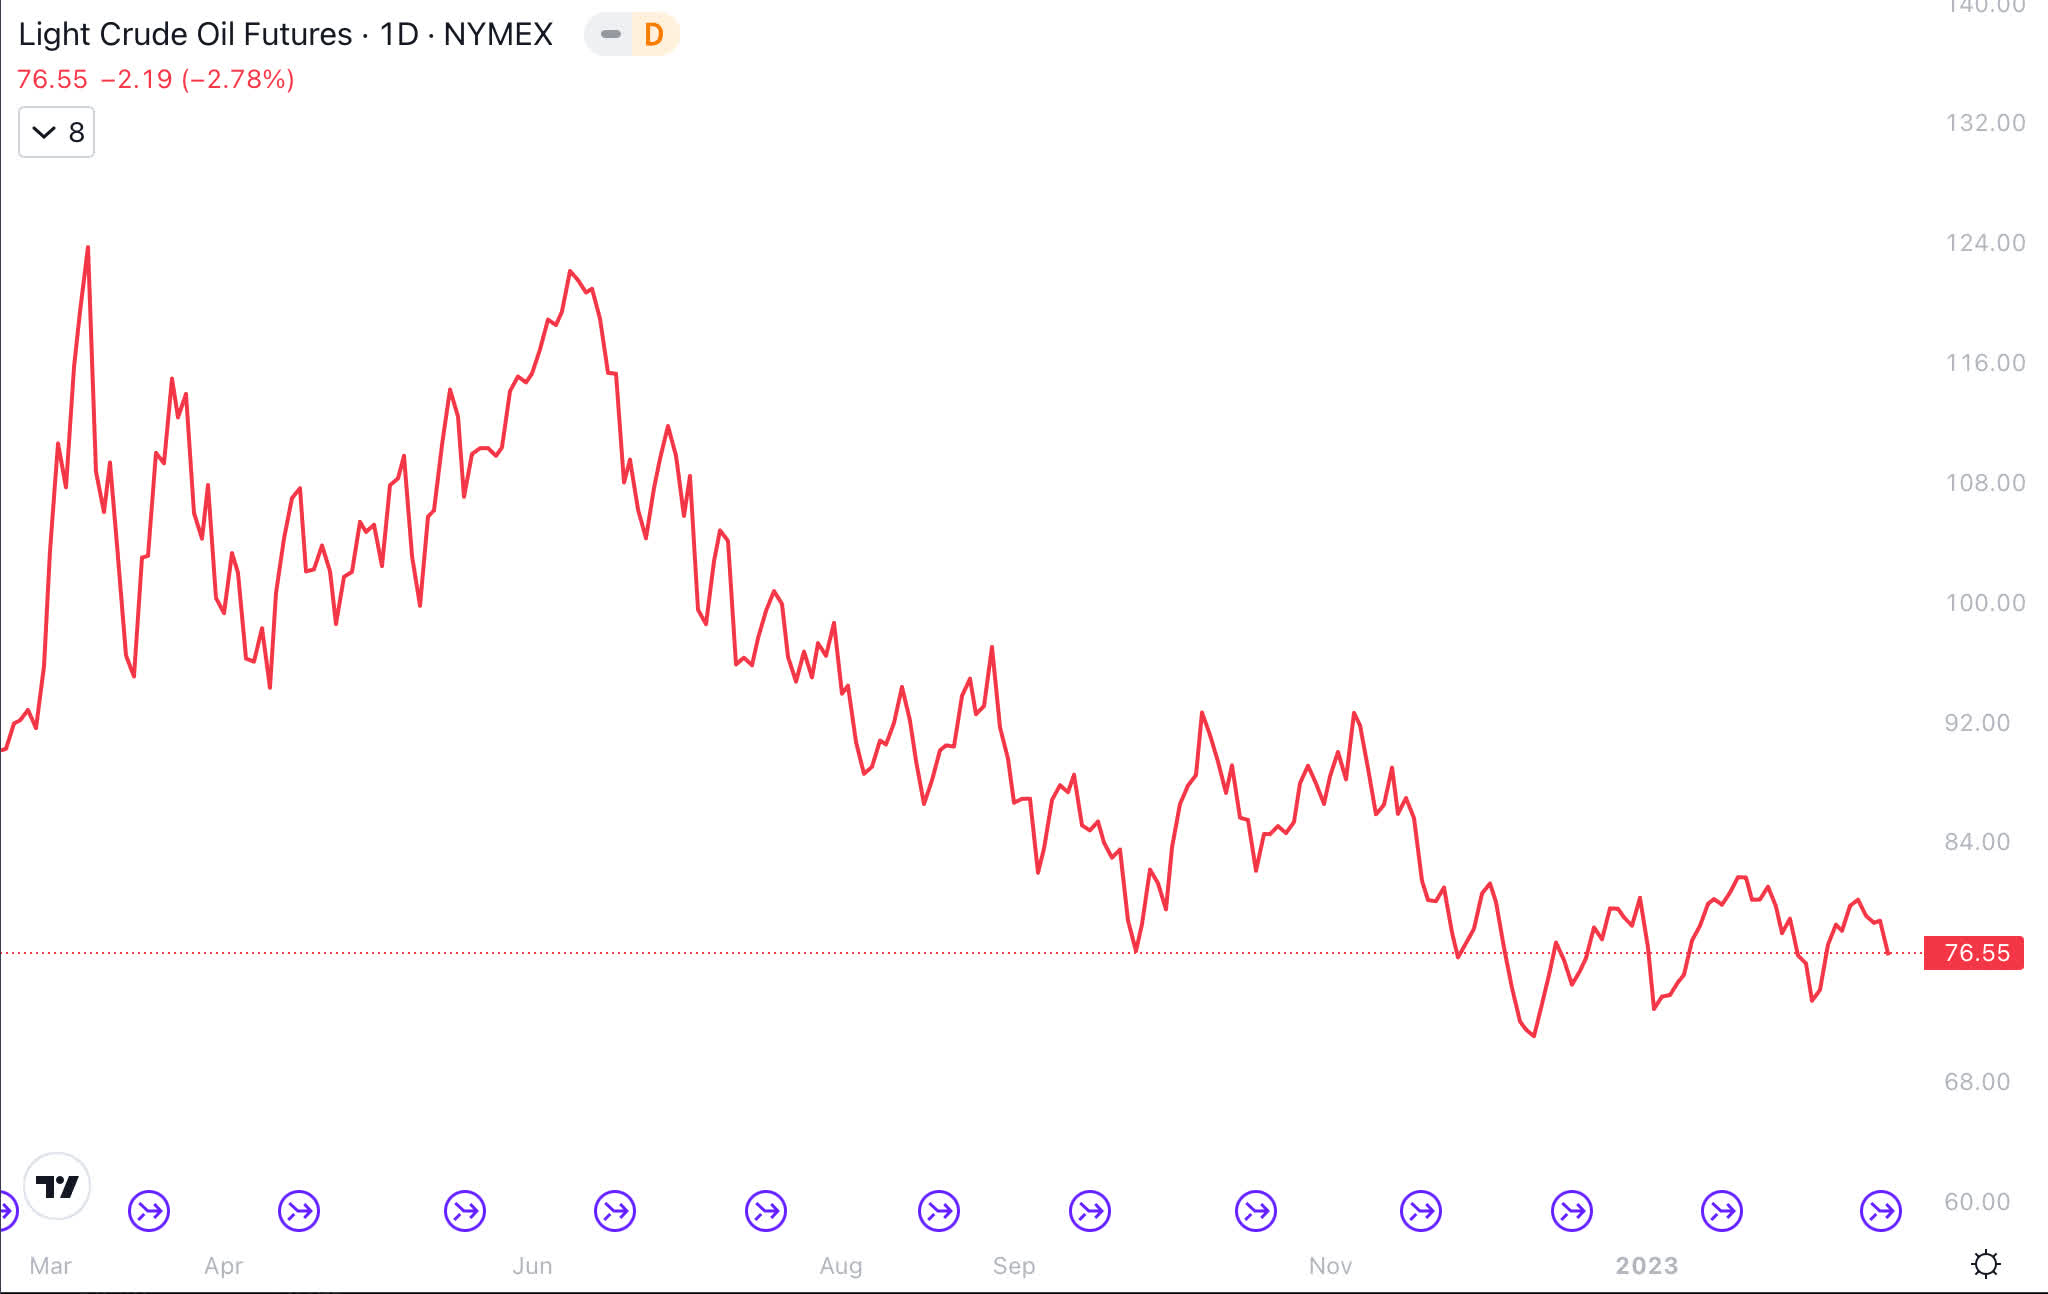
Crude Oil
WTI crude oil, which is closely followed by the market has gone down and is on the verge of breaking down. While it reduces inflation and is a boost to the consumers in their ability to spend, it could also indicate a slowing global economy.
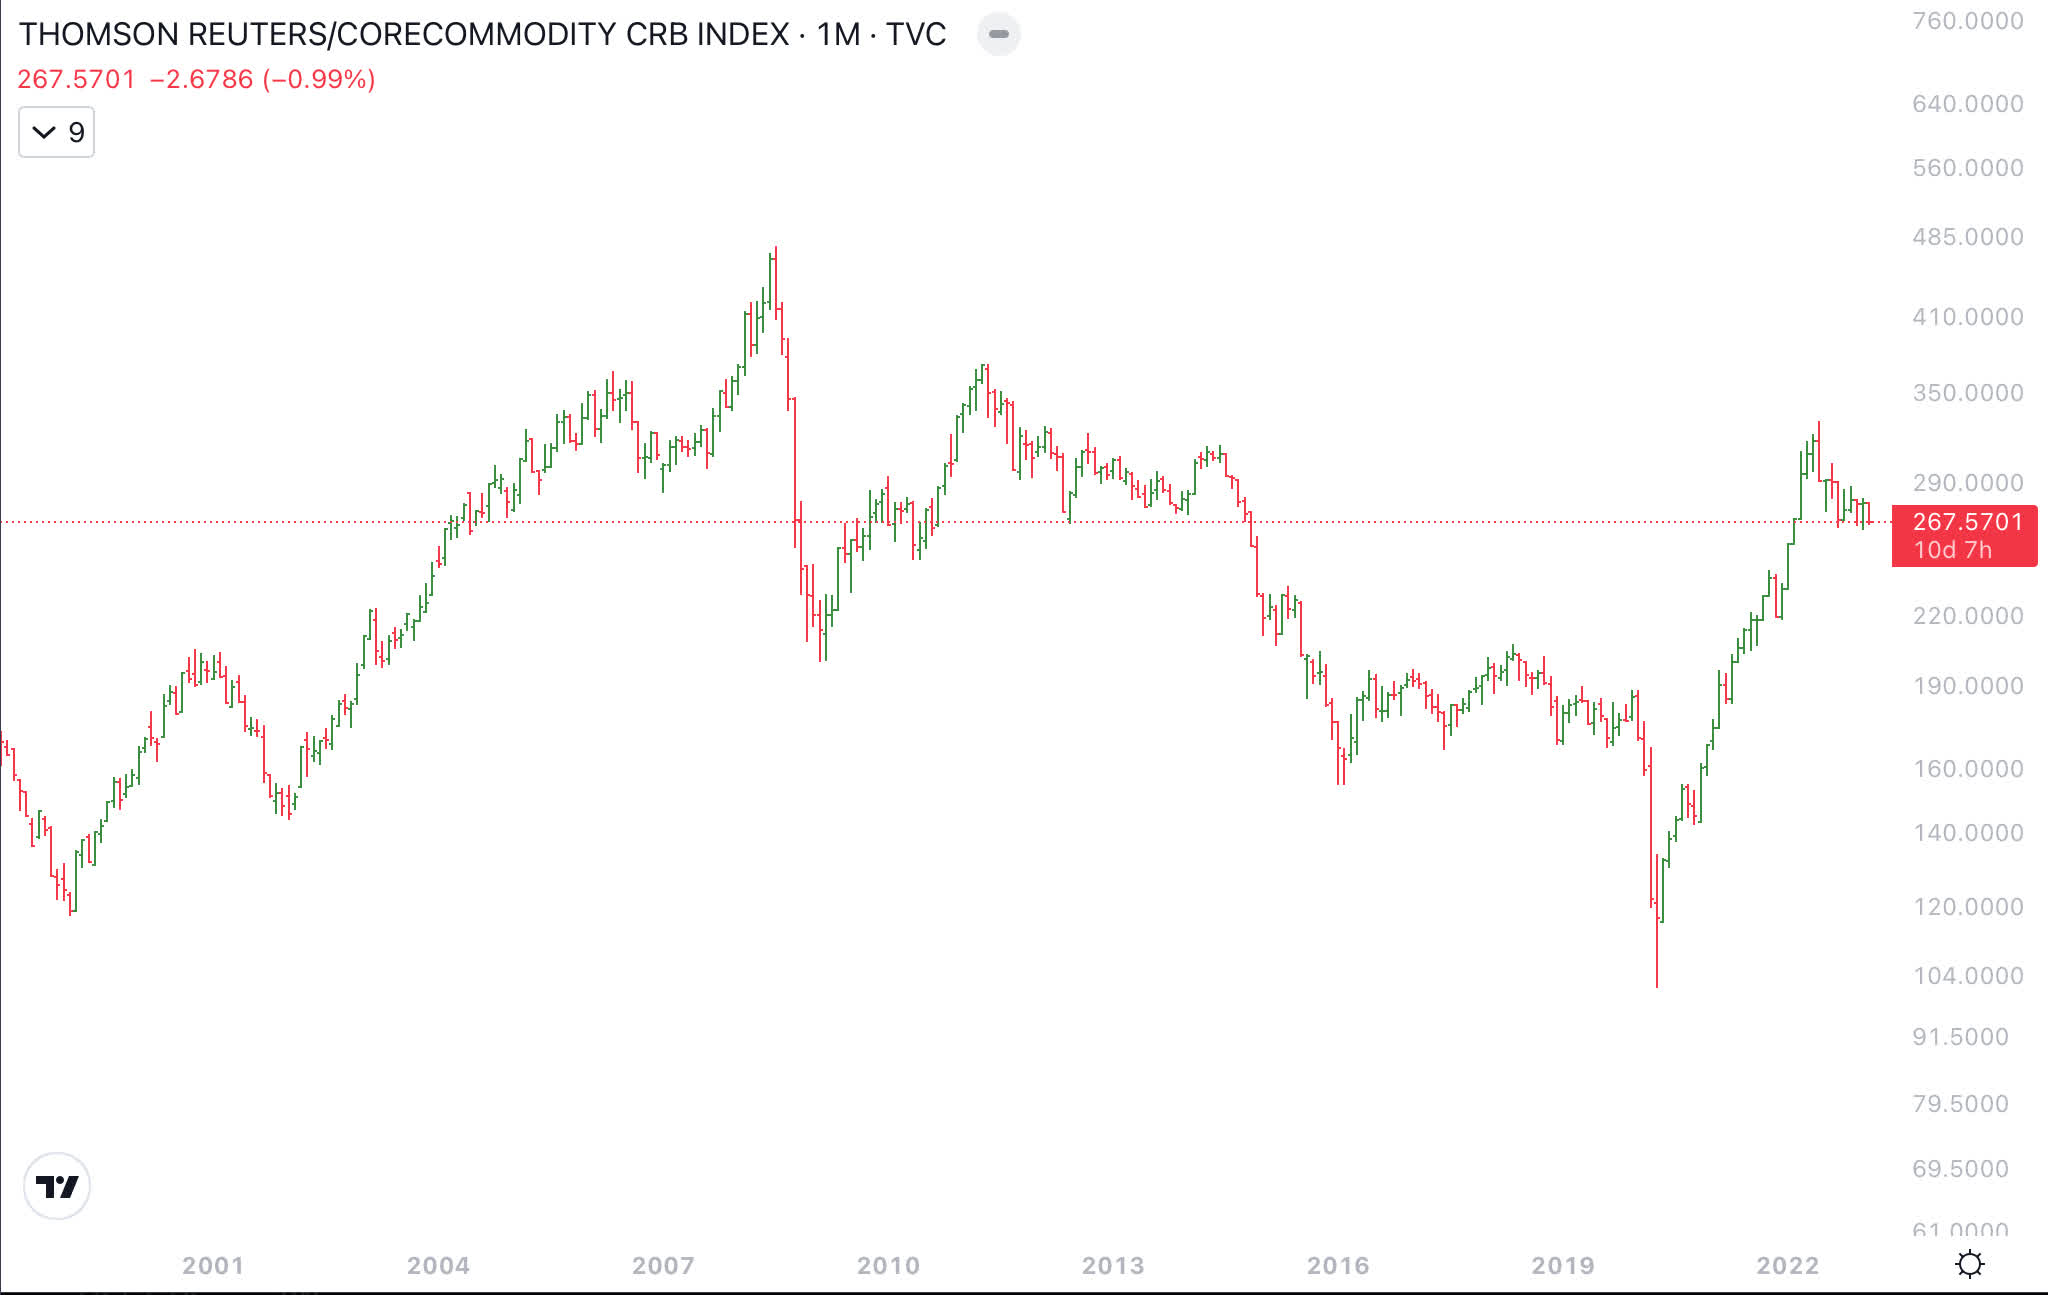
Thompson Reuters Core Commodities CRB Index which reflects combined prices of 17 exchange-traded commodities futures contracts has pulled back since peaking in June 2022. Continuation of lower prices will be key to inflation outlook.
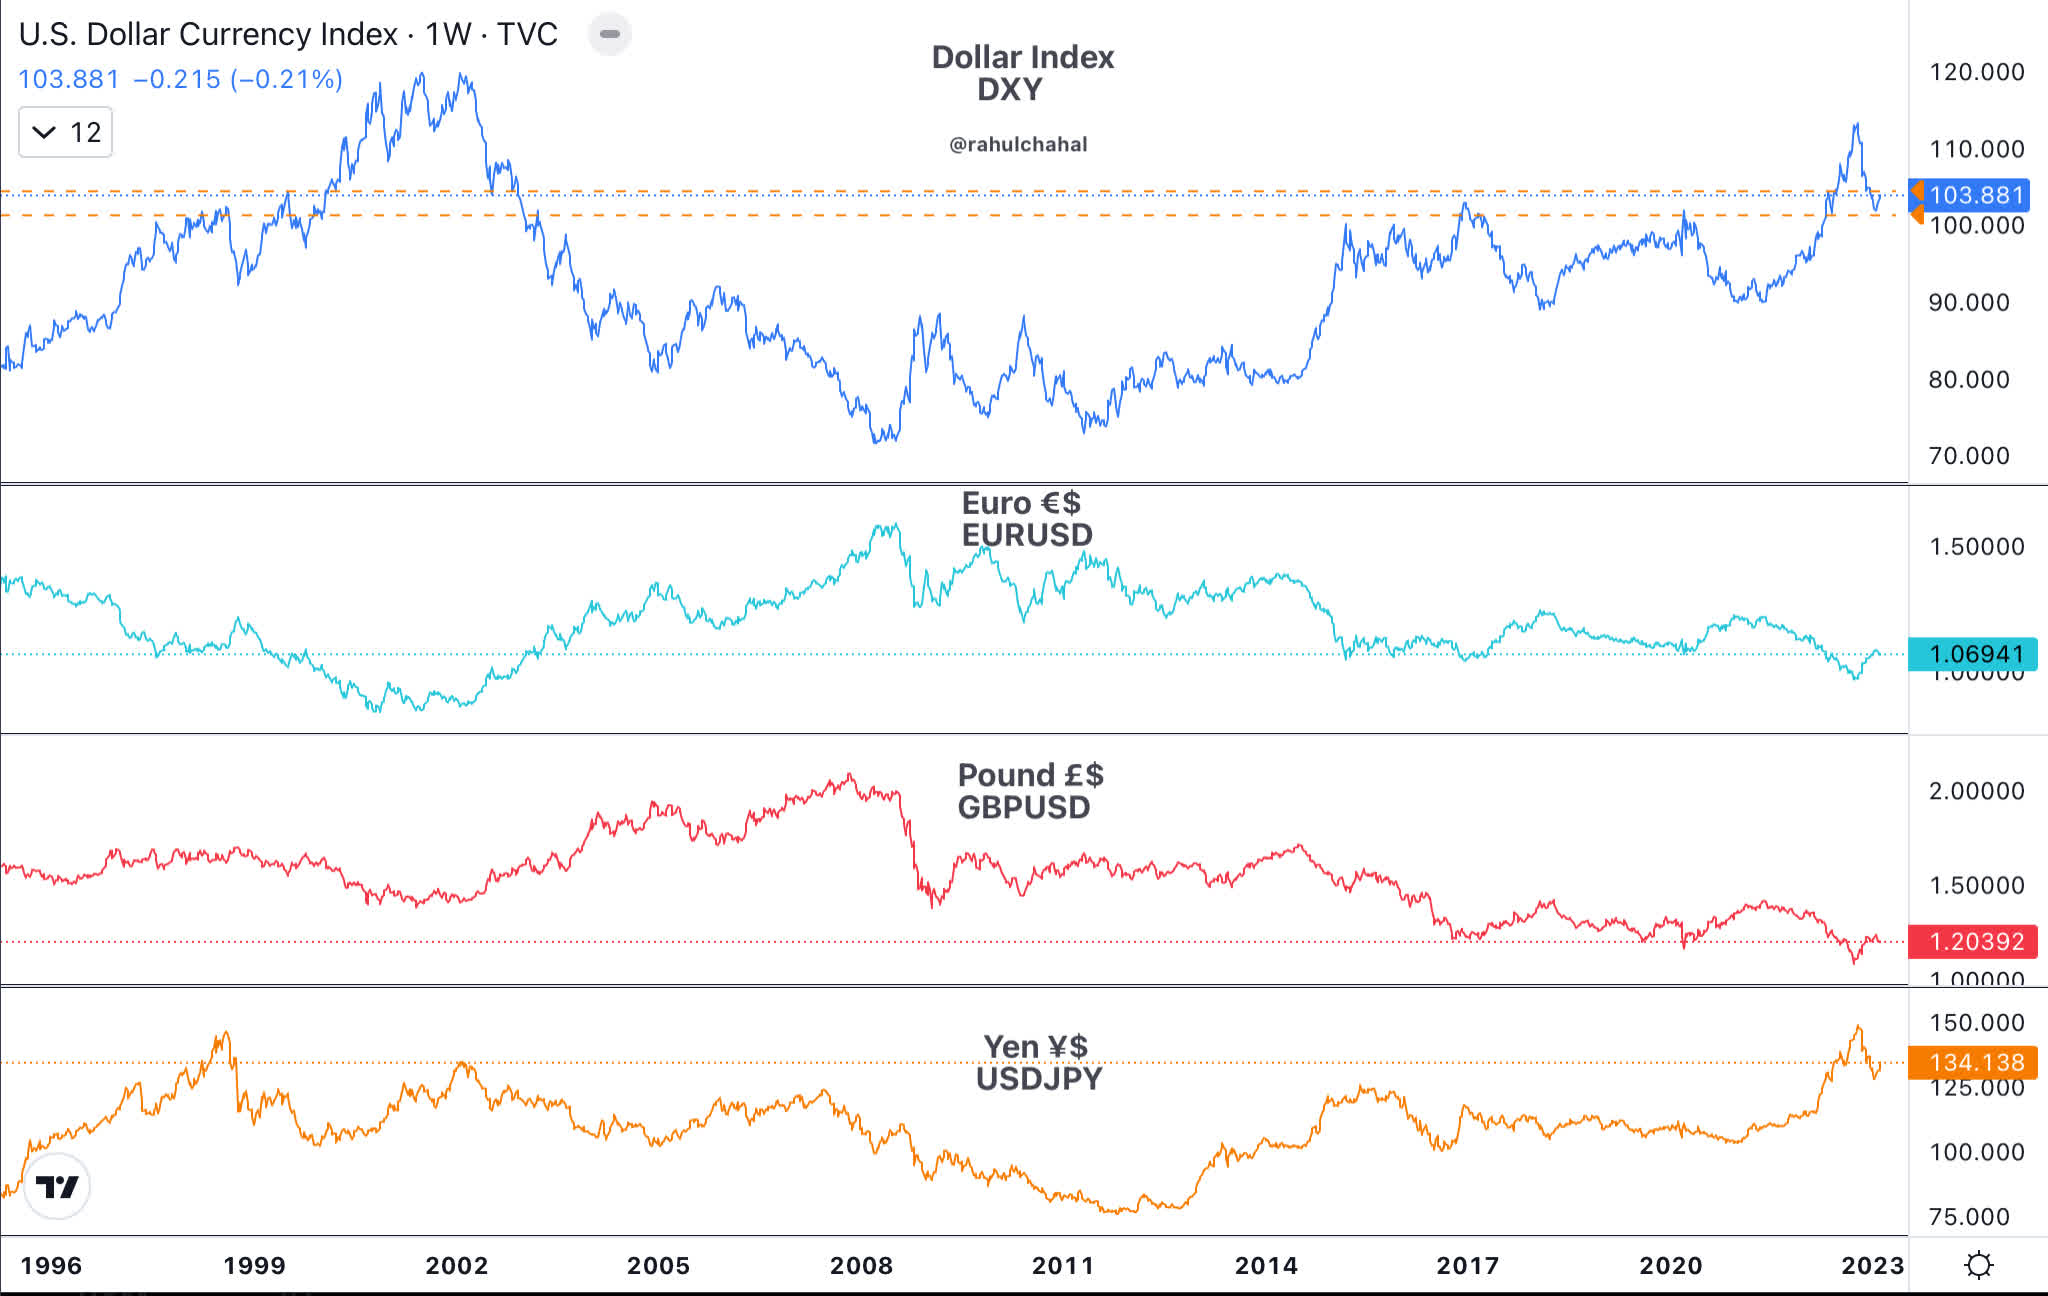
Dollar Index
The U.S. Dollar Index has pulled back after topping at 114.8 in September 2022. Dollar Index below 105 would be supportive for stocks.
Stock Market
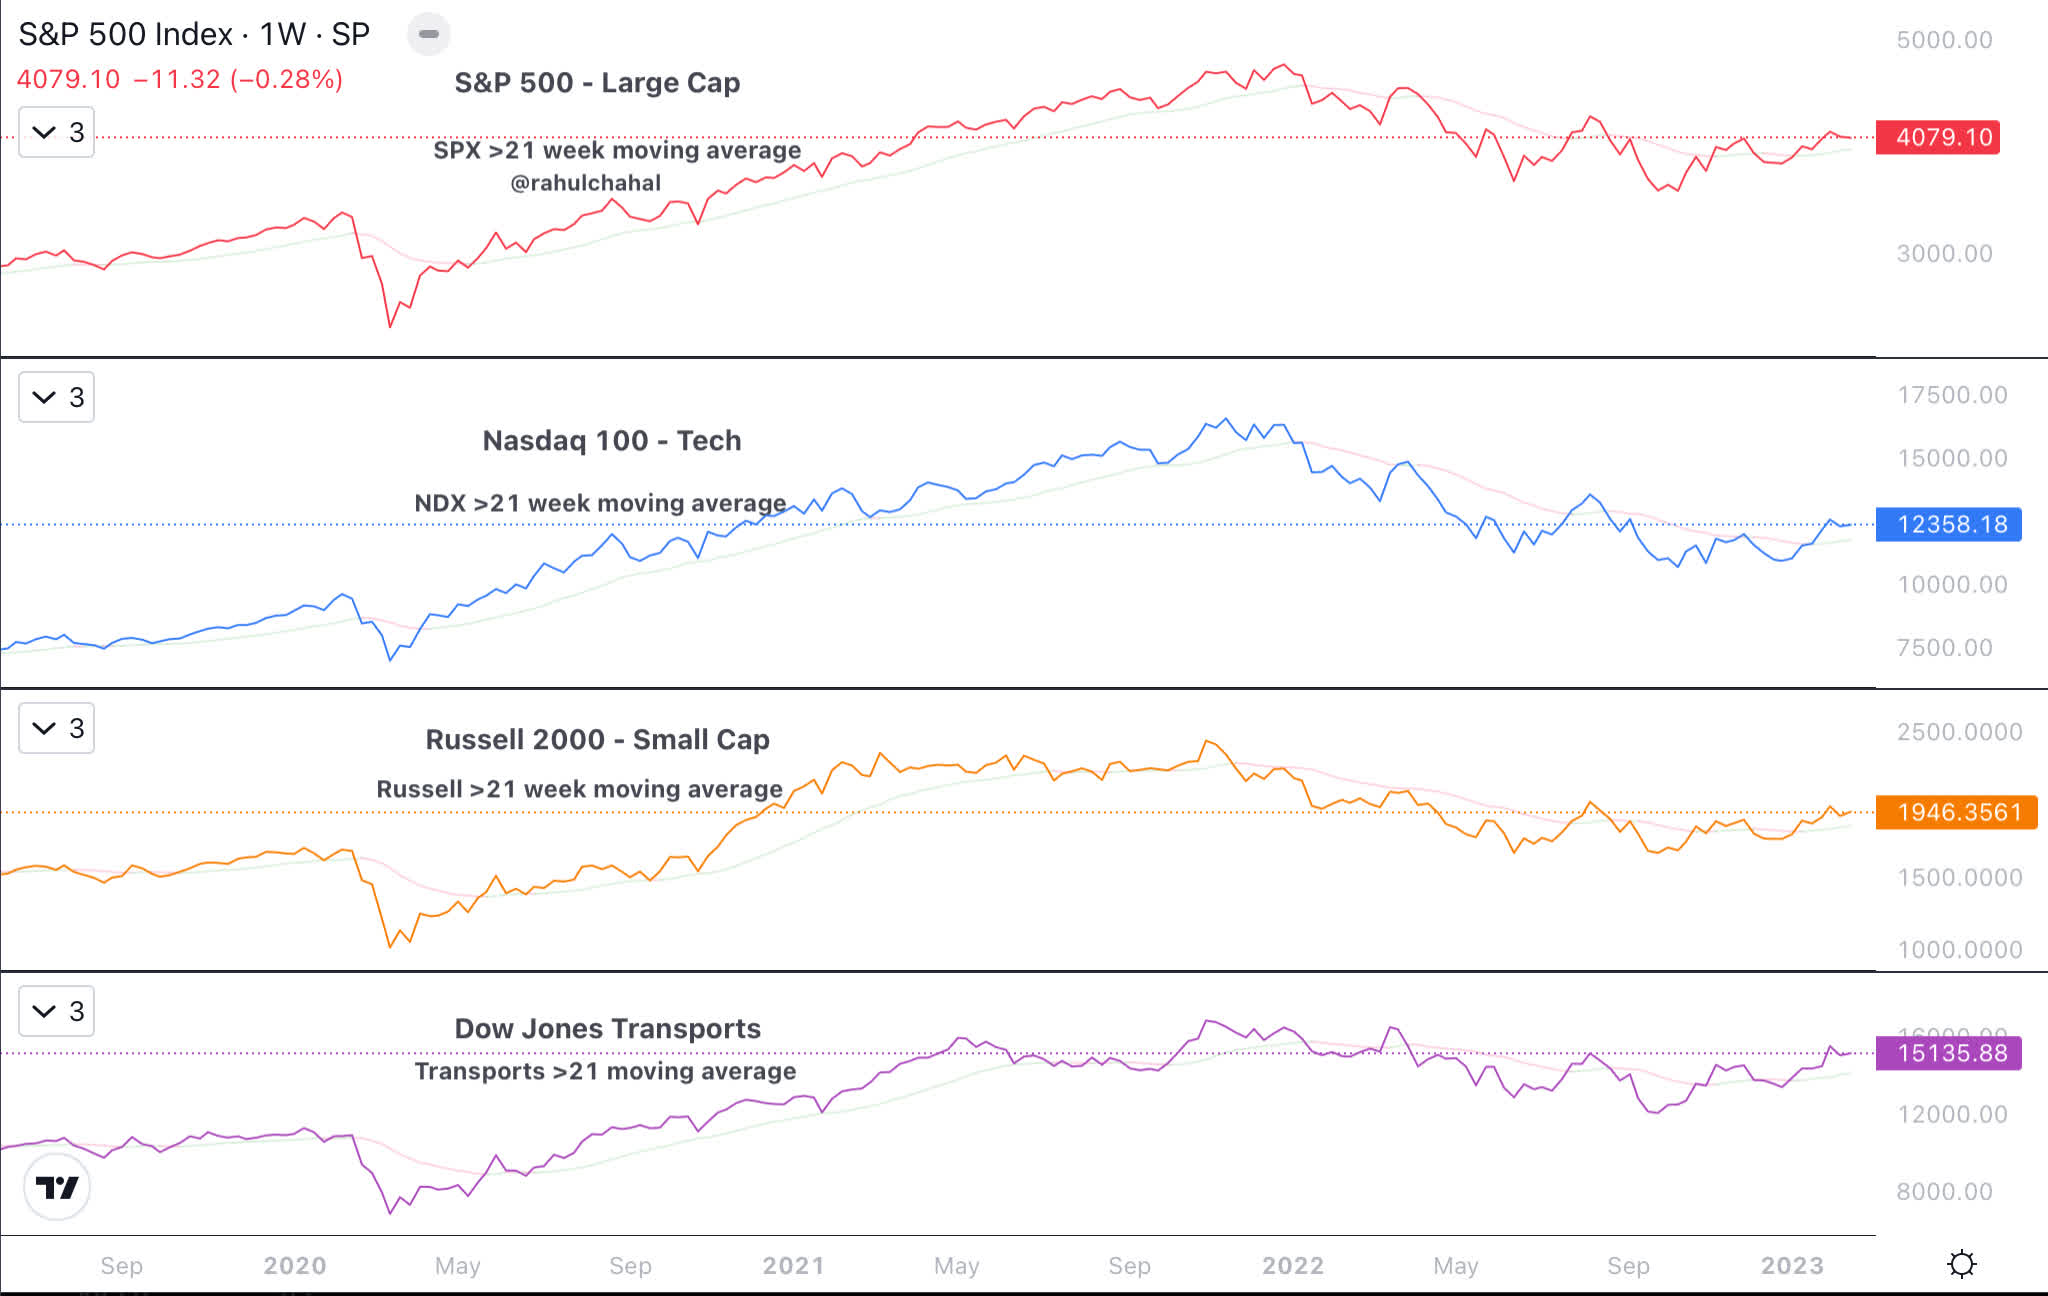
The weekly chart of the S&P 500 has been indecisive past two week. For the uptrend to resume, the SP500 needs break above 4200 and on pullback remain above 3900. If that were to happen, then it would be the first step toward starting an uptrend. The charts below shows S&P 500, NASDAQ 100 ( NDX ), Russell 2000 (RUT) and Dow Transportation index ( DJT ). On a weekly basis, all of them are above their 21-week moving averages.
Chart S&P 500
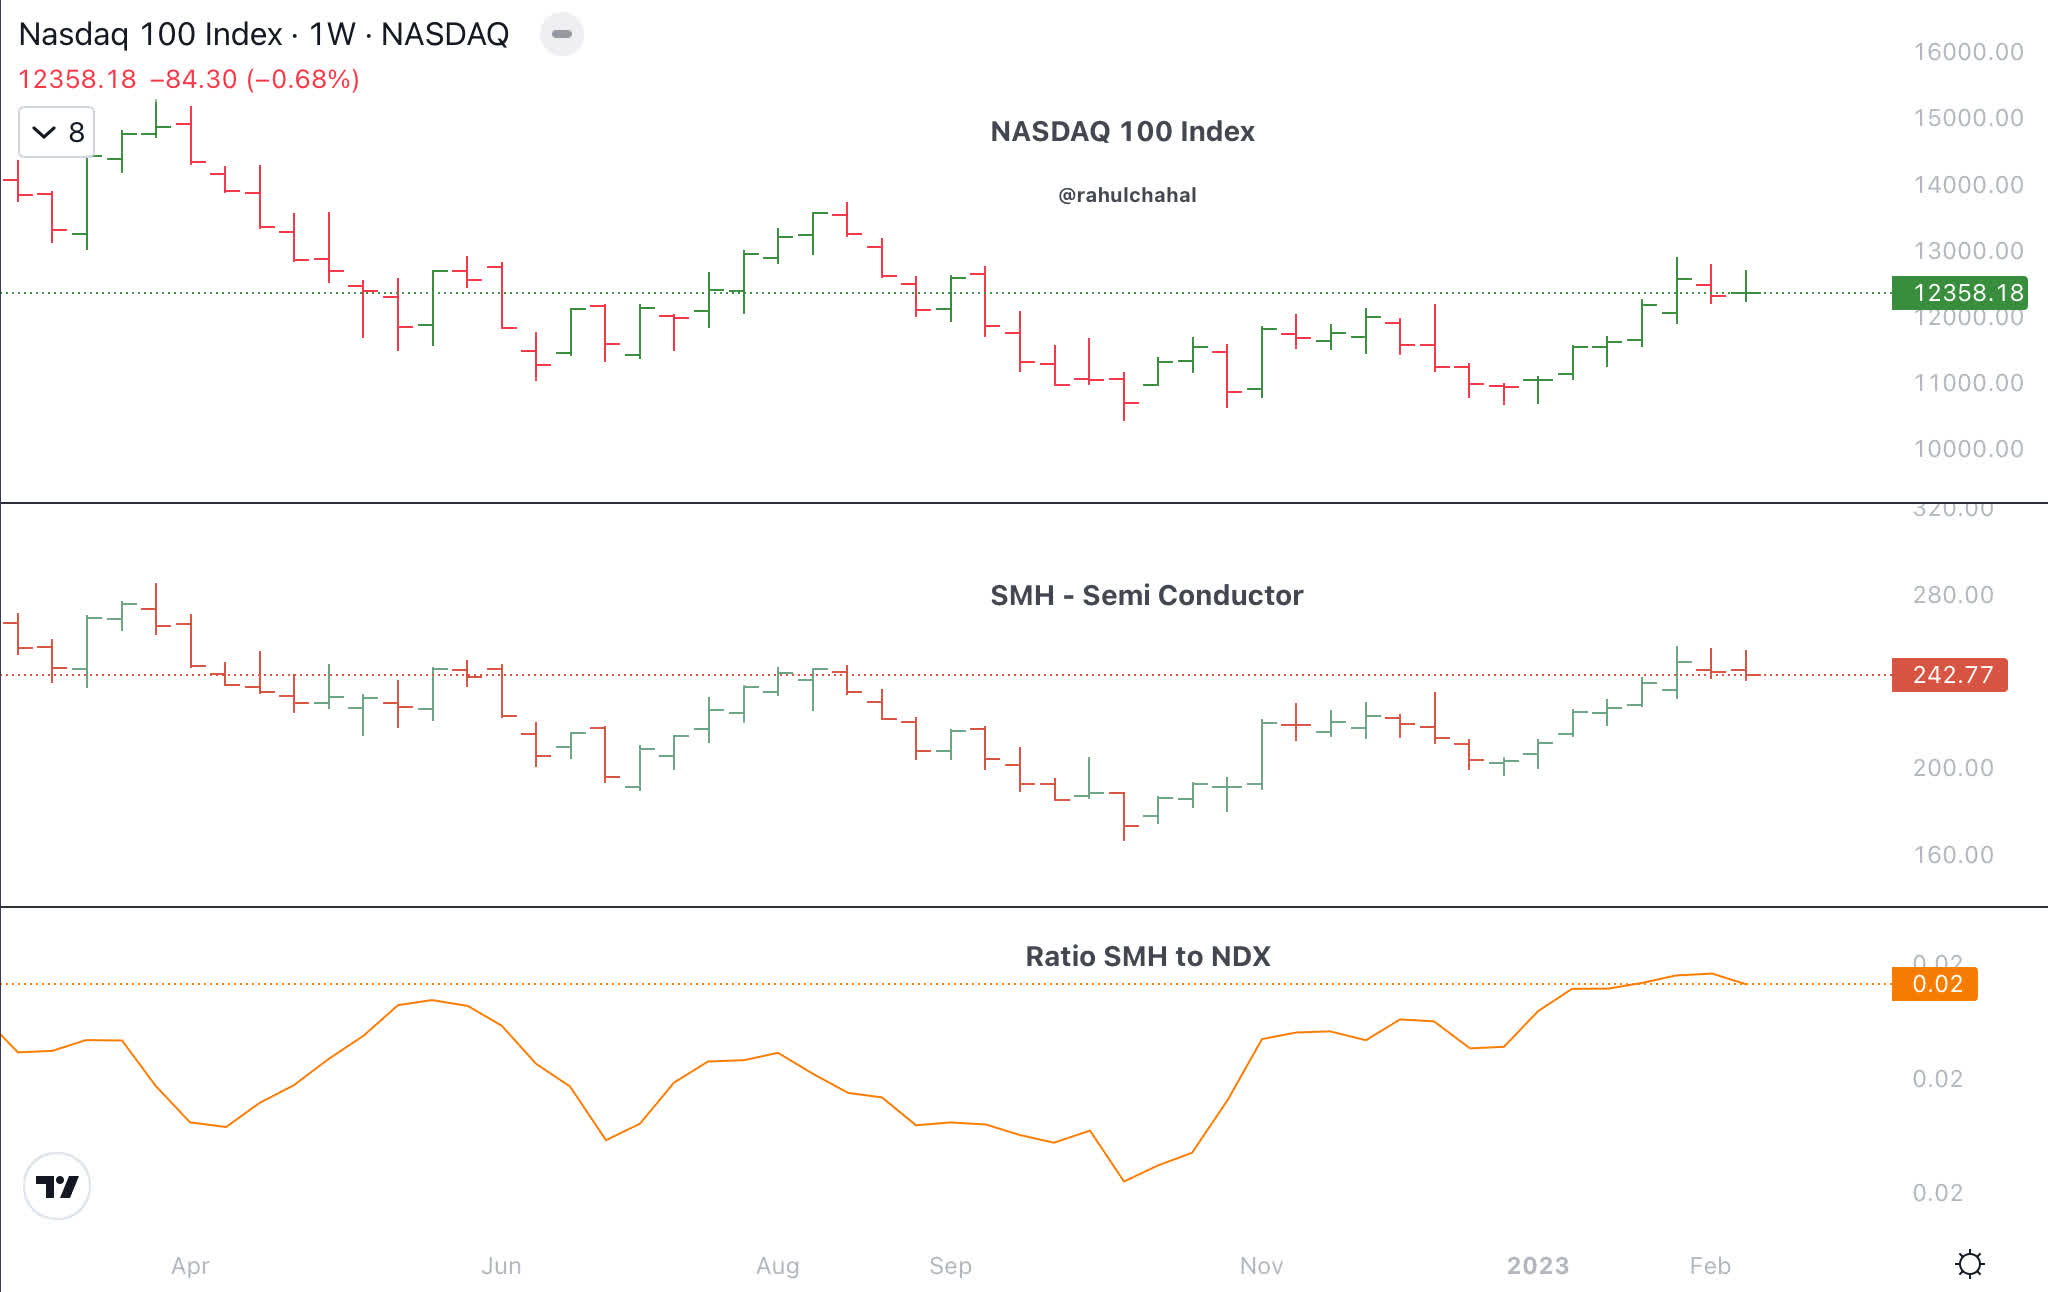
NASDAQ 100 ( NDX ) is showing signs of a turnaround. The semi-conductor index ( SMH ) has been leading NDX. Strength in semi-conductor is critical for tech and the market overall to move higher.
Chart below is of NASDAQ 100, Semi-Conductor index and the ratio of SMH to NDX.
Equal Weighted Indices
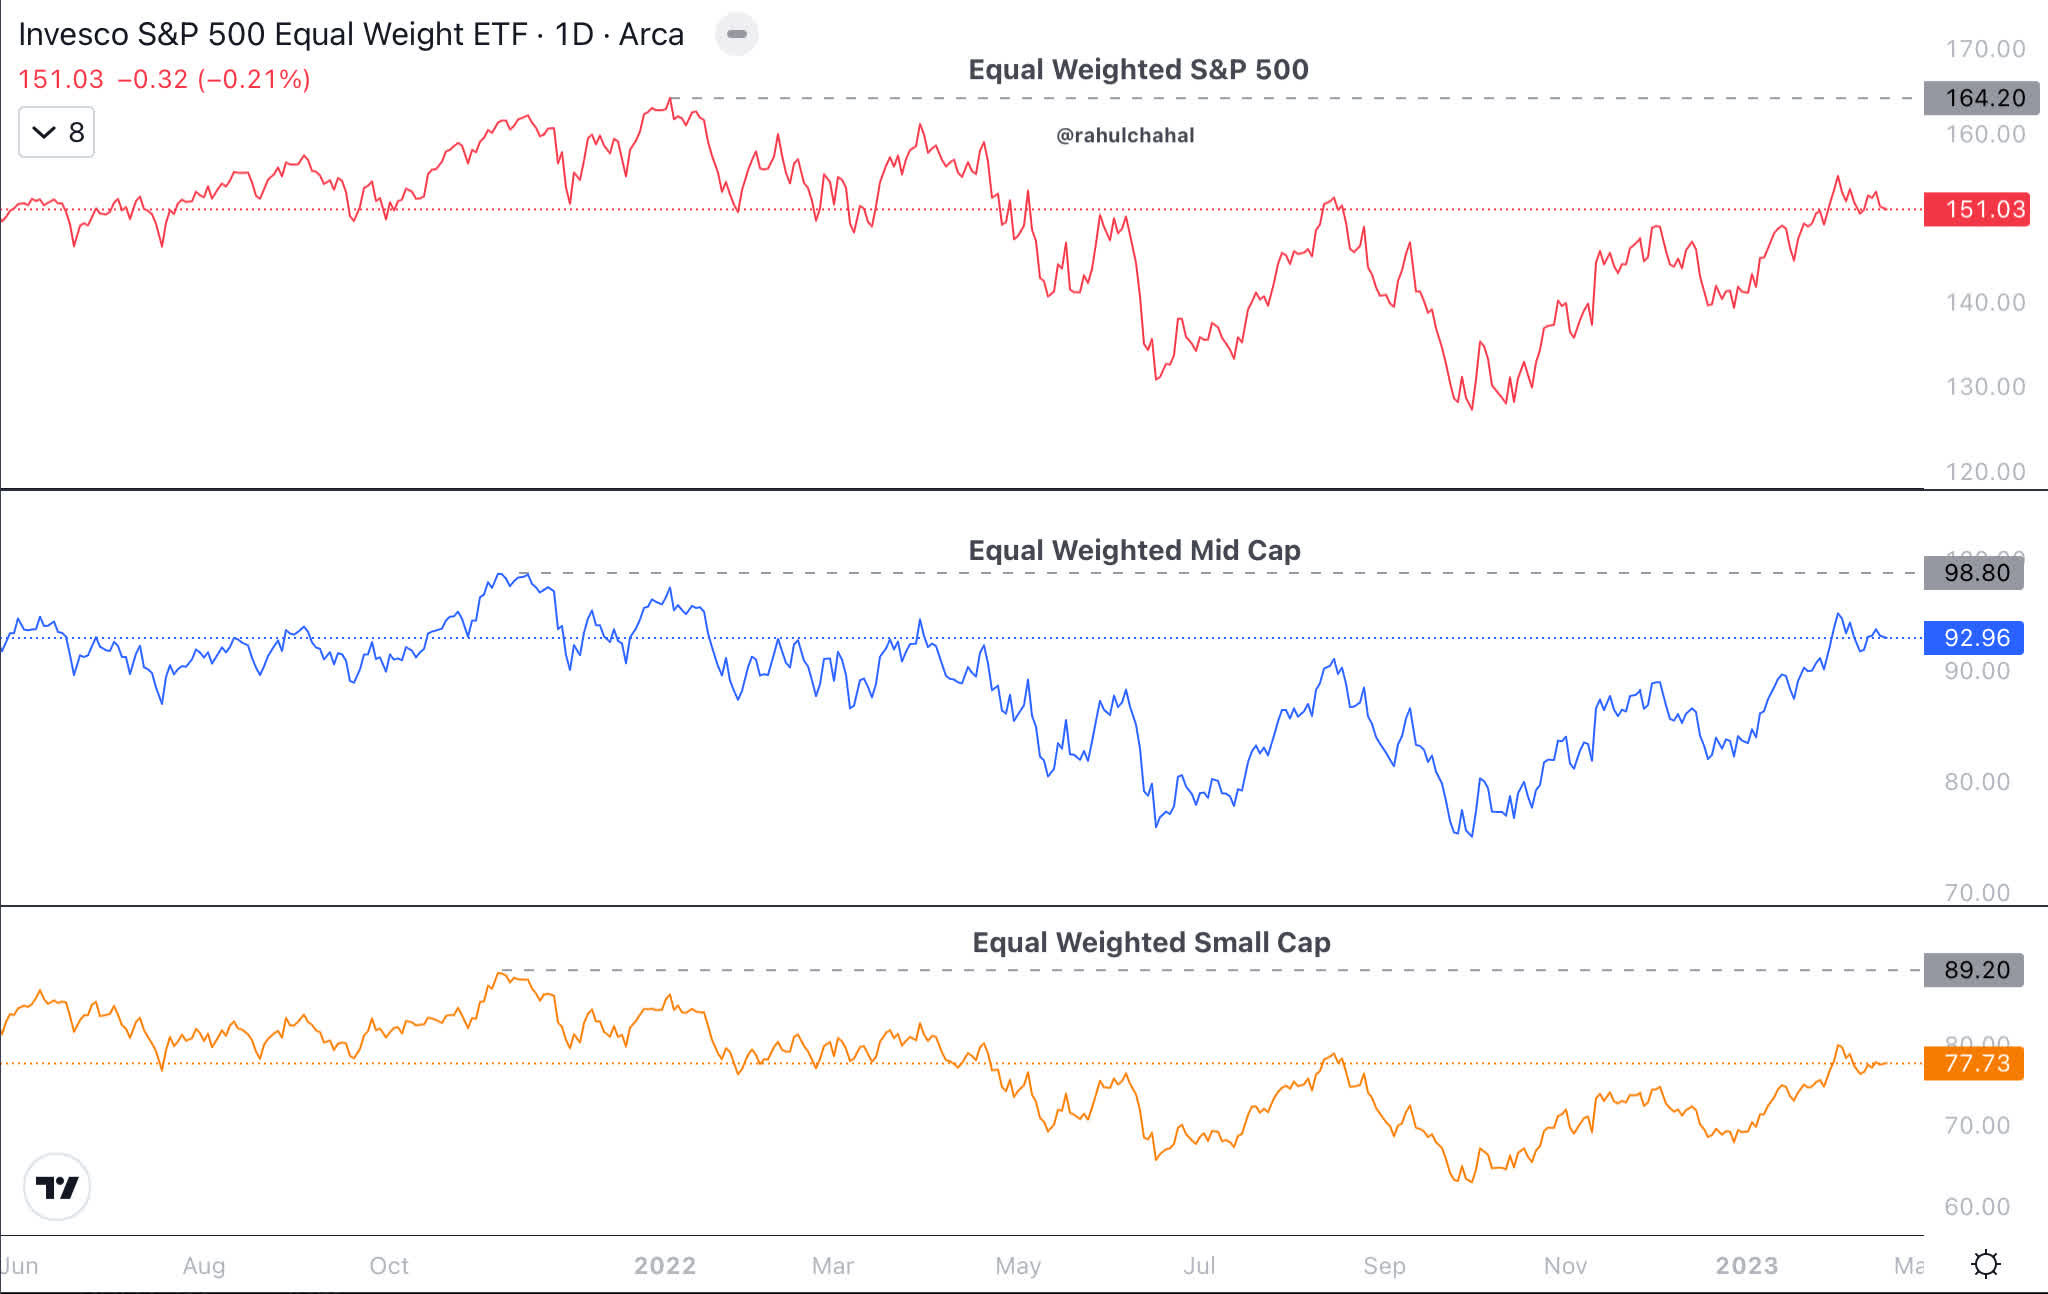
Equally weighted S&P 500 has been outperforming market-cap weighted S&P 500, which indicates a broad based rally in large caps. Below is the chart with equally weighted large-cap ( RSP ), mid-cap ( EWMC ) and small-cap ( EWSC ). Equally weighted mid-cap index is the strongest of them and is nearing all-time highs.
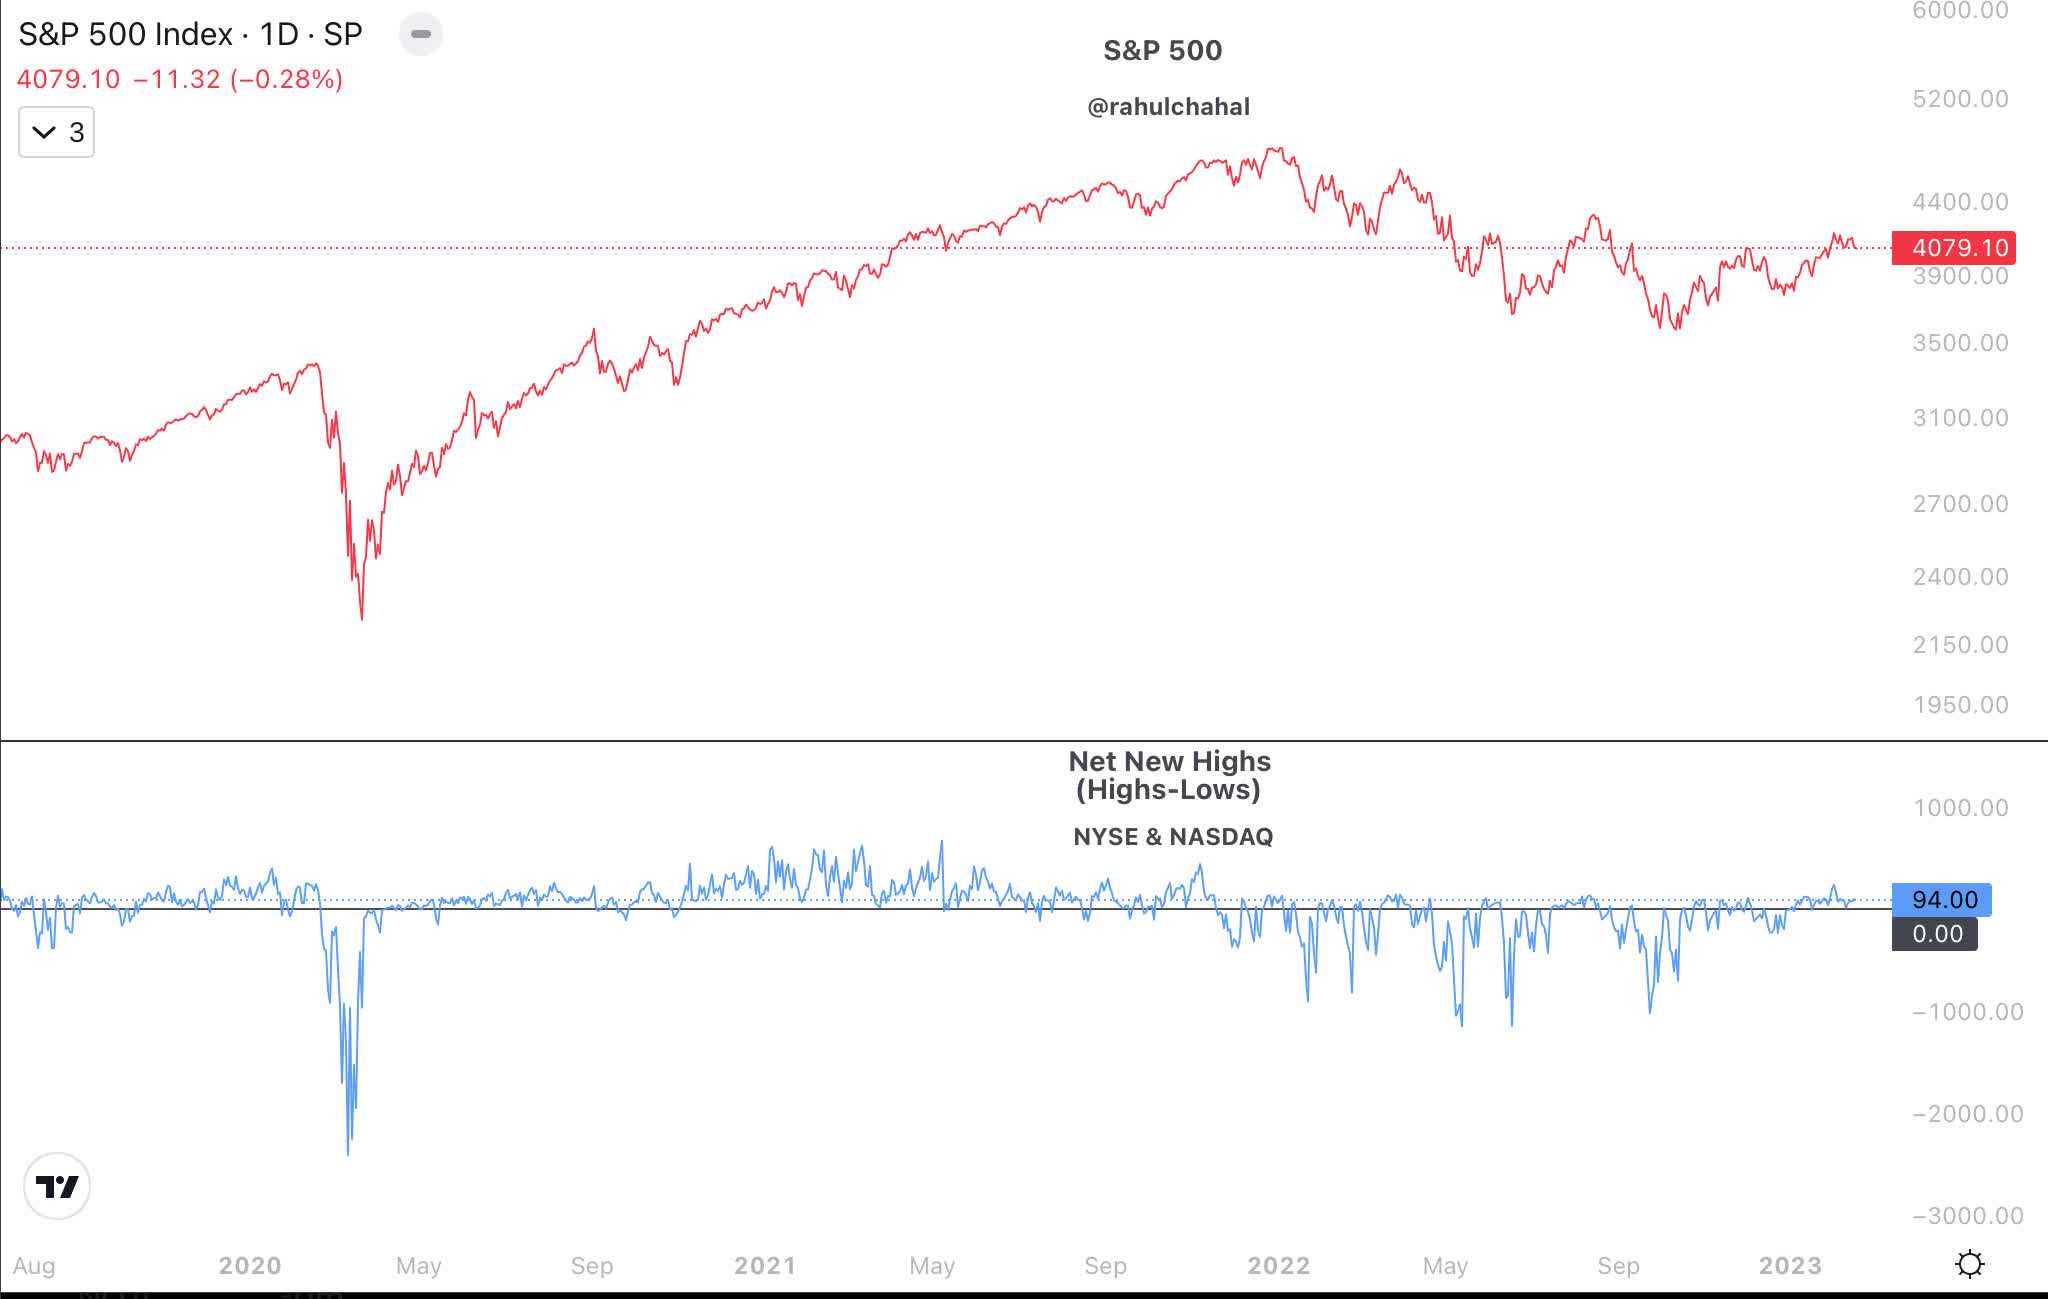
Net new highs are calculated by subtracting 52 week new lows from 52 week new highs. For the past several weeks net new highs have been greater than net new lows, which is supportive for equities.
Ratio of equal weighted discretionary ( RCD ) to equally weighted staples ( RHS ) generally leads the overall stock market. So far it is indicating a positive environment for equities.
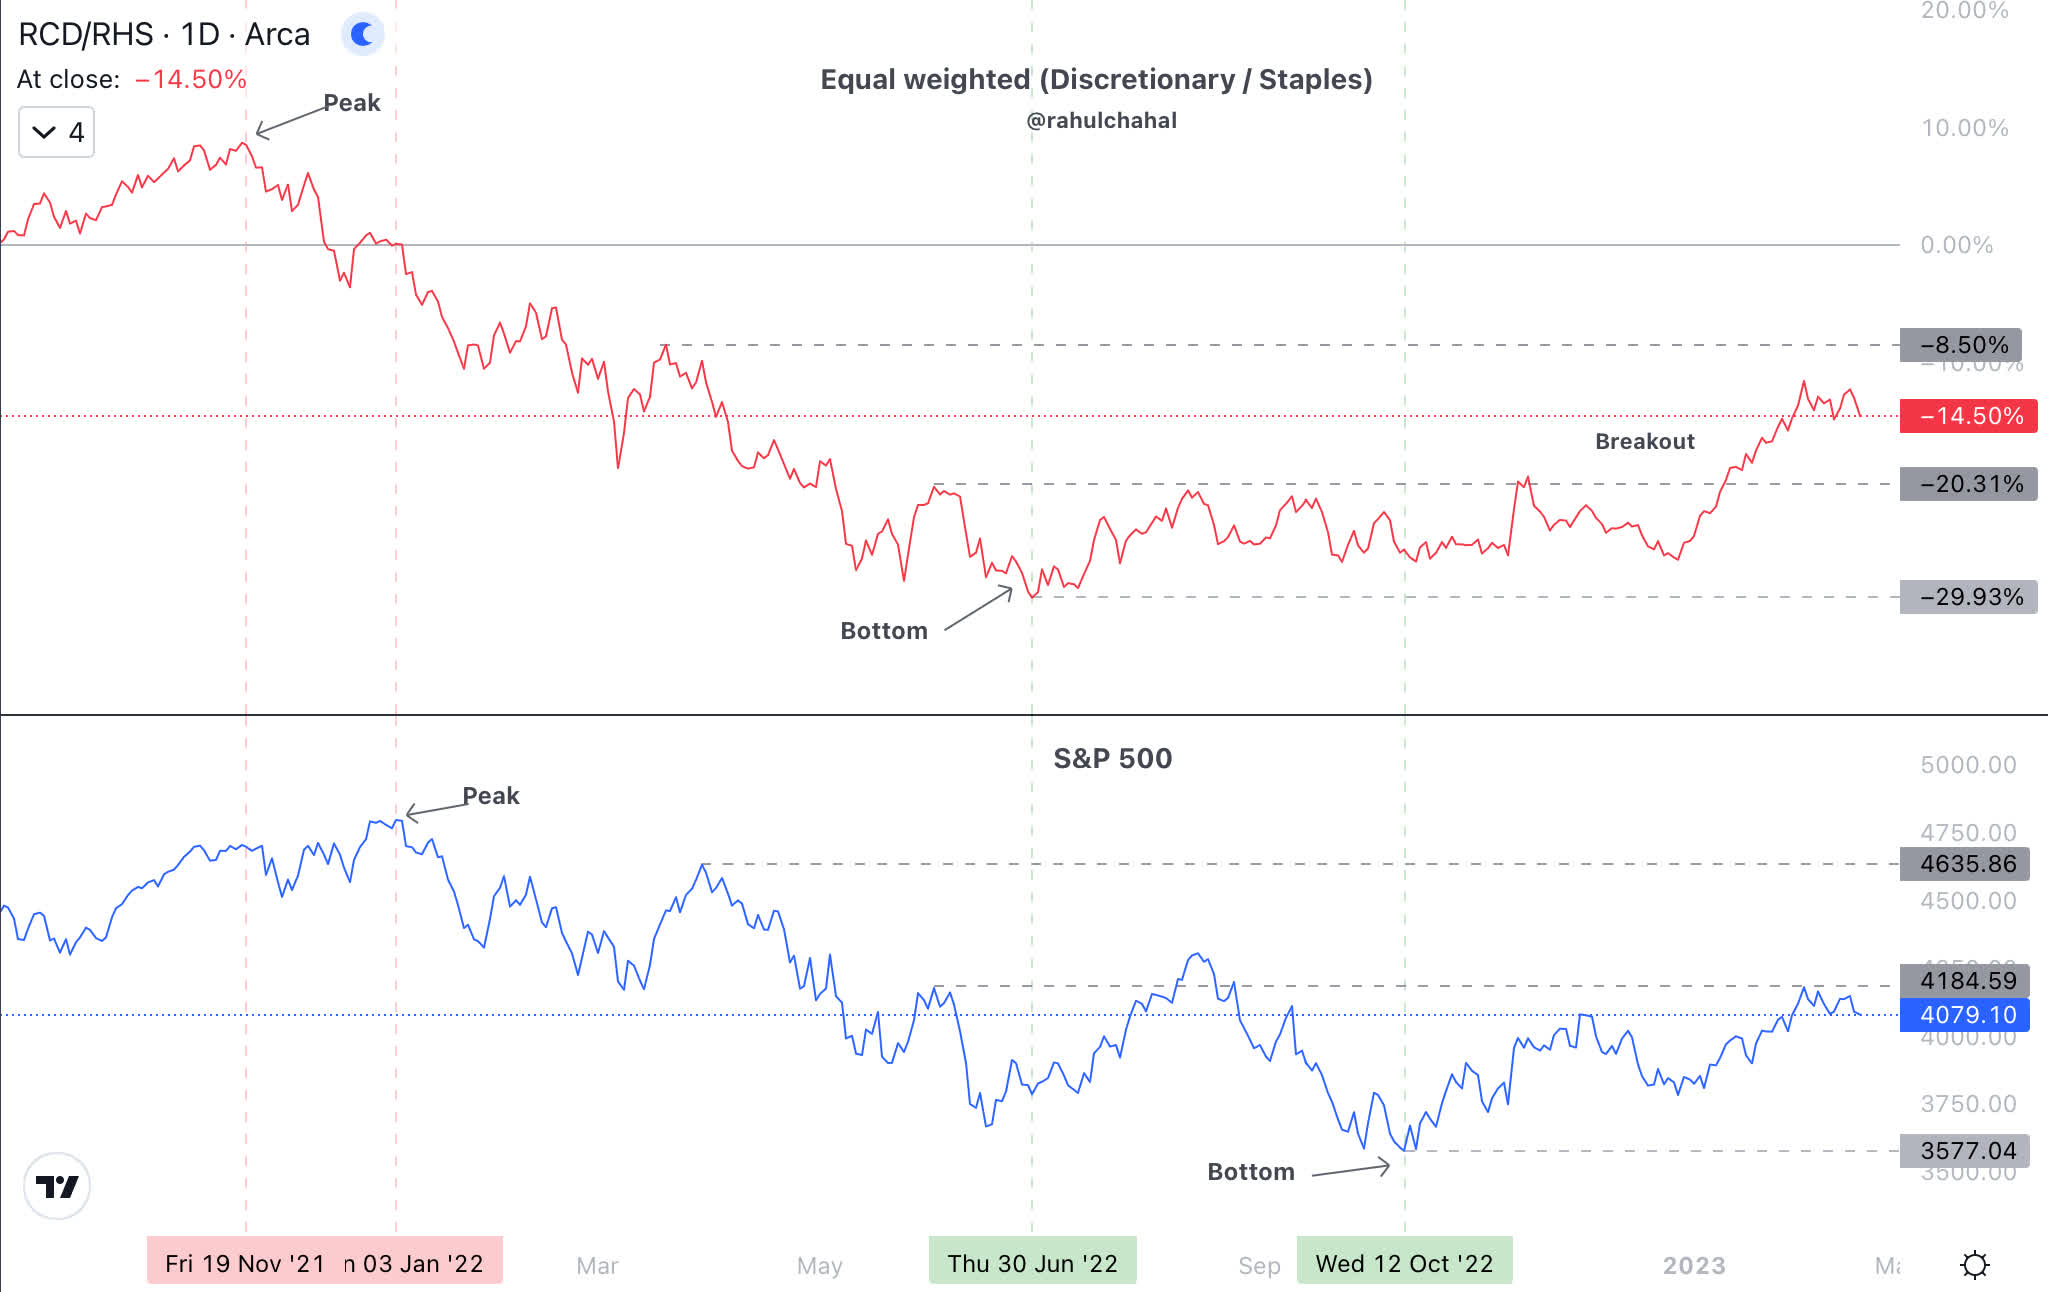
The chart below has the 200 day moving average of the ratio of up volume to down volume. During an uptrend in S&P 500, the 200 day moving average of the ratio remains above 0.50.
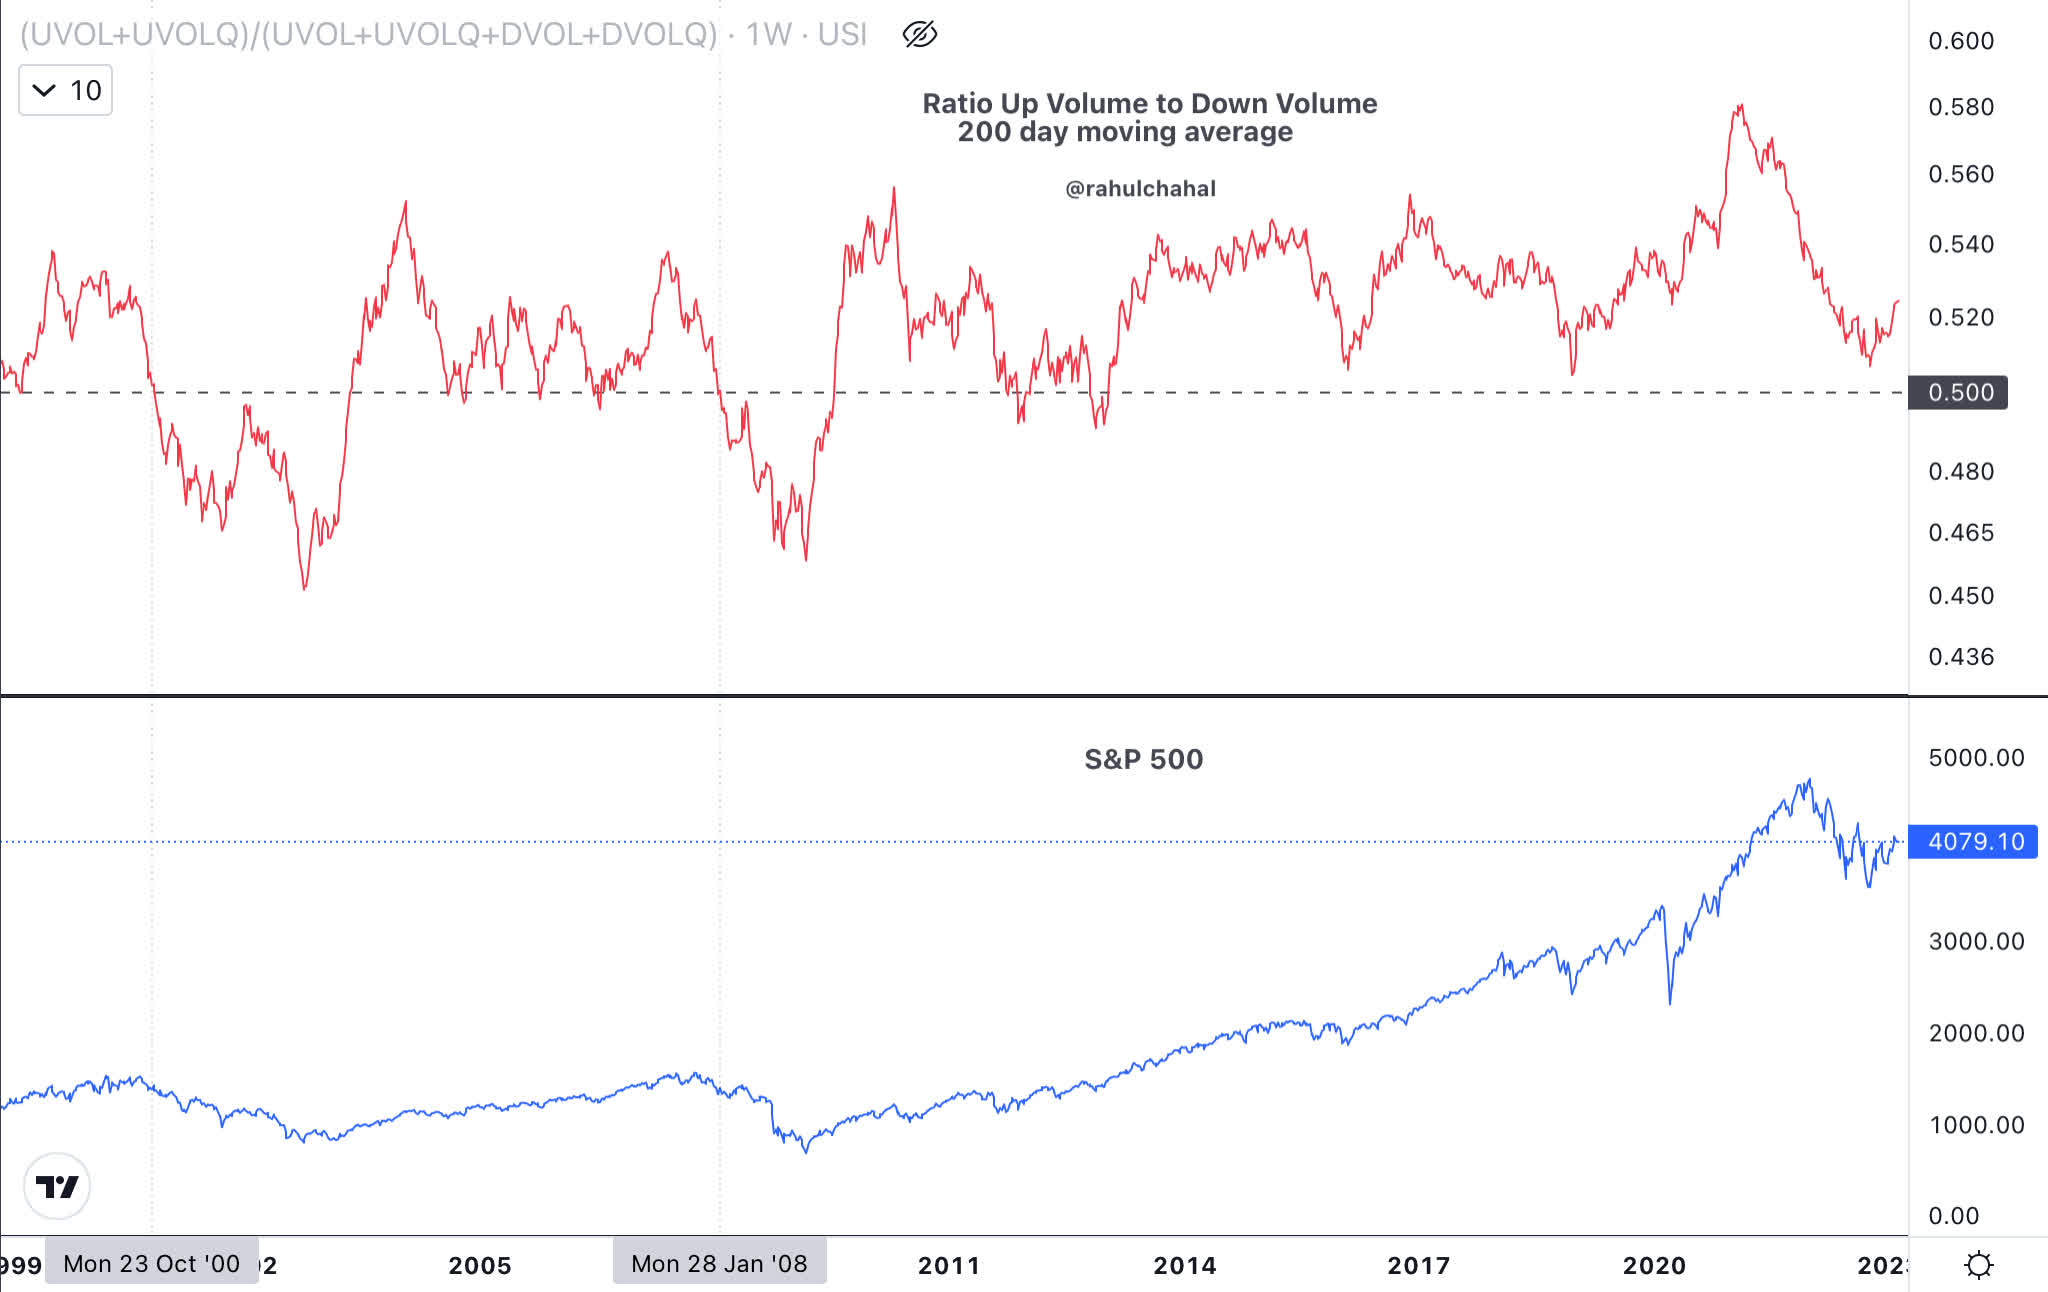
High yield corporate bond ( HYG ) has been weak and it is diverging from equities.
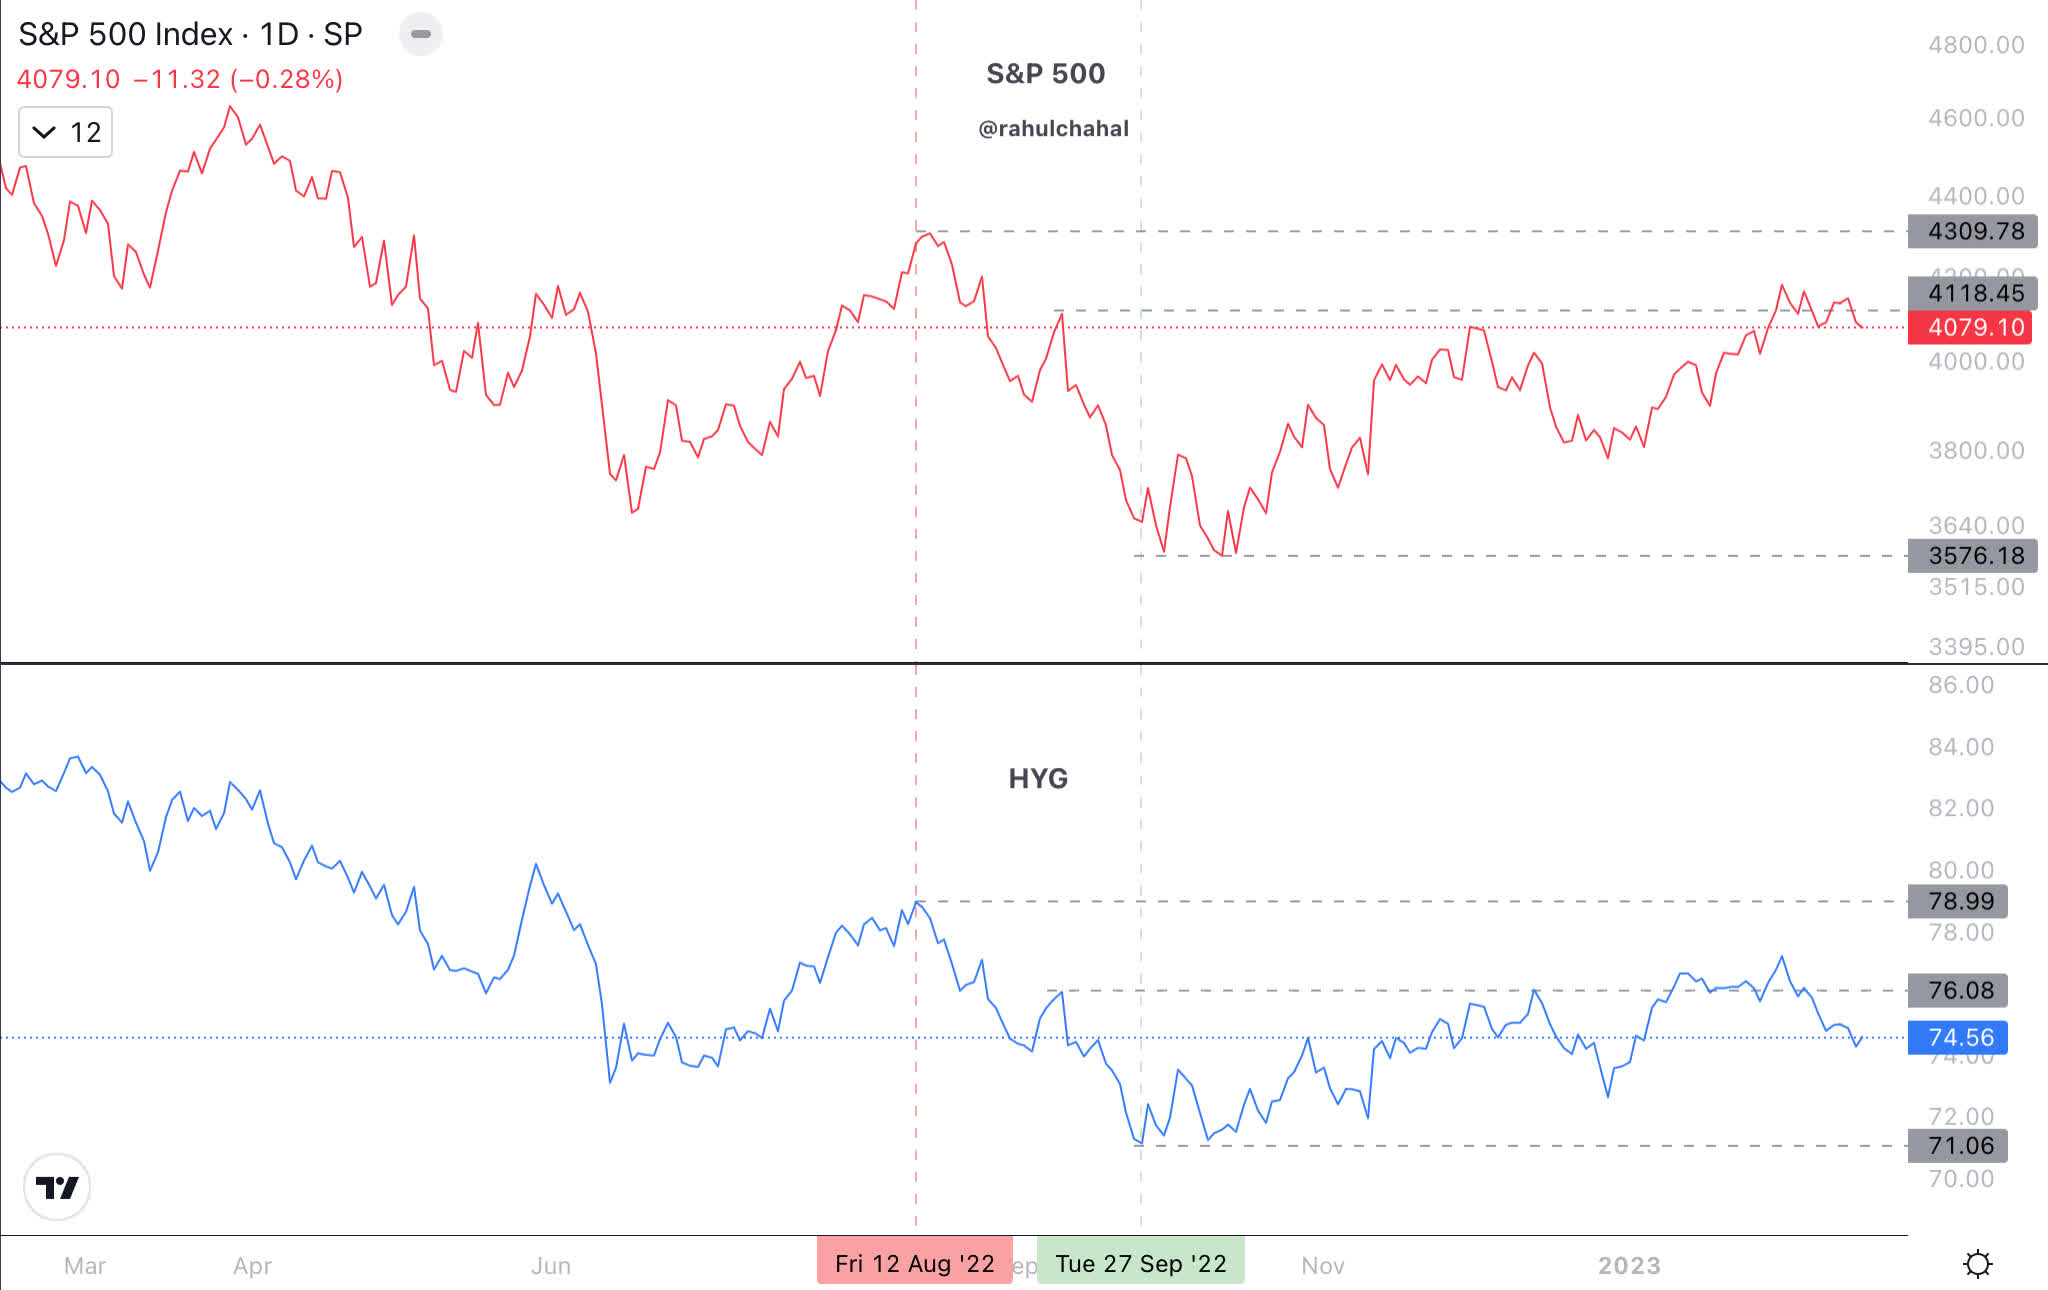
Dow Transports ( DJT ) and S&P 500 are moving in sync and this is generally considered positive.
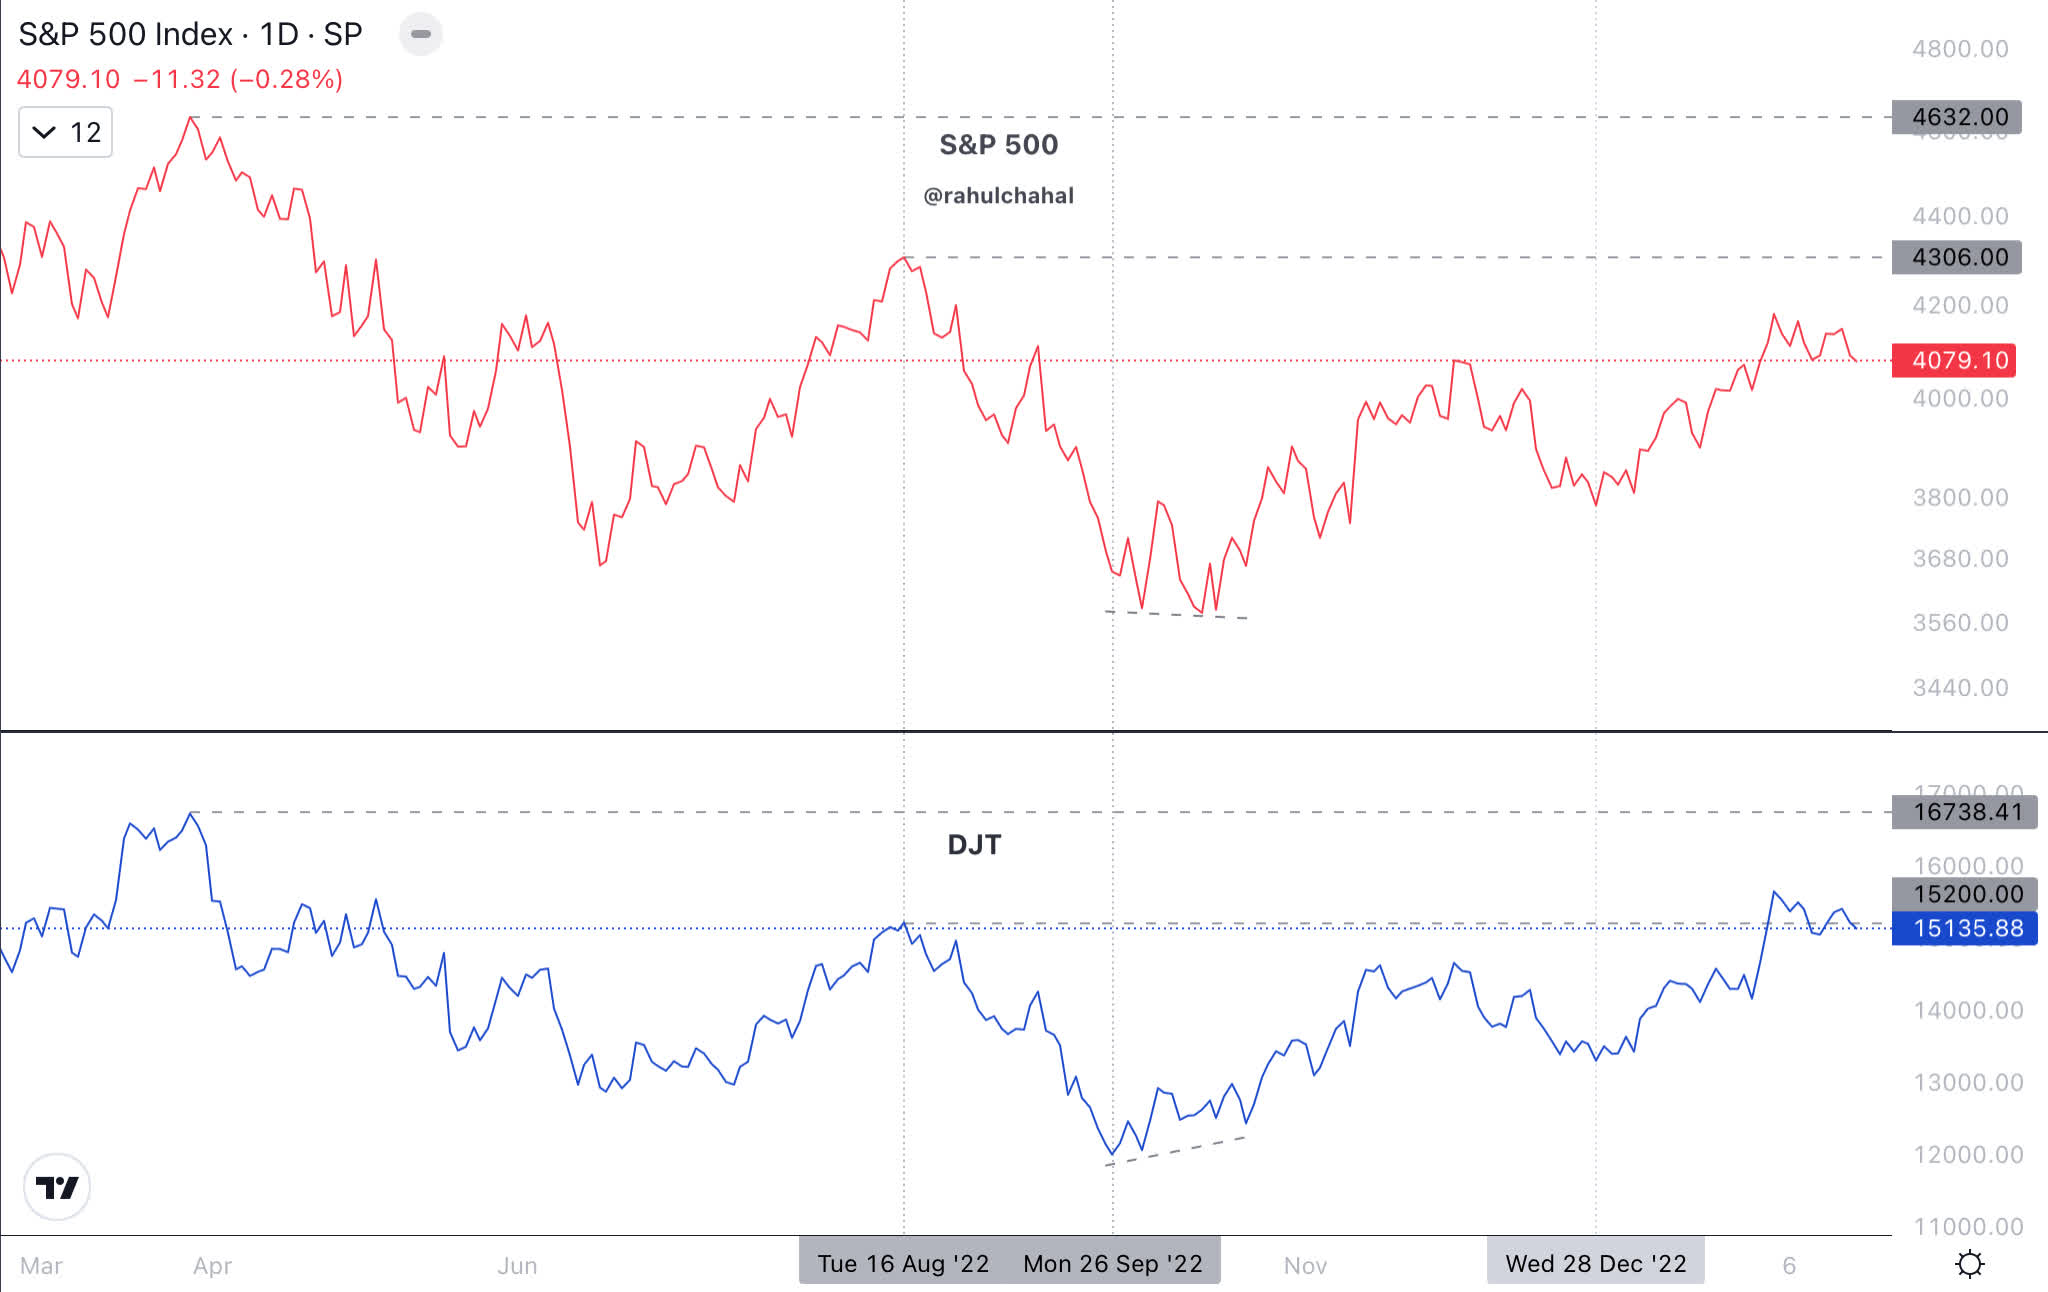
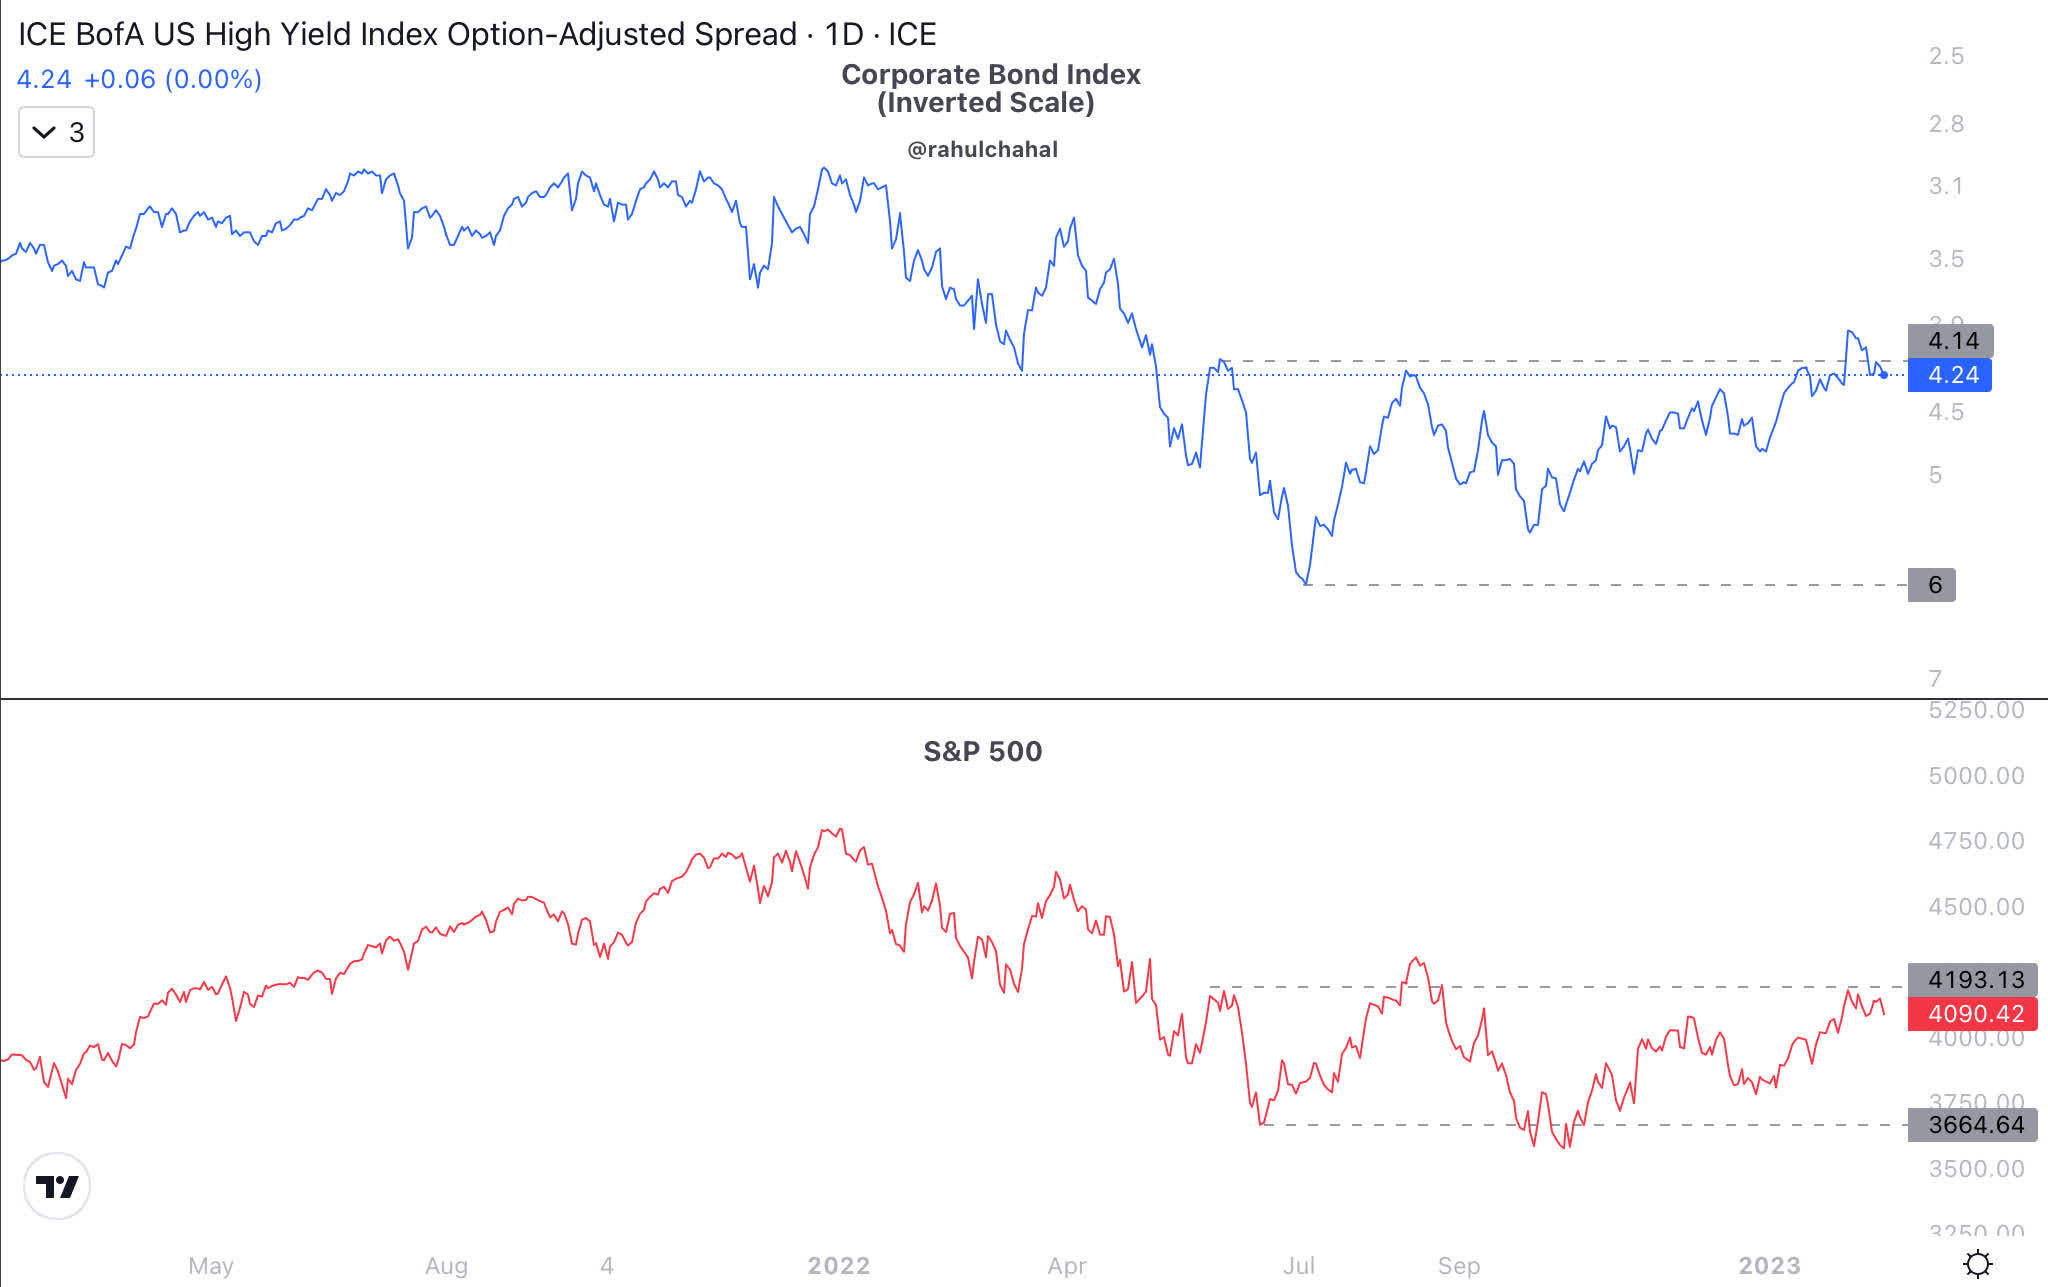
Chart of the Corporate Bond Index (shown on inverted scale) is supportive for equities as it continues slowly grind up.
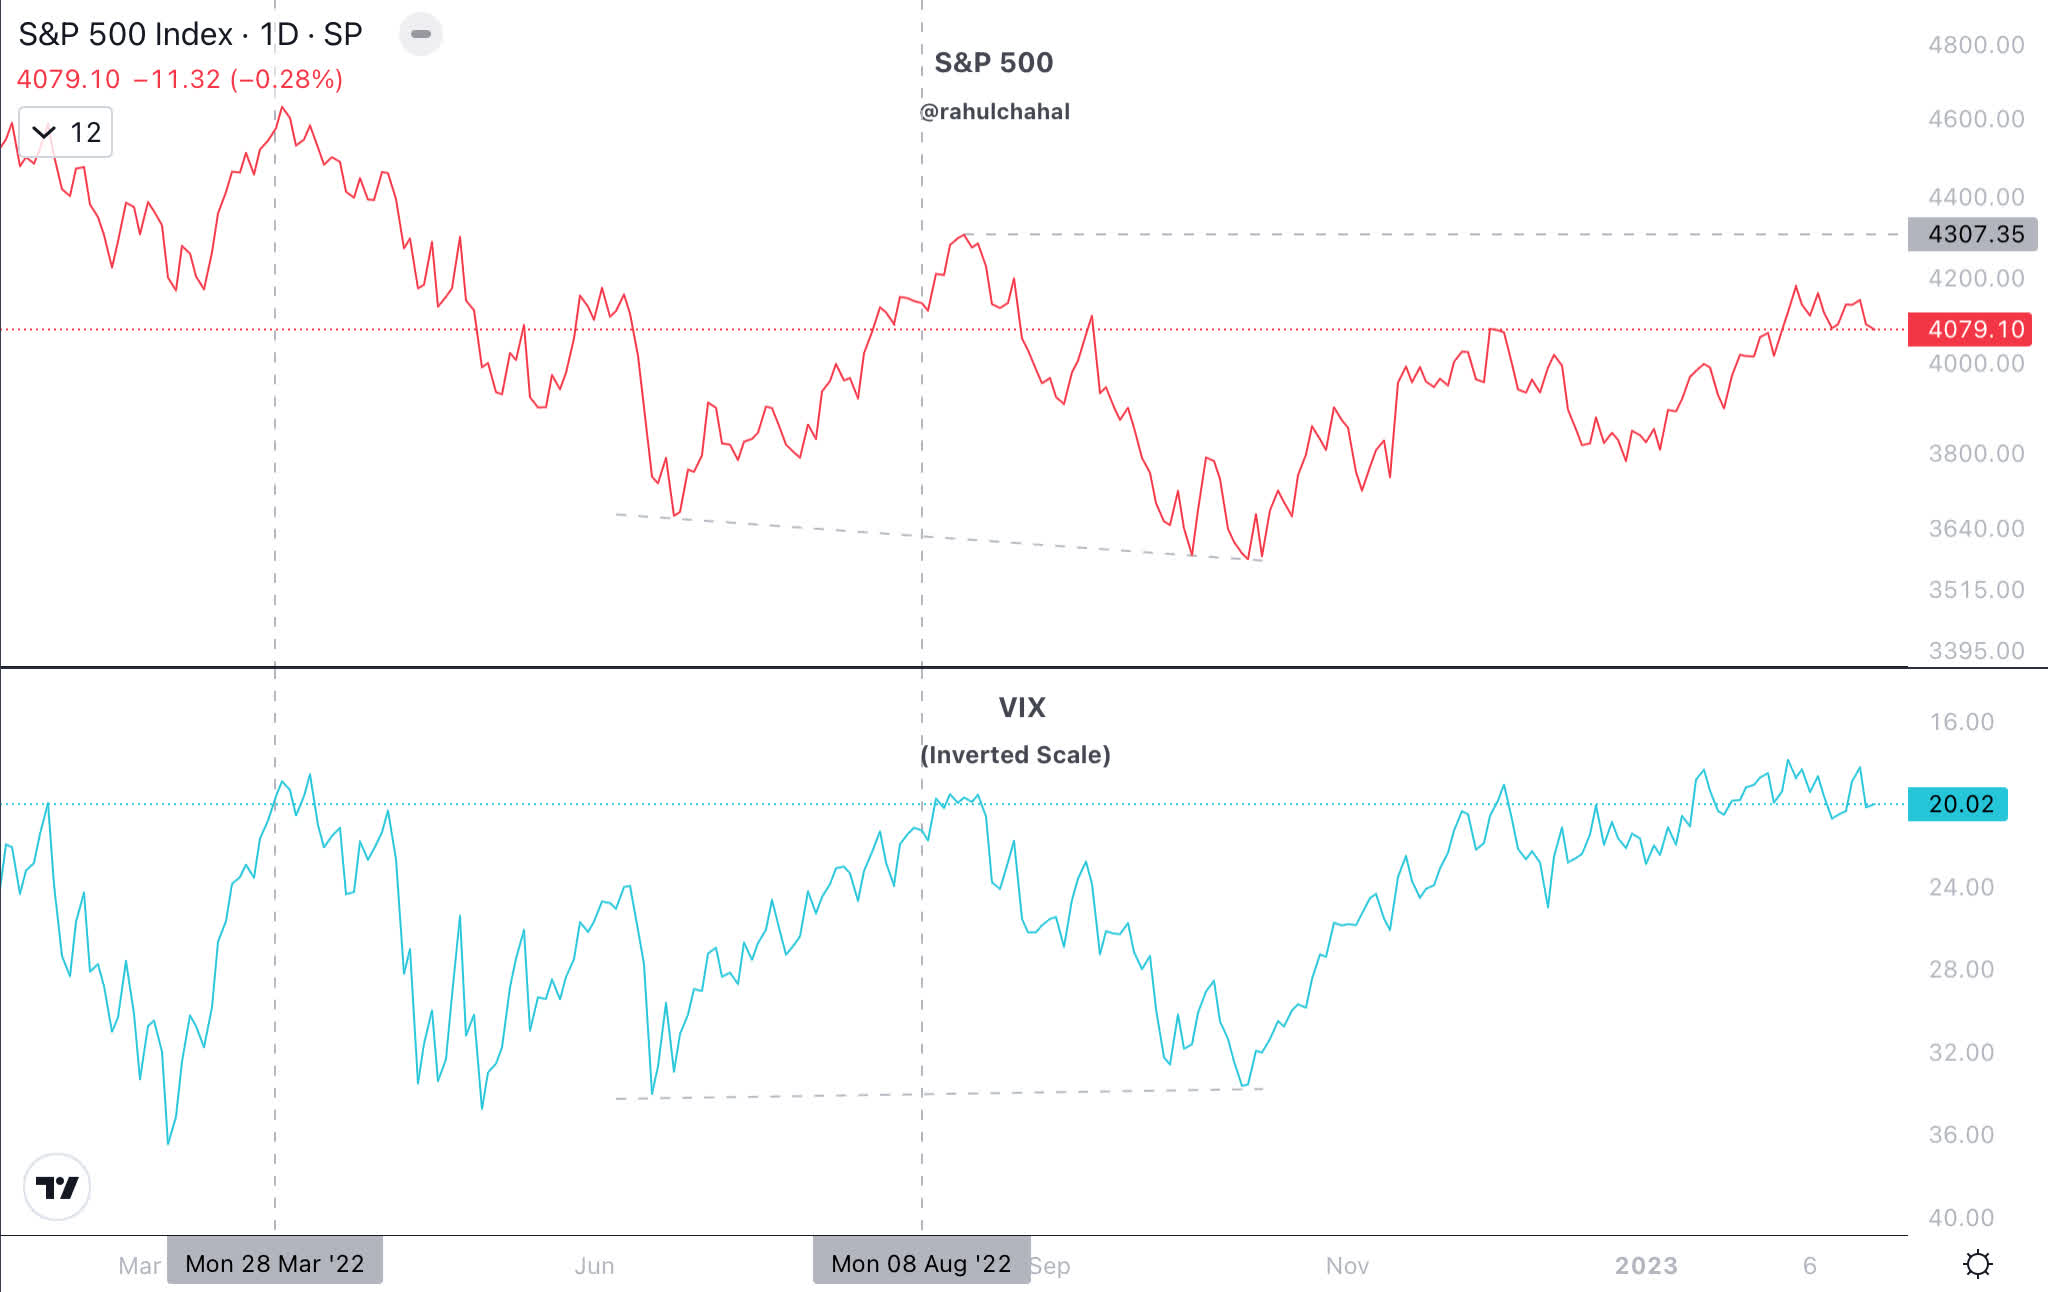
VIX at 20 is conveying that any news which could be considered concerning for the market has been factored in.
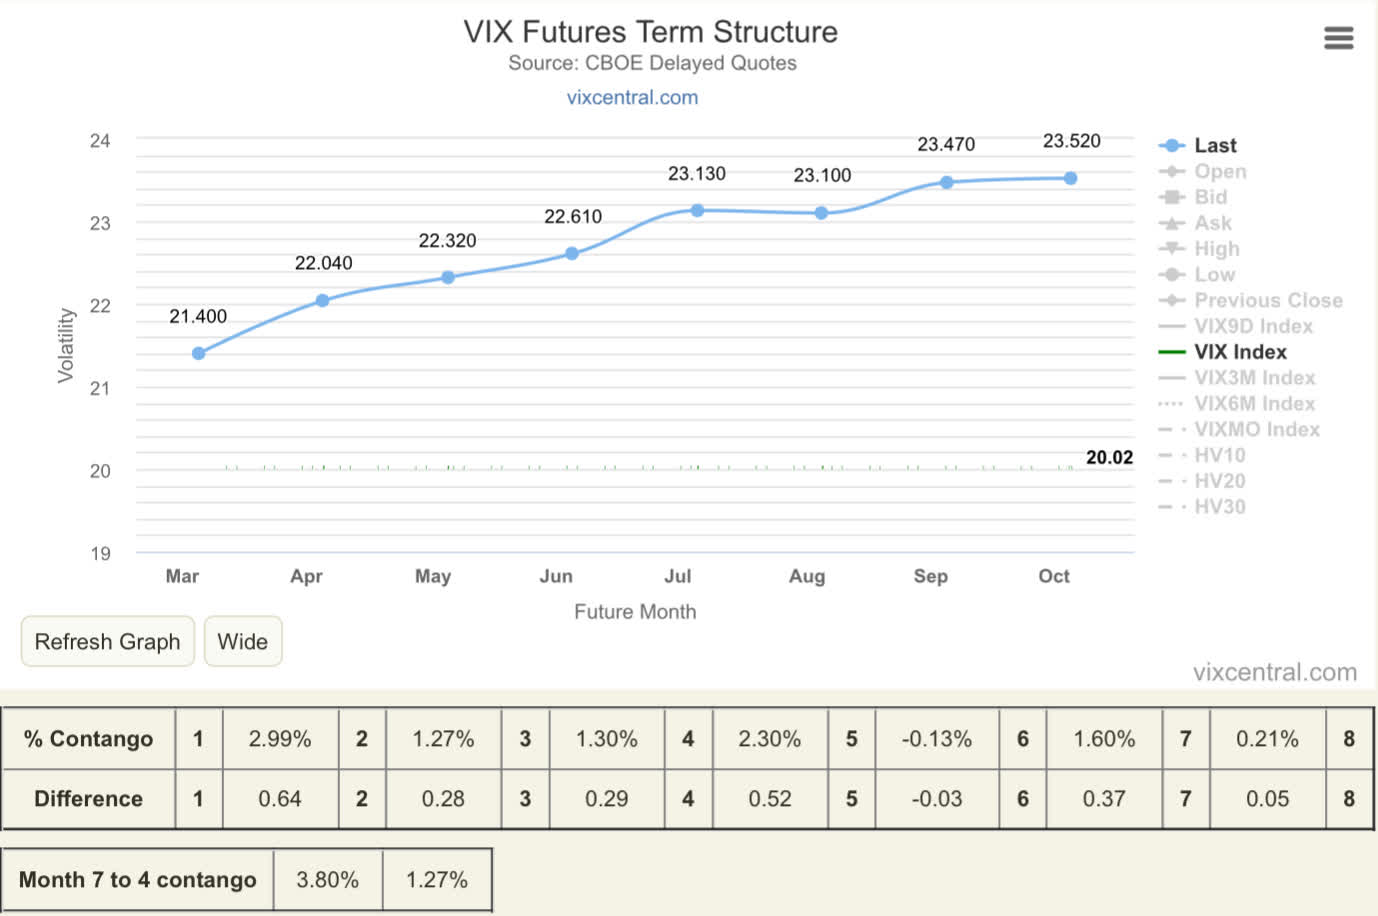
The VIX Term Structure is in contango, which is a positive.
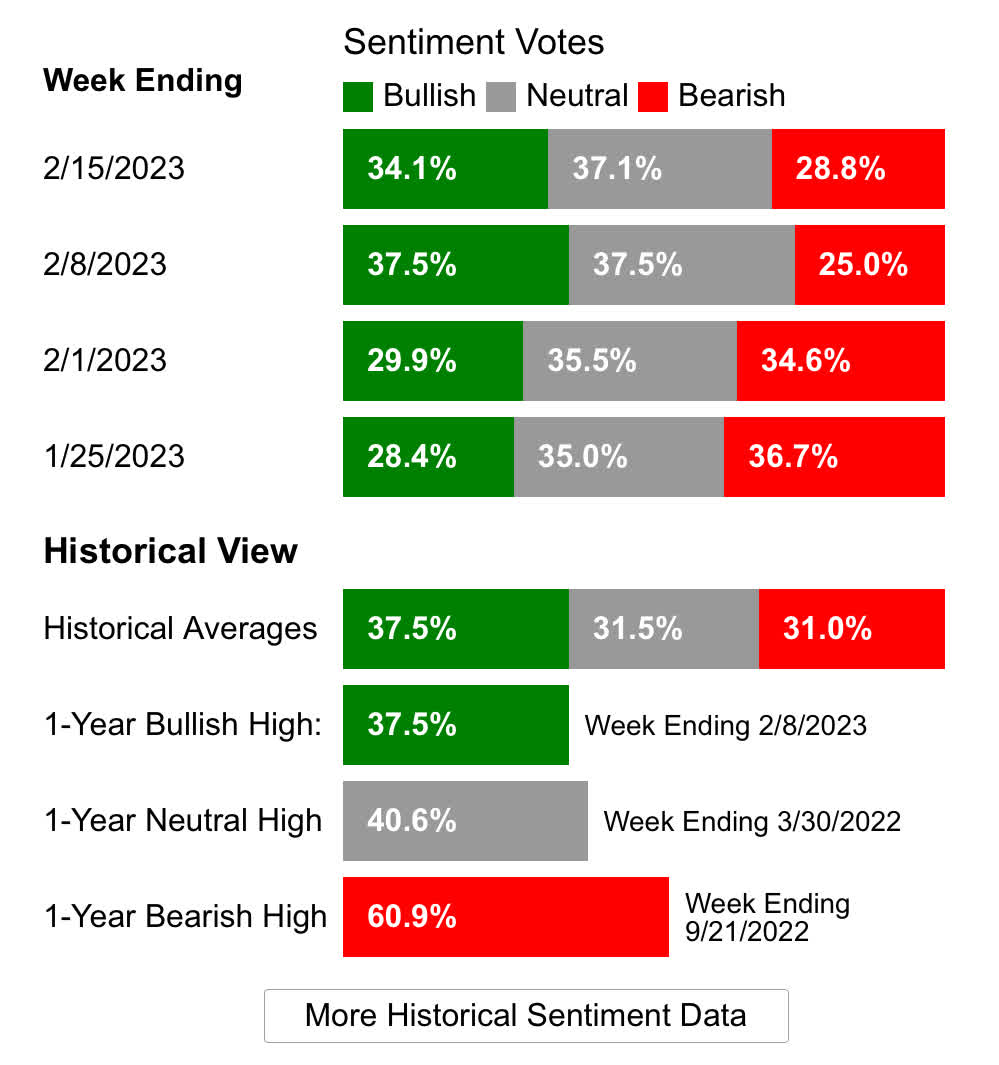
Sentiment and positioning are both supportive for higher equity prices.
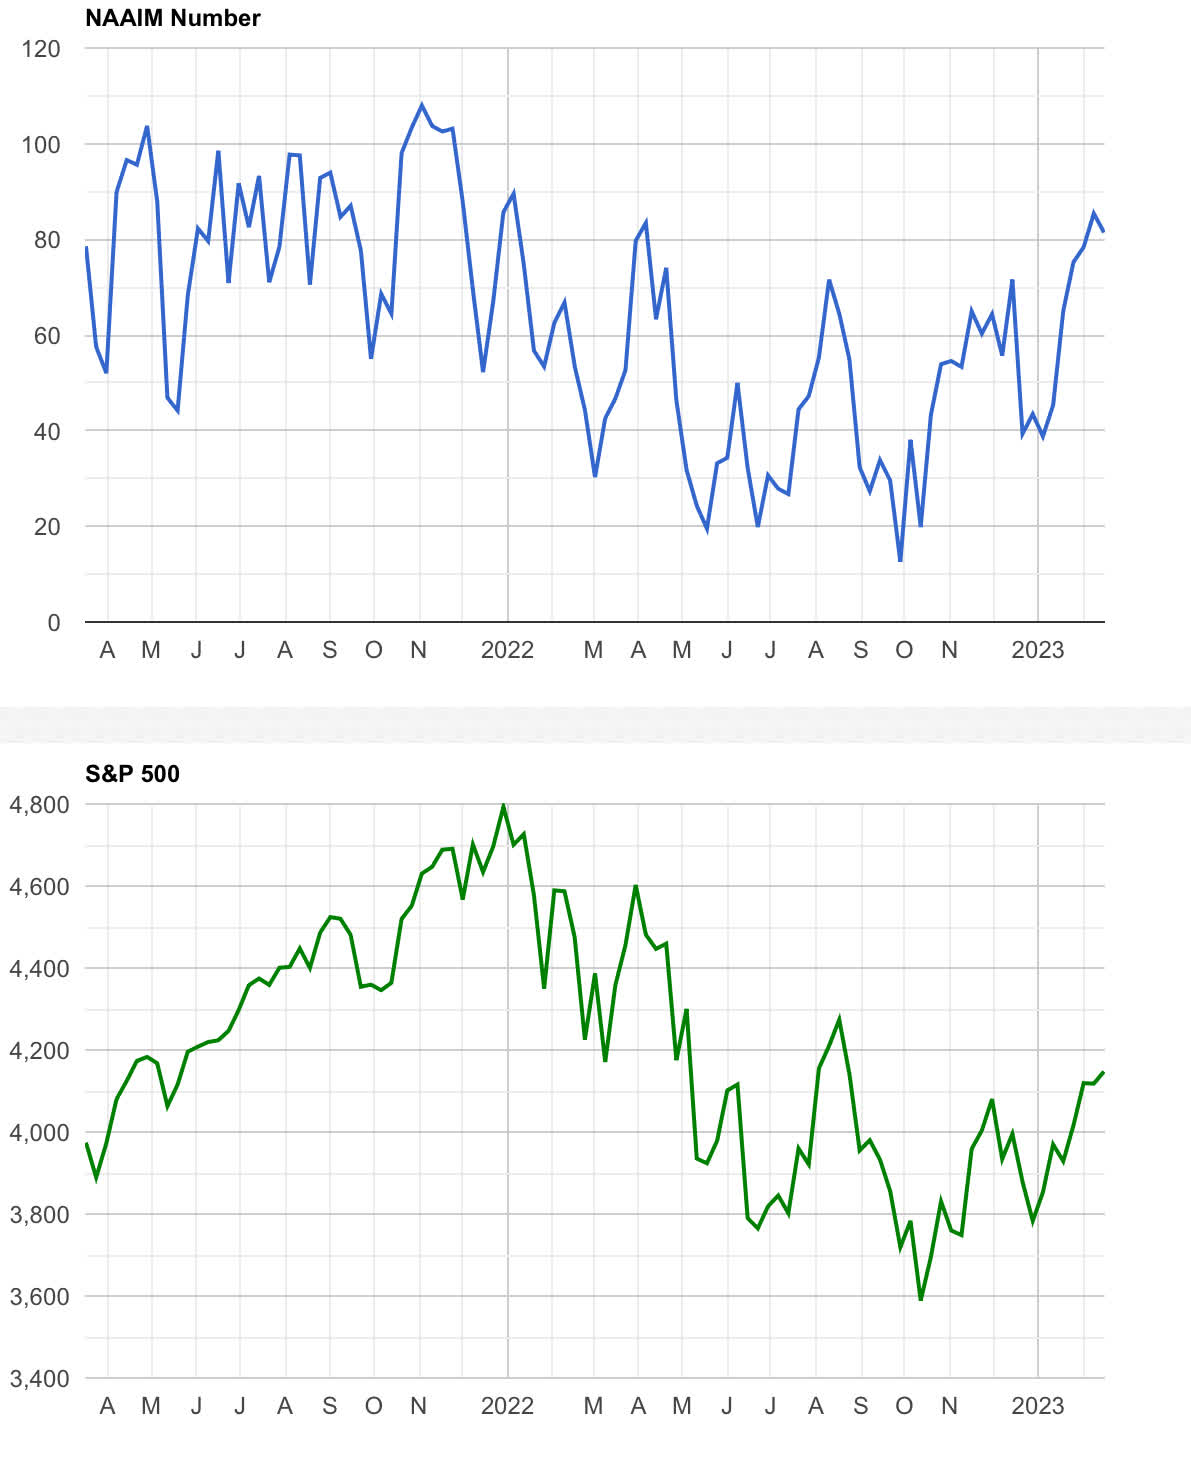
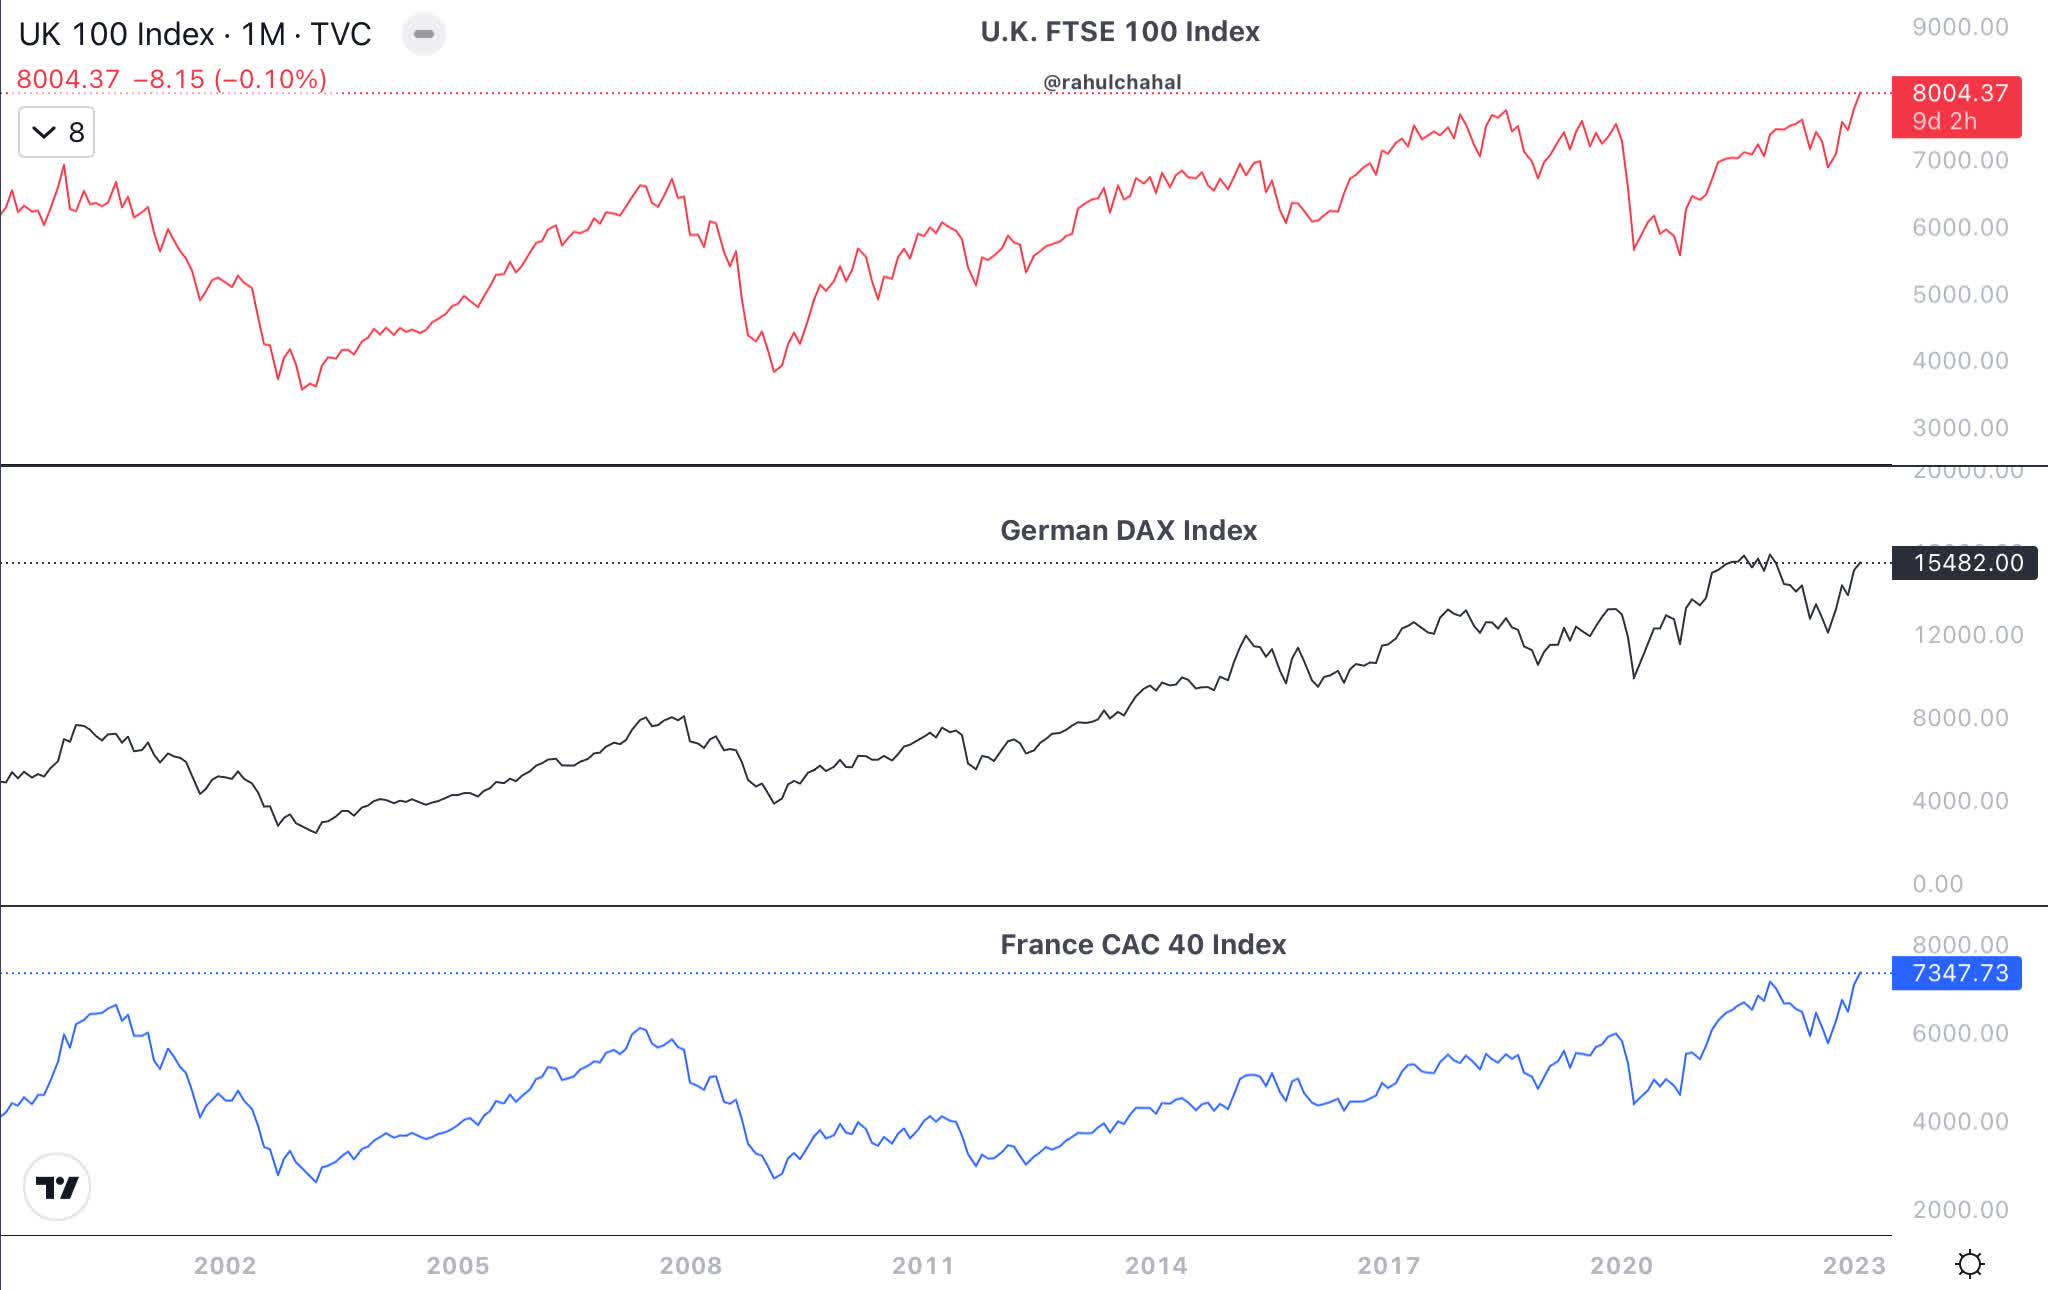
International Stock Market Indices
There are stock market indices around the world doing better than U.S. stock market indices. Below are examples of U.K. FTSE 100, German DAX and French CAC 40. These indices are at or near all time highs.
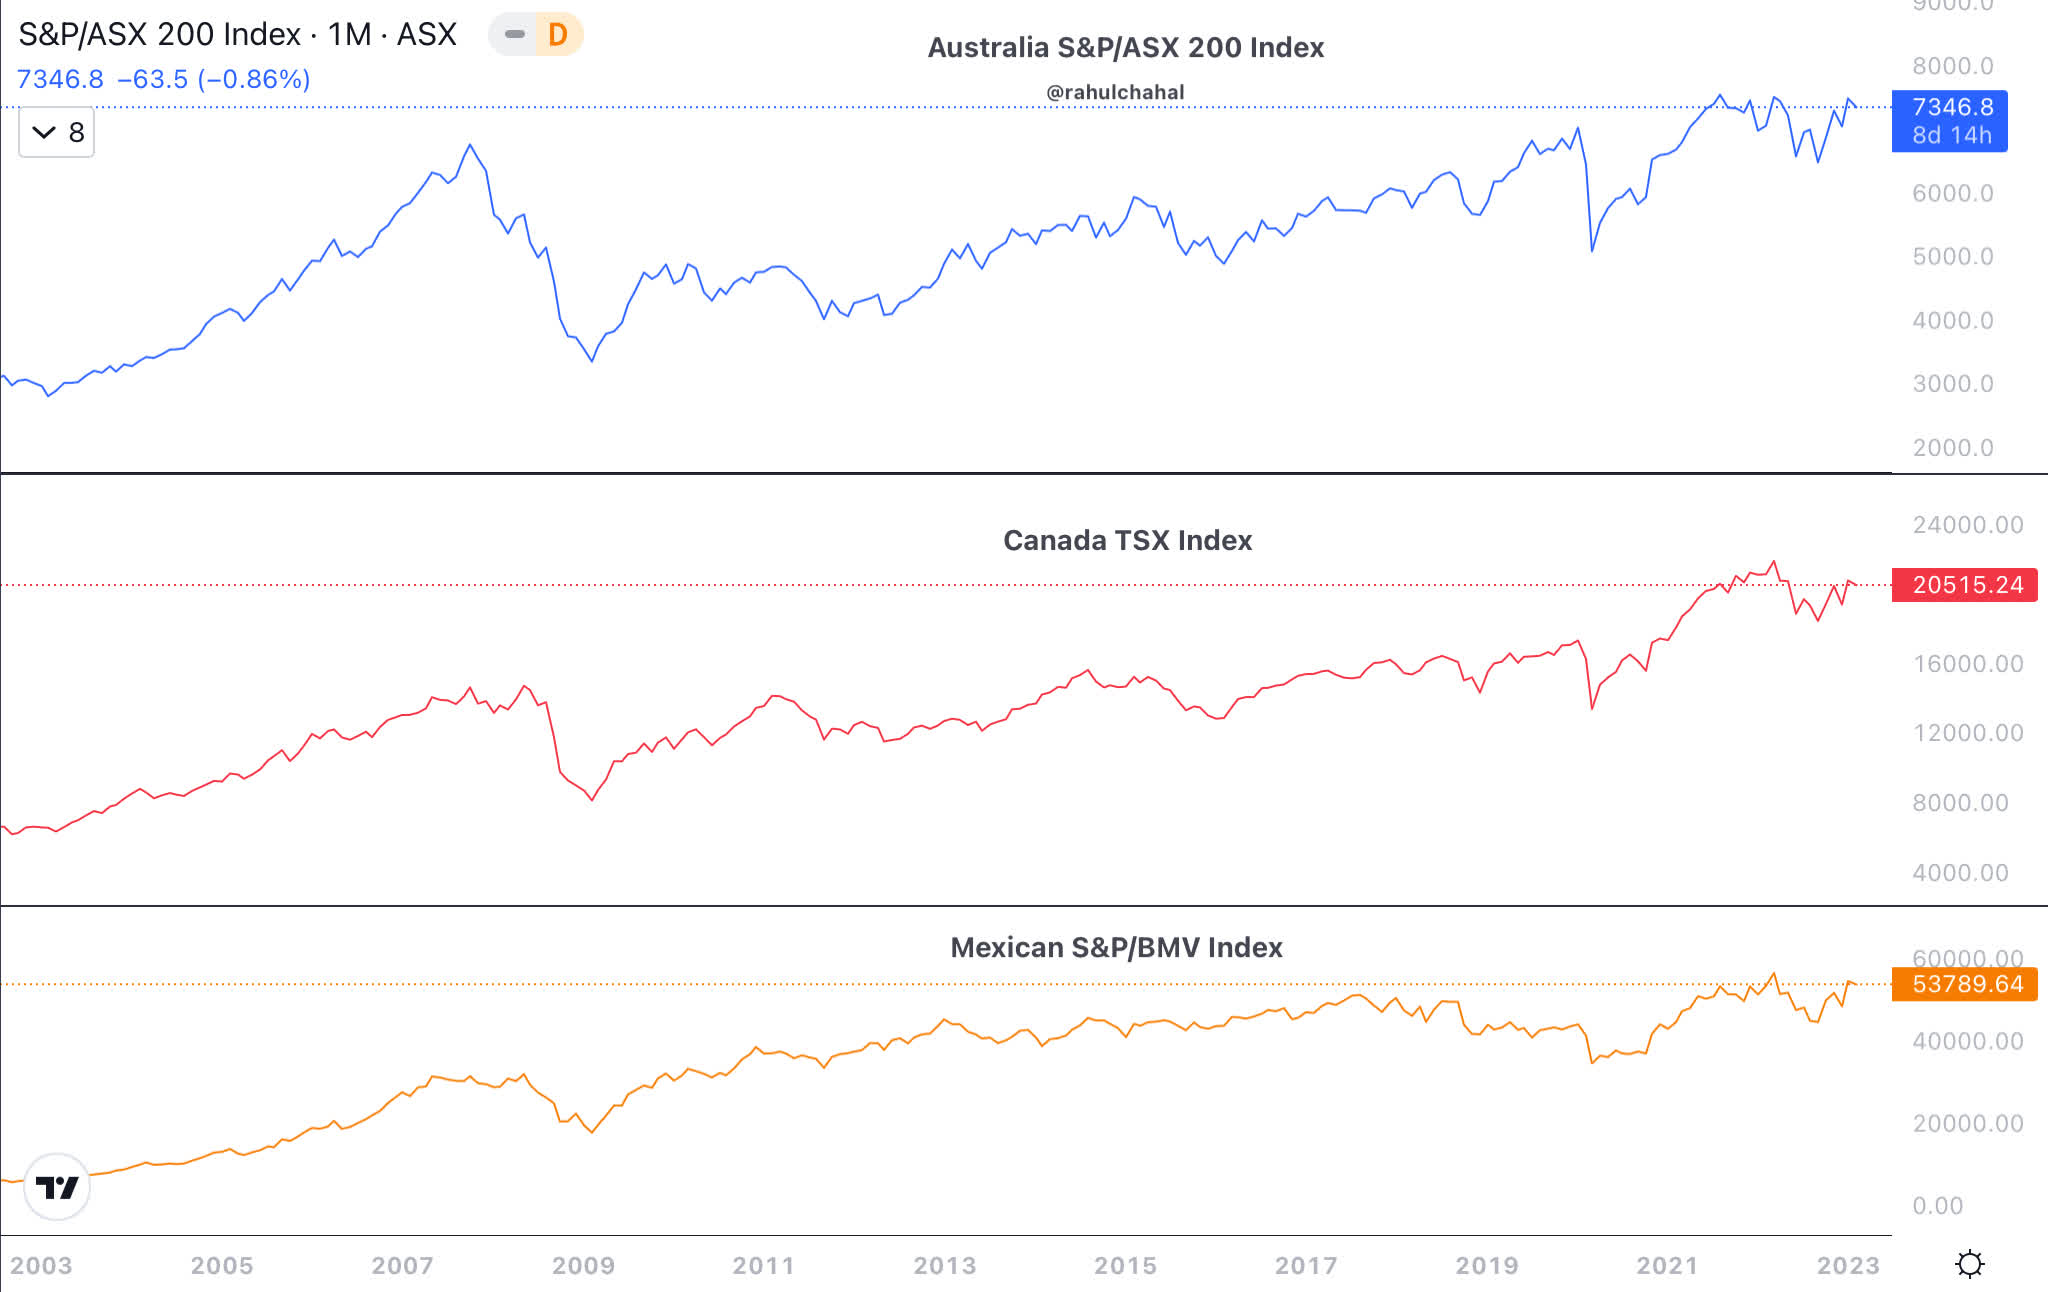
And so are stock market indices in Australia, Canada and Mexico.
Don’t Fight the Fed or don't fight the market?
As long as there are no new surprises, the S&P 500 Index could go sideways for a few weeks. Challenges for the stock market are interest rates, Fed, earnings and valuations. But it all starts with inflation. If the inflation starts to fall faster than expected in the next few months then the environment could become supportive for the stock market. Let me know what piece of the puzzle I might be missing that should be analyzed or incorporated to better understand the future direction of the stock market
For further details see:
Stock Market Mid-February Chart Storm (Technical Analysis)