AGG - Stocks Finish April Higher Impressive Earnings Boost Large Caps VB Small-Cap ETF Lags
2023-04-28 16:53:43 ET
Summary
- The S&P 500 turned in a modestly positive April, with gains coming in the last few sessions.
- Small caps, meanwhile, are mired in a stubborn range that now dates back more than a year.
- I see long-term value in domestic smalls but recognize two key price levels that will likely matter in the near term.
We weren't sure there for a while, but the S&P 500 managed to live up to the April hype. Stocks often rally in the first month of the second quarter, according to countless seasonal studies, but large-cap U.S. equities were threatening to finish lower as recently as earlier this week. Alas, robust earnings numbers from mega-cap tech (and tech-related) stalwarts pushed away the bears.
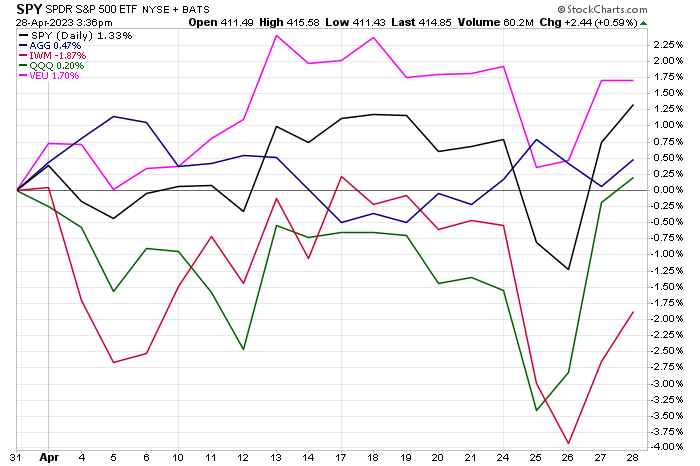
All told, the S&P 500 rallied more than 1% while even the tech-heavy Nasdaq 100, which was down 3%-plus for the month a few trading days ago, managed to squeak out a positive return. Small caps, which I'll detail later, were not so lucky - the Russell 2000 ETF ( IWM ) was lower by nearly 2% on a total return basis. Foreign equities continued their massive rebound off the October low. The Vanguard FTSE All-World ex-US ETF ( VEU ) returned almost 2%. In fixed-income land, the aggregate bond market (Treasuries and investment-grade credit) was actually noticeably quiet. AGG ranged less than two percentage points.
Large Caps Higher, Small Caps Lower In April
Earnings season was the big story. Q1 featured a market peak on Groundhog Day, and a bearish replay of 2008 appeared possible by early the following month. Bulls were, not surprisingly, on edge heading into the reporting period. JPMorgan Chase ( JPM ) issued decent numbers, as did many big money-center banks. Regionals were less impressive, and many of those firms saw their stock prices falter after reporting. Despite what appears to be the demise of First Republic Bank ( FRC ) following Silicon Valley Bank's failure and the receivership of Signature Bank ( SBNY ) domestically (and Credit Suisse's turmoil abroad), the broad market managed to rally. The reason? Strong profits from most other companies.
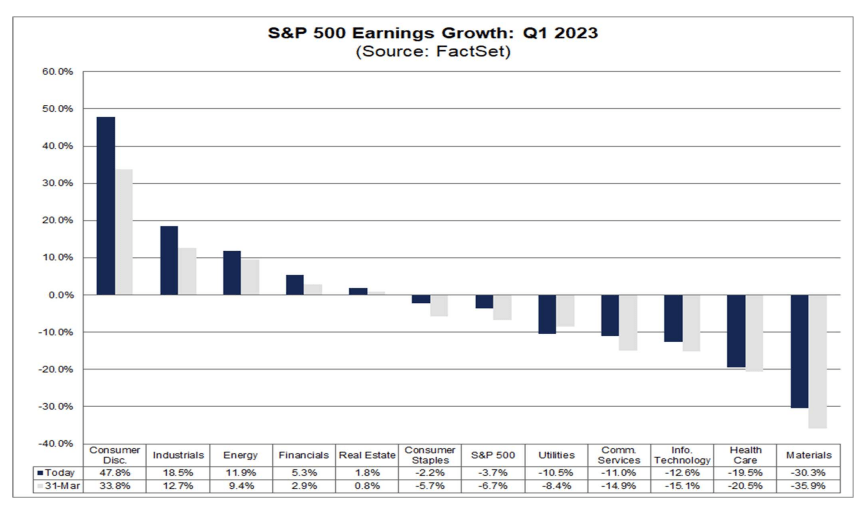
FactSet reports that a high 79% of SPX firms have topped analysts' EPS forecasts. Perhaps more impressive, the revenue beat rate has been stellar at 74%. With inflation fears continuing to ease, a Goldilocks outcome is once again on the table. In a bullish twist, EPS estimates are now back on the rise for 2023 and '24.
Improving Q1 S&P 500 EPS Forecasts
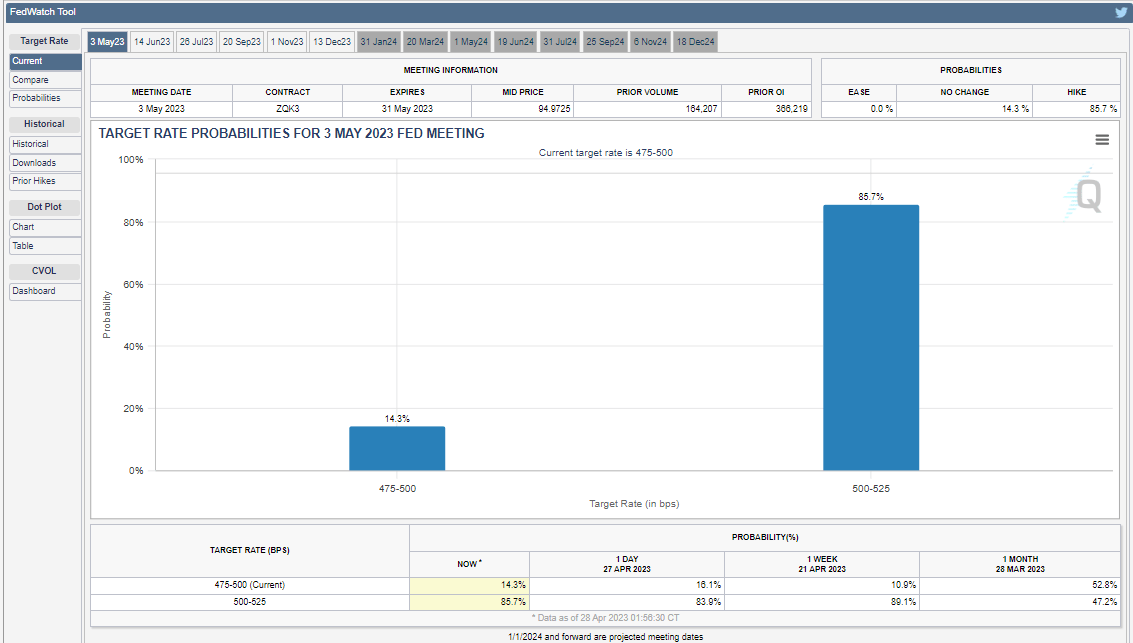
But we have heard that story before. A better growth outlook only emboldens the Federal Reserve to continue hiking interest rates. As it stands, there's a more than 85% chance of another quarter-point policy rate increase at the end of the two-day FOMC gathering next week. What's more, chances of yet another hike are rising for June. The "higher for longer" trade is also back in play. Even so, Treasury yields remain markedly under their peaks from last year.
86% Chance of a Rate Hike on May 3
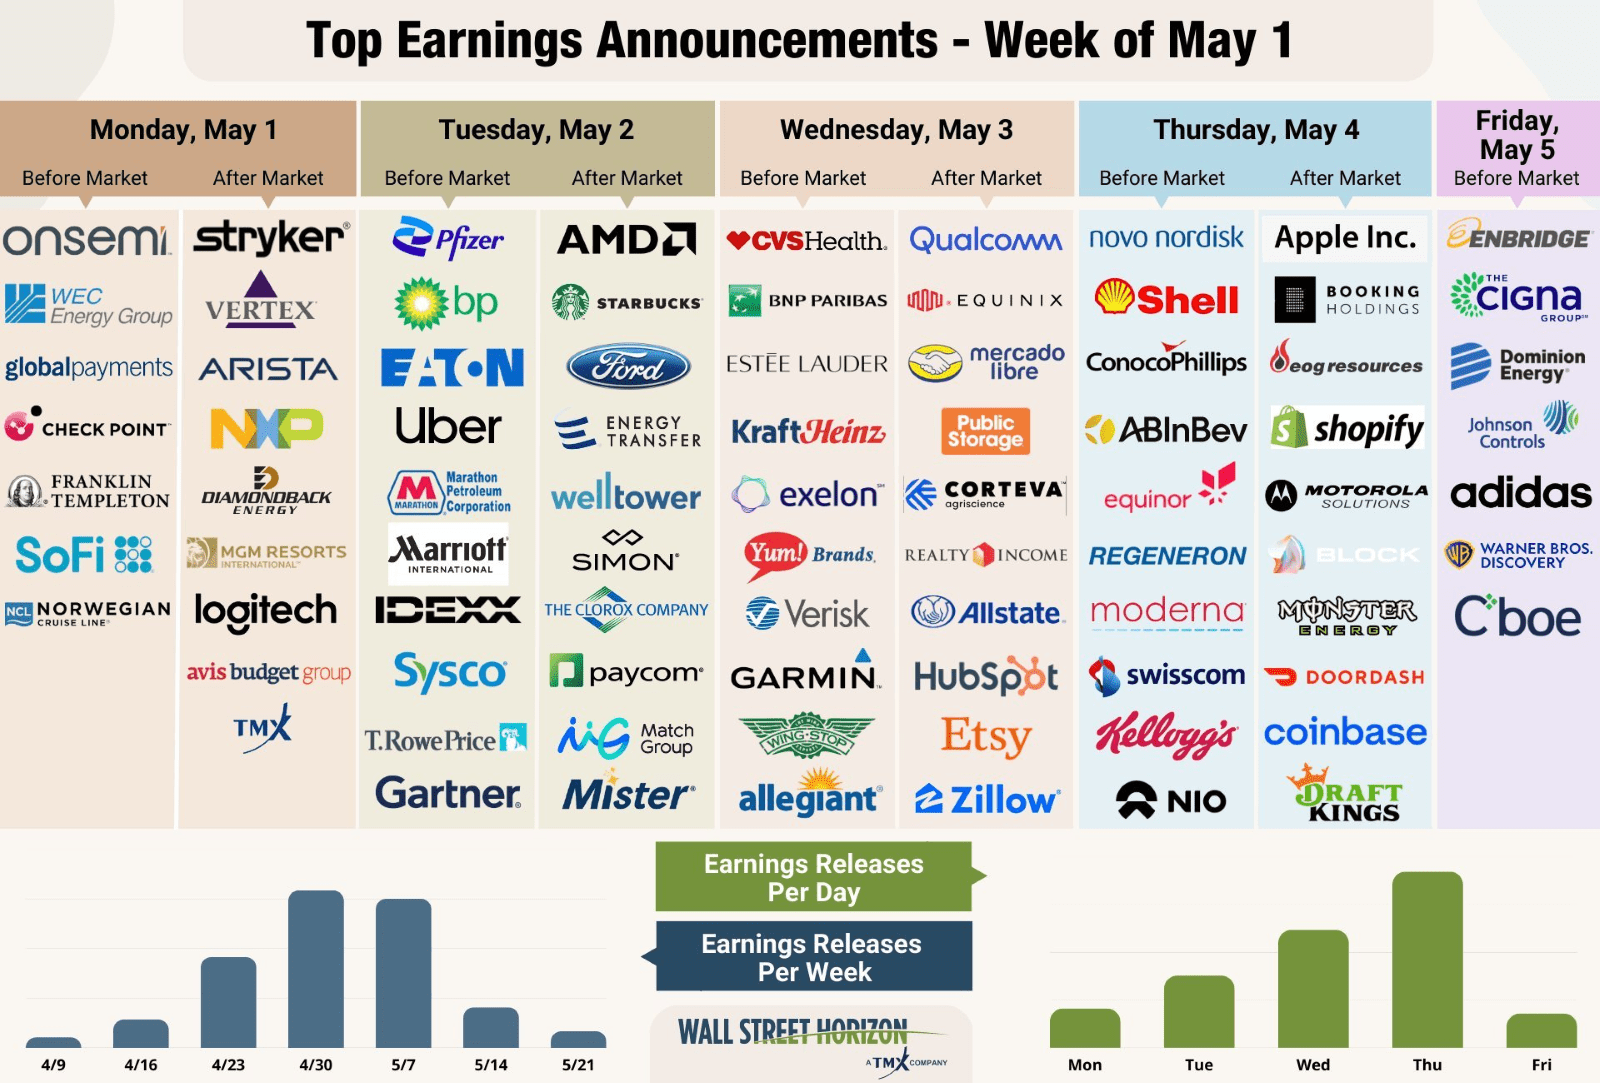
Along with the Fed decision on Wednesday next week, we also hear from the S&P 500's biggest company, Apple (AAPL). Expectations might ratchet up following the positive results from big-cap tech. Also hitting the tape next week are key economic reports: The ISM Manufacturing survey is released on Monday while the April jobs report hits Friday morning (consensus is for a +175k payroll gain). So, there's no rest for the weary.
Big Week of Economic Data
BofA Global Research
Another Major Week of Earnings On Tap
With all that going on, you would think volatility would be something to write home about. Put down your pen and paper because the volatility index ( VIX ) dipped under 16 for a time on the final day of the month. For context, that implied barely a 1% daily change in the SPX. The summer doldrums may be setting in a bit early.
VIX: Nearly The Lowest Weekly Settle Since February 2020
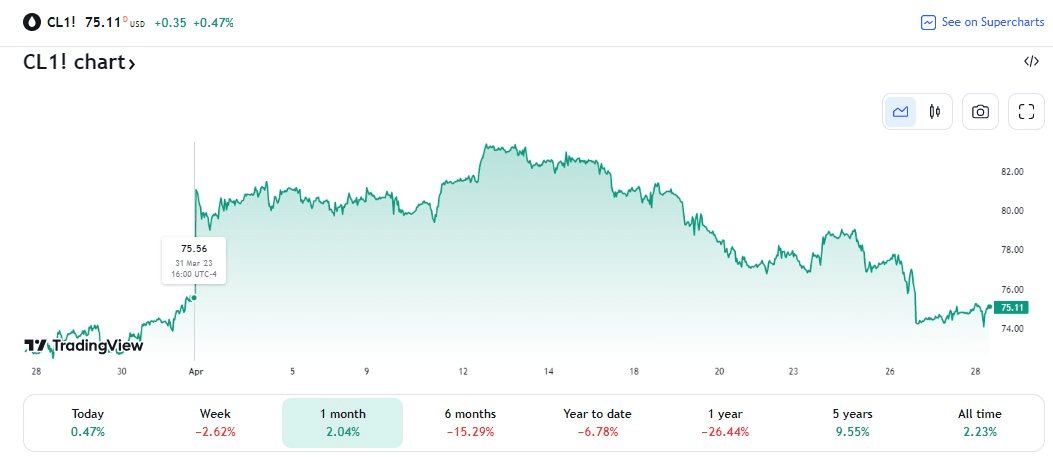
Also conspicuously quiet is the commodities market. I track the Invesco DB Commodity Fund ( DBC ). After a March dip, it has been rangebound. Oil prices - the largest component of DBC - are sagging. The prompt month of WTI crude oil has given up all its post-OPEC-plus gains from several weeks ago as gasoline futures ease (much to the delight of summertime drivers).
Gold made headlines in the last few weeks as the yellow metal topped $2,000 per troy ounce, but bullion did not hold that psychological level by the close of the month.
Crude Oil: Lower From the Post-OPEC Bounce
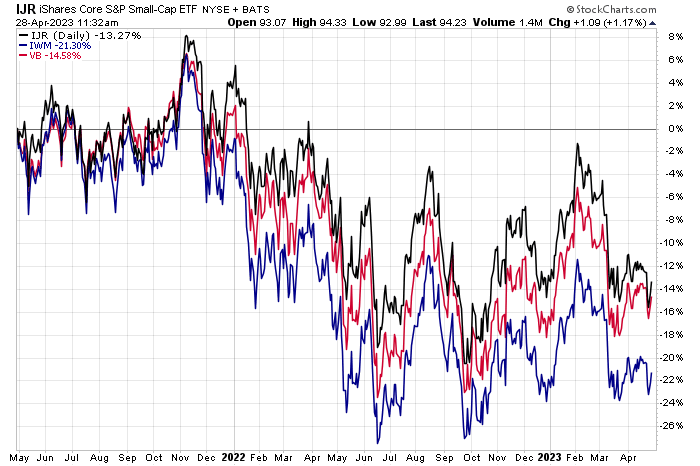
One area of the market I'm keeping close tabs on - the small-cap space. Let's home in on the Vanguard Small-Cap ETF ( VB ). The ETF tracks the performance of the CRSP US Small Cap Index, which measures the investment return of small-capitalization stocks. CRSP is the Center for Research in Security Prices, an affiliate group of the University of Chicago.
It differs from the Russell 2000 ETF and the S&P SmallCap 600 ETF ( IJR ) but generally performs similarly to the latter due to a higher average market cap size. Hence, it produced alpha compared to IWM over many timeframes.
Three Popular Small Cap Funds Last 3 Years: IJR Best, IWM Worst
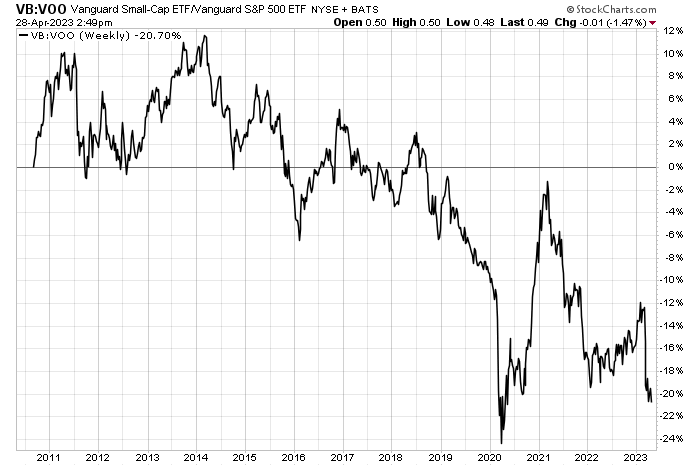
Nevertheless, VB has been a dog compared to Vanguard S&P 500 ETF ( VOO ). Notice in the total return chart below that since the inception of both VB and VOO, large caps have outperformed. In nearly 13 years of data, the small-cap factor has not shown itself. In fact, VB is not far from its all-time relative lows against VOO that were notched during the panic period of March 2020.
Small Caps Vs. Large Caps: Nearing 13-Year Lows
The culprit for the underperformance is the difference between sector weights. VB features more cyclical and value niches while VOO is tech and growth heavy. Many strategists suggest that value could have a prolonged time in the sun, but price action in the last two months suggests otherwise.
Remarkably, small caps have now had back-to-back massively losing months against large caps. Will that trend persist? Hard to tell. But let's take a look at the value case for small caps and the technical picture.
Large Caps +12% Vs. Small Caps Last 2 Months
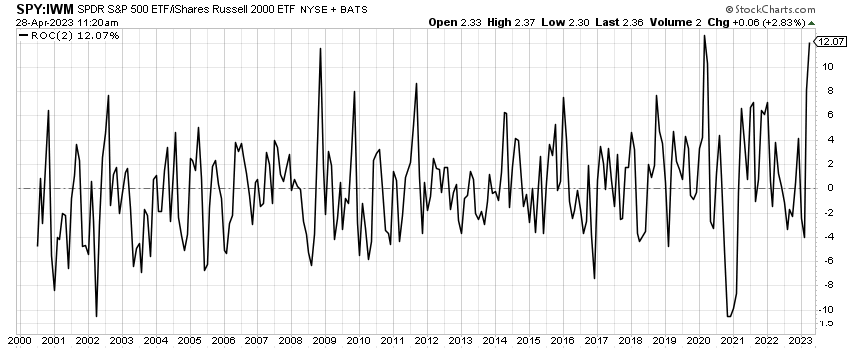
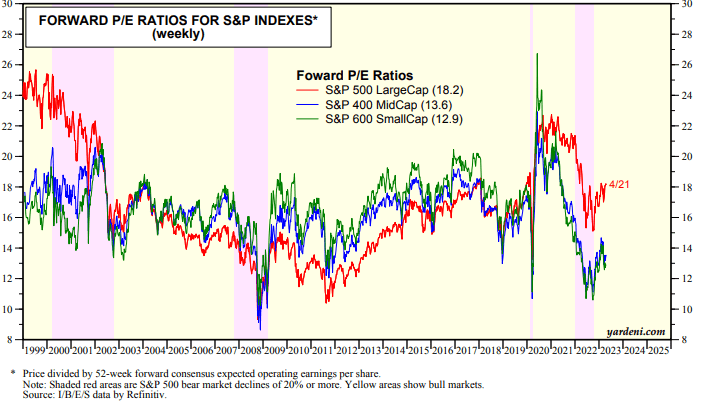
According to Vanguard , VB trades at a modest 12.9 times earnings. Contrast that to the S&P 500's forward operating earnings multiple of more than 18 as of the close of the month. I mentioned that VB and IJR are rather close. Indeed, the S&P SmallCap 600 sells at the same 12.9 times earnings. The graph below illustrates the valuation gap, which is now near its widest level.
Increasing Valuation Differences By Market Cap
The Technical Take
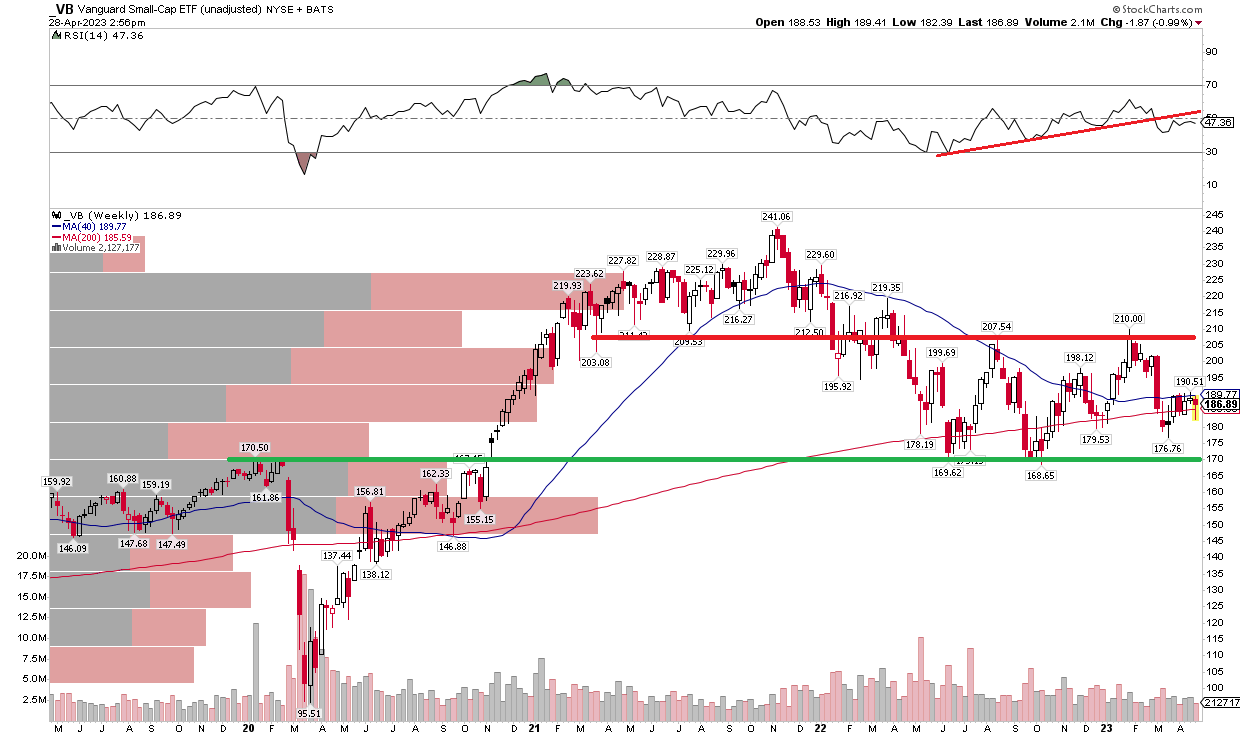
VB's chart is not something technicians like to see. There has been no trend over the last year. The fund has ranged between about $170 and $210. April's settle is near the midpoint of that zone. Also, take note of the flat 40-week and 200-week moving averages that are right near the current price. With heavy congestion in this area, an eventual bullish breakout or bearish breakdown becomes all the more important for future price action.
A weekly close above about $212 would suggest a measured move price target of roughly $250. On the flip side, if VB craters under its June and October double bottom, then an ugly $120 target may be in play. Overall, I'm a near-term hold on VB, but I'm bullish long term on small caps due to their low valuation.
VB: Waning Long-Term Momentum, Persistent Trading Range
The Bottom Line
Small caps struggled in April while the broad market was resilient. The bond market has turned quite ahead of the May 3 Fed rate decision and key economic news that will cross the wires next week. With impressive earnings, the fundamental case looks better today, but the bears can point to a still lofty P/E on the SPX.
For further details see:
Stocks Finish April Higher, Impressive Earnings Boost Large Caps, VB Small-Cap ETF Lags