VTI - Stocks Surge In June All Sectors Positive VTI Now 19x Earnings
2023-06-30 17:07:04 ET
Summary
- Equities posted impressive gains in June, with the risk-on Consumer Discretionary, Industrials, and Materials sectors leading the way.
- Bonds finished modestly lower amid rising rates as better economic data allows the Fed to keep on its rate-hiking path.
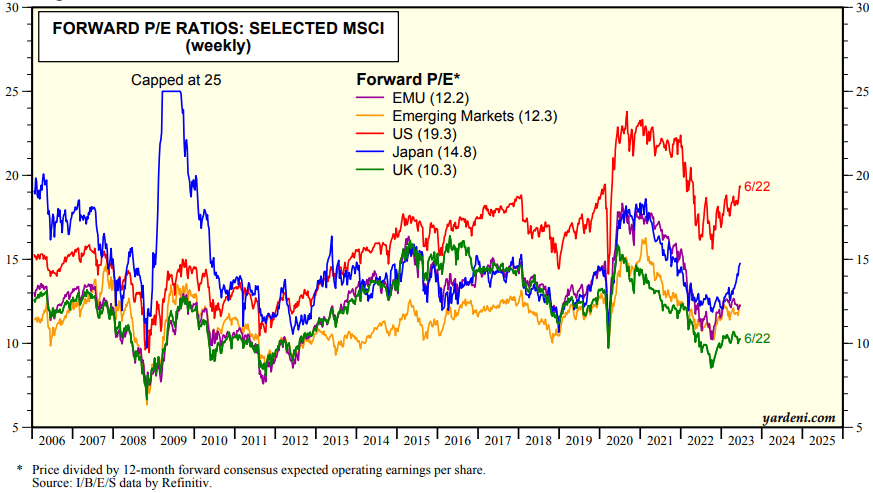
- The broad U.S. stock market now sells for 19 times earnings, historically lofty and expensive relative to other regions.
- I outline key economic events that will likely move markets in July as the bulls look to continue with the reins.
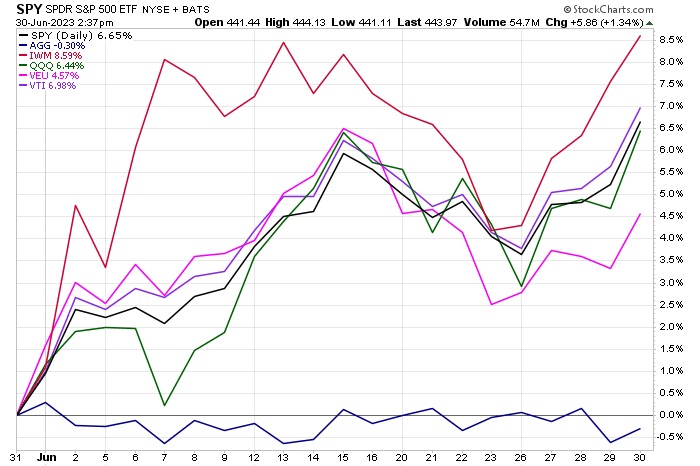
It was a fireworks show of gains in June. There was no swoon in sight as the bulls owned the sometimes-soft month. The S&P 500 (SP500) returned 7%, while the tech-heavy Nasdaq 100-Index (NDX ) notched a 6% advance. Small caps shone, with the Russell 2000 index (RTY) rising 8% amid a broadening out of what had been a “Magnificent Seven”-dominated 2023 rally through May. Foreign equities were higher, but their rally largely fizzled mid-month. Still, international developed, and emerging markets registered a +5% performance. Bonds were slightly lower on a total return basis.
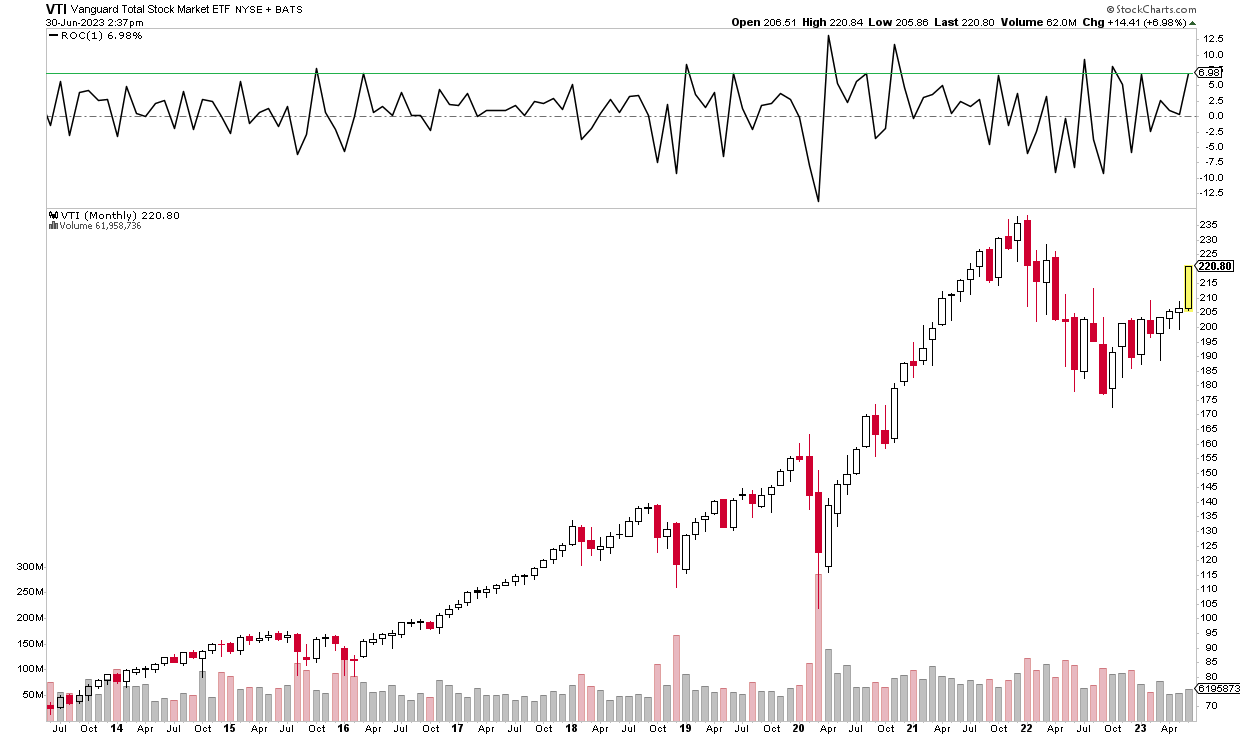
Overall, I have a hold rating on Vanguard Total Stock Market Index Fund ETF Shares (VTI) - the broad gauge of domestic equities featured a remarkable monthly candlestick on the chart. VTI is now higher for four consecutive months, and June’s jump matched January’s climb for the best month of 2023.
June Performances: Small Caps Lead, Ex-US Shares Lag, Bonds Negative
VTI: Matches January For Best Month Of 2023, Major Breakout Candle
Why just a hold on VTI? Consider that the U.S. market now trades at a lofty 19.3 forward operating price-to-earnings ratio. Contrast that with downright cheap valuations away from the states. Even the massive rally in Japanese stocks leaves that country’s market less than 15 times prospective earnings. Other developed markets and the Emerging Markets index sell at P/E multiples not much higher than 10, according to Yardeni Research and Refinitiv data.
U.S. Stocks Relatively Pricey
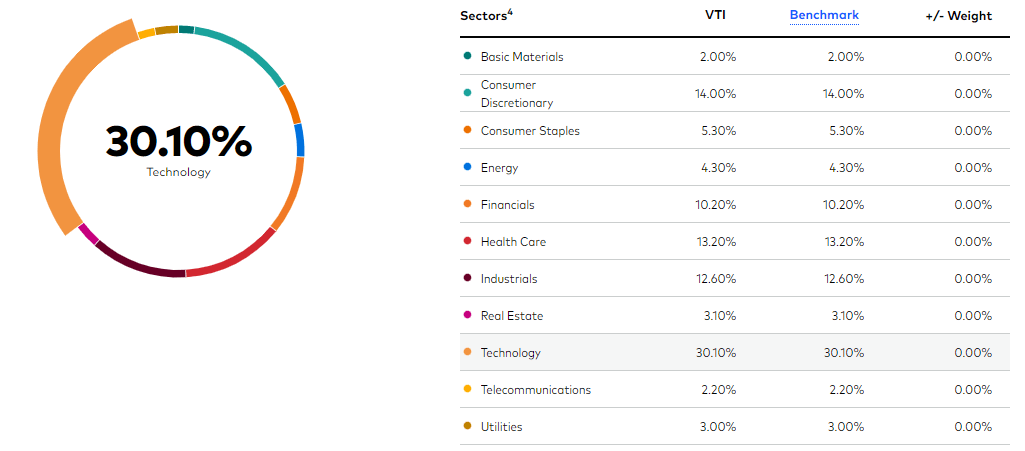
Of course, VTI remains a solid long-term holding for its high liquidity and low-cost access to the broad U.S. market. I own it and have no plans to sell it from my long-term account. According to Vanguard , the ETF seeks to track the performance of the CRSP US Total Market Index by owning large, mid, and small caps across the growth and value styles through a passively managed, index-sampling strategy. Its expense ratio is 0.03% and the 30-day median bid/ask spread is a single basis point. With strong tradability, VTI’s 25-day average volume is nearly three million shares, and its yield is 1.6%.
VTI: Nearly One-Third In Tech
Driving the fund’s gains in June was a developing goldilocks economic situation. Easing inflation and robust growth numbers are just what the bulls want to see play out as we enter the second half. What I find particularly encouraging is that equities have powered higher while interest rate expectations have only increased. As of June 30, rate traders see the Federal Reserve hiking its policy rate one more time to the 5.25% to 5.50% range at the upcoming July 26 FOMC gathering. We cannot rule out another increase, either. Chief Powell has already outlined that the Fed plans two more hikes, and the market has continued to shift toward the FOMC’s forecast despite calls not long ago for rate cuts by year-end—now, that might not happen until March 2024, according to the CME FedWatch Tool .
One Rate Hike or Two? Equities Shrug Off the Uncertainty
CME FedWatch Tool
Real rates continue to rise. Earlier this week, the 5-year inflation-adjusted yield climbed to 2% for the first time this cycle. Looking ahead, Core CPI is seen as retreating under 3% early next year according to most forecasts.
Easing Inflation Concerns: YoY CPI Continues To Fall
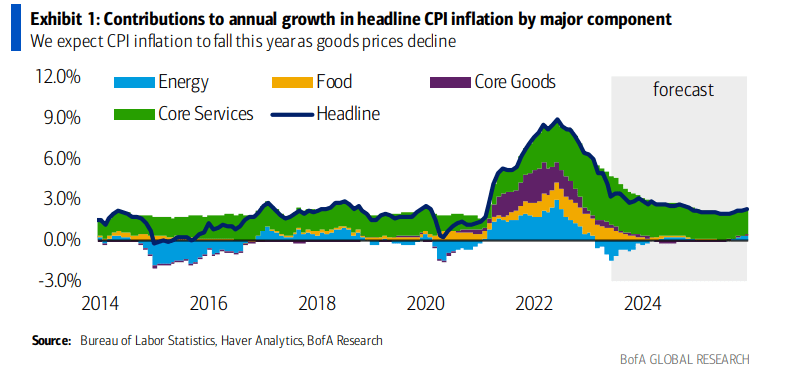
As for the growth side of the ledger, calls for a second-half recession keep getting pushed out. With 2.2% expected real GDP growth for Q2, per the Atlanta Fed’s GDPnow model, there is no technical recession in sight.
Q2 Real GDP Growth Seen Above 2%
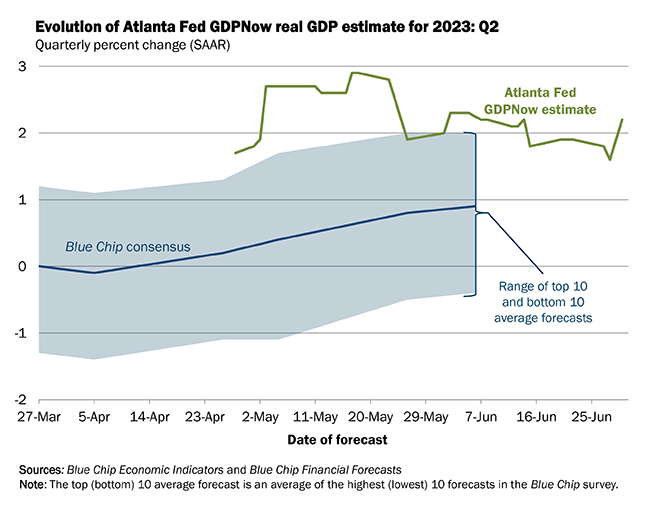
And an official “NBER” recession seems even further off. The National Bureau of Economic Research ((NBER)) looks at several key gauges in retrospect to deem an official U.S. recession. The below view from J.P. Morgan Asset Management illustrates that only Real Wholesale Trade & Retail Sales suggest softness. And I would take issue with the notion that the domestic consumer is weak right now. Discretionary spending is decent, and travel spending specifically remains fully in flight.
No "NBER" Recession Any Time Soon
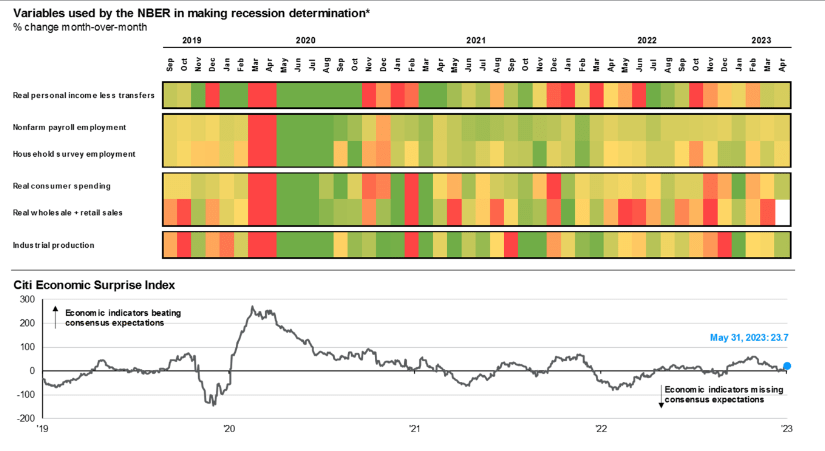
The Resilient American Consumer
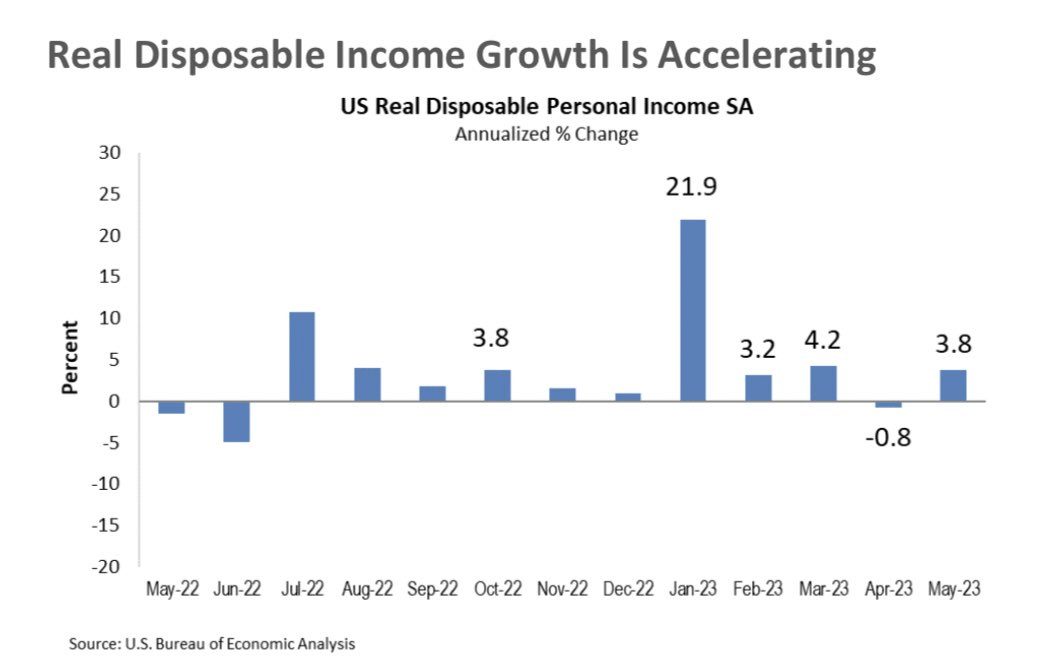
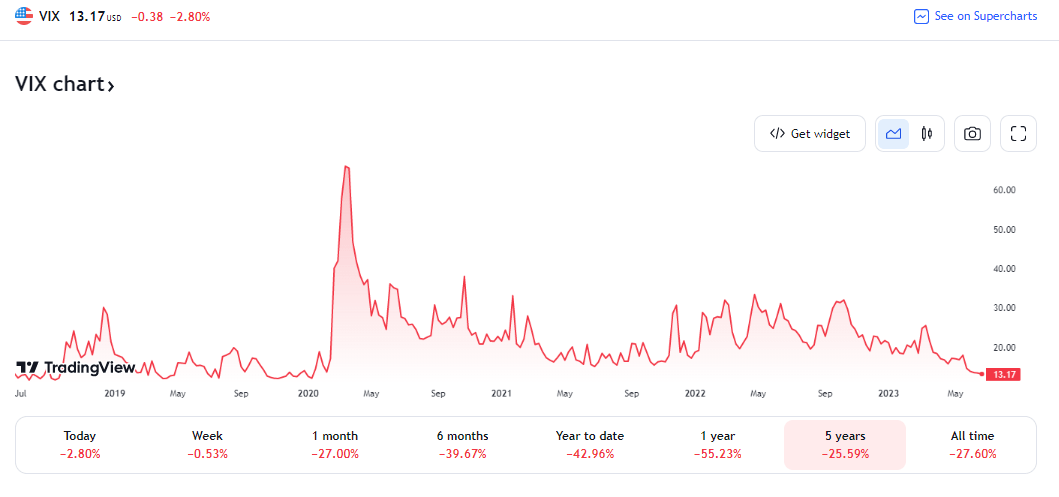
Getting back to the market and what the second half might have in store, I urge investors to keep their eyes on volatility. The CBOE VIX Index (VIX) ended June at its lowest monthly percentage since January 2020.
A Sleep Summer Ahead? VIX Near 3-Plus Year Lows
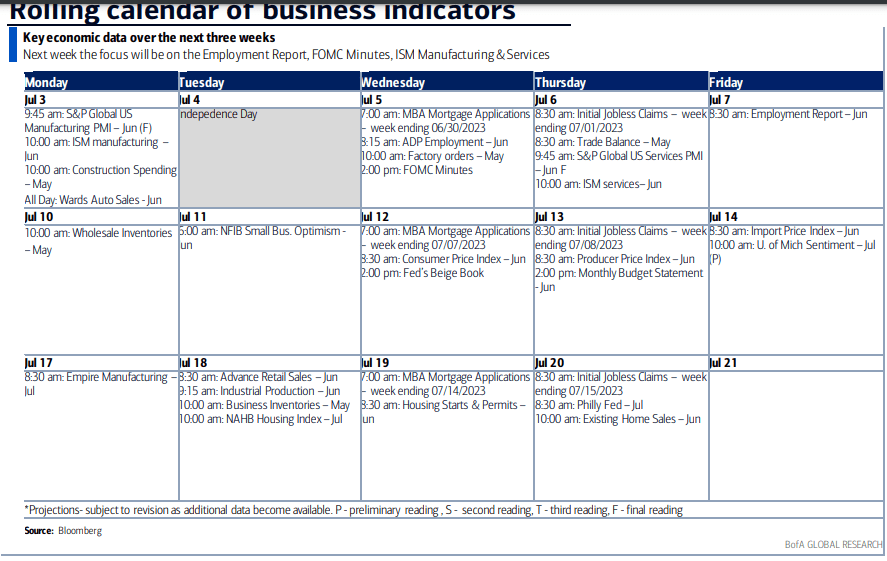
If we see hiccups in employment data or deterioration in manufacturing and services data, then that could throw shade on the new “no landing” narrative. Watch next Friday’s June employment report as well as key ISM data that is released before the jobs numbers. Considering recent regional manufacturing figures, Monday’s June ISM gauge will likely come in under 50, in contraction territory once again.
Manufacturing Remains Soft
BofA Global Research
Key Economic Data In July
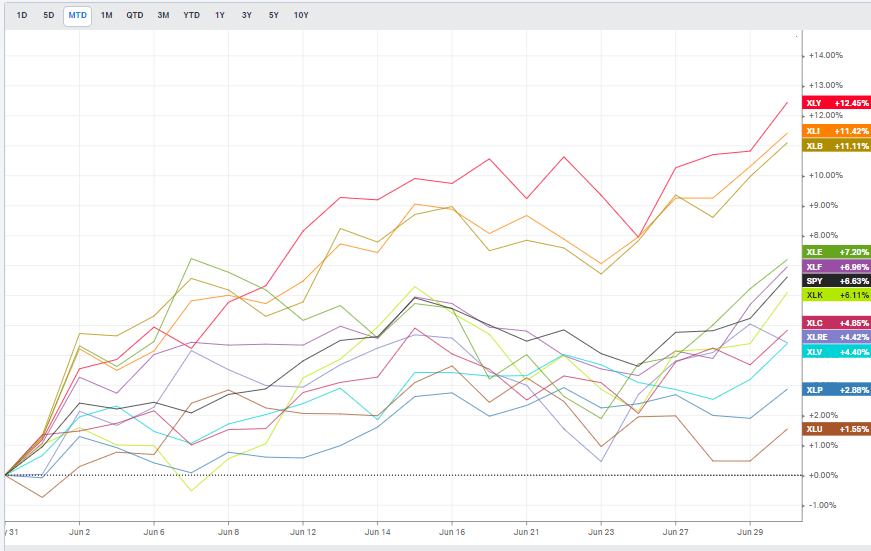
The bullish take is simply price action. VTI has benefited compared to the S&P 500 with respect to sector performances. In June, the risk-on Consumer Discretionary, Industrials, and Materials areas outperformed the Information Technology and Communications Sector where so many mega-caps are housed. Also notice that the two most defensive sectors, Utilities and Consumer Staples, were the weakest in June (though all sectors posted gains).
June S&P 500 Sector Performances: Risk-On Areas Top of the Pack
Let’s home in on where VTI may go from here.
The Technical Take
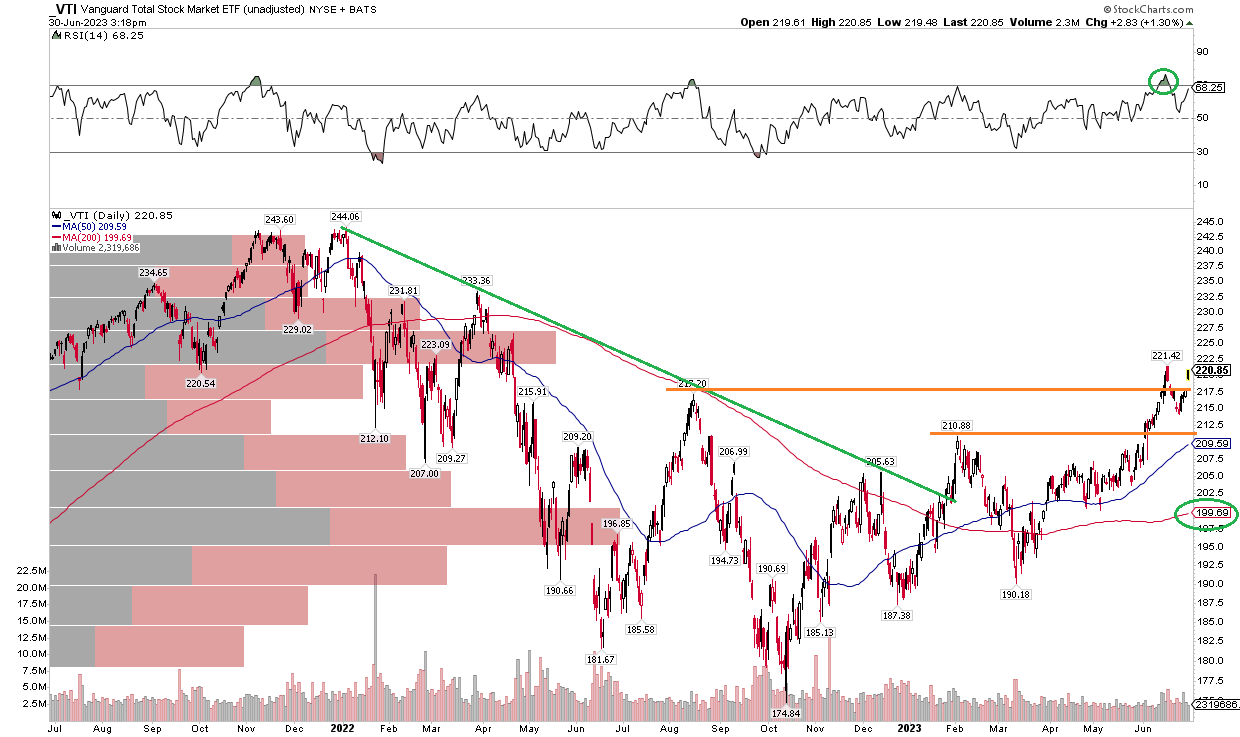
The ETF has rallied above both the August 2022 peak and the high from earlier this year. While it still has to take out the June spike high, the bulls appear to have their eyes set on more gains. Notice in the chart below that VTI’s long-term 200-day moving average has begun to turn positively sloped while the RSI momentum gauge at the top of the graph ranges in the bullish 40 to 90 zone. While RSI reached technical overbought conditions, the ensuing pullback was constructive, holding the February high. So long as VTI is above $210, I assert the short and intermediate trends favor the bulls.
VTI: U.S. Stocks Surge Above Resistance On Strong Momentum
The Bottom Line
Momentum is strong with U.S. stocks right now, but their valuation is stretched at near 19x forward earnings. I assert Vanguard Total Stock Market Index Fund ETF Shares should be a market-weight hold right now, and more cyclical areas, including inexpensive foreign stocks, warrant a closer look as we enter the second half.
For further details see:
Stocks Surge In June, All Sectors Positive, VTI Now 19x Earnings