XLF - Strong IBM Performance May Point To New S&P 500 Bear Market: History Repeat? (Technical Analysis)
2023-11-16 23:52:56 ET
Summary
- IBM's stock has historically risen during and after market tops, due to its high dividend payout and perceived safety in times of uncertainty.
- A recent surge in IBM's quote may be warning of trouble into 2024, with rising interest rates and a contraction in total banking system credit this year leading to recession.
- Shares have been a defensive winner measured from late 2021, with outlier gains since the summer potentially screaming another Wall Street selloff is approaching.
I wrote a piece on the long and confusing history of International Business Machines ( IBM ) moving up strongly when Wall Street is generally rolling over in price. For example, IBM reached multi-year highs in early 2020, right as the COVID-19 pandemic was starting to make headlines. This awkward and hard to explain occurrence (for a stock that has underperformed overall for decades) highlighted another important "market" peak in February of that year. You can reread my interesting take on this not-so-well-known market warning signal here .
Seeking Alpha - Paul Franke, IBM Article, February 11th, 2020
Why does IBM attract buyers at Wall Street highs? This was my take at the beginning of the February 2020 article:
I don’t have a great answer, but IBM’s spike higher in January and February confirms my worry the 2020 Wall Street bull may be about to turn into a bear... My best explanation for why IBM rises smartly around market tops is this investment trades as a function of its traditionally high dividend payout. Scoring highly on blue-chip safety and liquidity characteristics, including stable government and big business contract revenues insulating operating performance from a deep recession, experienced investors flock to the stock in times of uncertainty. When large investors get nervous, one knee-jerk reaction is to purchase IBM, kind of like buying gold.
My 2020 article essentially nailed the S&P 500 ( SP500 ) top within a few days, where selling index-related ETFs like the SPDR S&P 500 ( SPY ) product made plenty of rational sense, using my proprietary analysis.
YCharts - IBM vs. S&P 500 ETF, Total Returns, December 2019 - March 2020, Author Reference Point
My question today for market participants is why is IBM streaking higher this fall, breaking out to new multi-year highs again? Could it be a new warning sign of trouble coming in 2024? My simple answer is YES, something may be amiss again on Wall Street. Rising interest rates, an approaching recession per the Treasury yield curve pattern (widest inversion since 1982) and large 2023 contraction in total banking system credit (worst growth since 2009), plus AI boom sentiment in the Big Tech stocks may be setting in motion the conditions that have normally led to bear market corrections of -20% or greater.
YCharts - IBM vs. S&P 500 ETF, Total Returns, 6 Months
Previous IBM vs. Market Top Patterns
Does IBM outperformance mean the market is headed for a dive all of the time? Of course not. At various moments in the economic and company development cycle, IBM will fluctuate like any other stock. On top of this, IBM often performs well near market bottoms, as a defense play attracting lots of Wall Street attention. If you only use IBM to try and time market swings in value, it won't work that well.
My point is IBM is usually witnessing powerful flight-to-safety buy inflows near and right after U.S. equity market peaks. It's a small piece of the market direction puzzle to watch and ponder. What's fascinating is IBM has a track record of rising rapidly just before each of the -20% market corrections since 1990. It hasn't experienced a material price drop just before a Wall Street peak (and -20% bear market) in many decades.
Exactly how did IBM perform at other important peaks? Let's run through history a bit and see. With the 2020 instance pictured above, I will now draw graphs for the 2022, 2011, 2007, 2000, 1998 and 1990 tops. You will notice concentrated strength in IBM right before and after each S&P 500 high point.
January 2022 Top
YCharts - IBM vs. S&P 500 ETF, Total Returns, November 2021 - October 2022
August 2011 Top
YCharts - IBM vs. S&P 500 ETF, Total Returns, January - December 2011
October 2007 Top
YCharts - IBM vs. S&P 500 ETF, Total Returns, May 2007 - December 2008
August 2000 Top
YCharts - IBM vs. S&P 500 ETF, Total Returns, November 1999 - December 2001
July 1998 Top
YCharts - IBM vs. S&P 500 ETF, Total Returns, March - August 1998
July 1990 Top
YCharts - IBM vs. S&P 500, Total Returns, January - October 1990
Final Thoughts
The powerful November upswing in IBM has the hair on the back of my neck standing up. My spider-sense says now is the time to watch out below. The burst of enthusiasm by analysts and investors off the October market lows wreaks of blow-off top sentiment on Wall Street. Maybe we go another 5% higher for the major Wall Street indexes over the next couple of weeks/months, maybe we don't. Either way, if a recession is finally starting, there's plenty of downside potential given a meaningful drop in corporate income levels during 2024.
If you want to think about examples of irrational exuberance, Target ( TGT ) here and Macy's ( M ) here each reported absolutely horrible sales results this week (the "volume" of goods moved was down around -8% for TGT and -10% for M, after adjusting for inflation). Both subsequently rallied robustly on the "good news" of analyst beats? These numbers are horrific and the kind you see in a recession, but a relief rally was the result as neither reduced already low expectations for the Christmas sales season.
I will say the Cisco ( CSCO ) guidance warning yesterday (November 15th, 2023) is another slap in the face of an impending economic downturn. When the high-growth internet businesses of the world are pulling back on cloud and network spending, the whole economy is probably not in the best shape. I wrote about Cisco's bellwether status for overall business fortunes in January here .
In addition, I have been explaining since March the growing disconnect between stock trading at financials/banks and smaller capitalization companies vs. a handful of Big Tech names (now nicknamed the Magnificent 7 ). The unexpected jump in long-term interest rates in America since early summer is also weighing on deep cyclicals, REITs, utilities and more. In terms of breadth participation, the span since August has been one of the weakest I can remember over 36+ years of trading (a huge negative historically). Alongside the rare and unique IBM pattern of strength of late, I have serious concerns about Wall Street's direction over the next 3-6 months.
For IBM shareholders specifically, the odds favor a continuing trend of "outperformance" vs. the blue-chip S&P 500 index. Following the well-above average gains outlined since late 2021, I suspect shares will be able to remain flat or fall less than the average stock another 3-6 months. I am not confident enough in the stock market's immediate future to put a Buy rating on IBM. So, I will stick with a Hold/Neutral view, which is far better than my Sell to Strong Sell ratings on various Big Tech names. For sure, IBM's 4.4% dividend rate is very attractive vs. 1.5% delivered by the S&P 500.
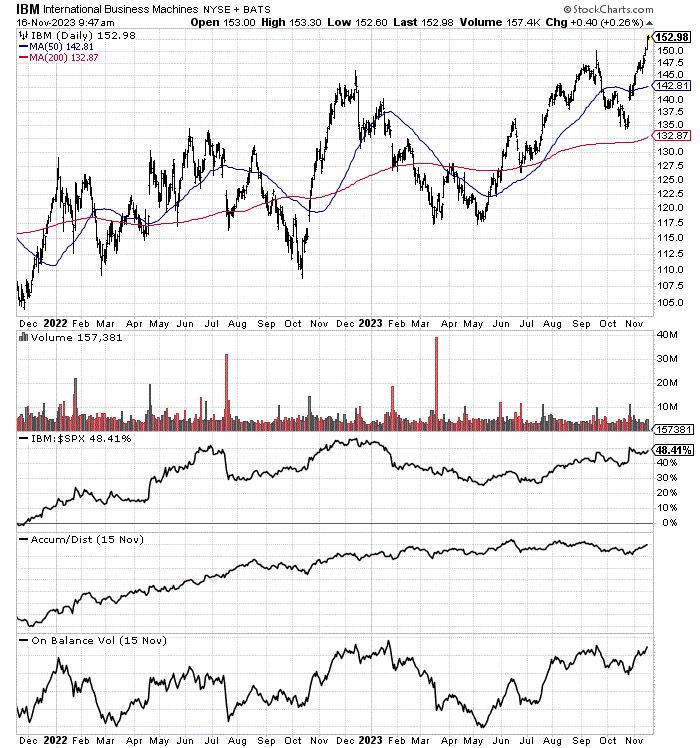
StockCharts.com - IBM, 2 Years of Daily Price & Volume Changes
Thanks for reading. Please consider this article a first step in your due diligence process. Consulting with a registered and experienced investment advisor is recommended before making any trade.
For further details see:
Strong IBM Performance May Point To New S&P 500 Bear Market: History Repeat? (Technical Analysis)