QQQ - Summer Swoon Or Surge? May Returns Concentrated Among Mega Caps SCHB Rally Pauses
2023-05-31 16:00:29 ET
Summary
- The S&P 500 Index remained largely unchanged in May, with mega-cap tech stocks providing support.
- Semiconductor stocks experienced significant gains due to the emerging AI boom.
- The market outlook for the summer is uncertain due to poor market breadth and weaker seasonal trends.
Strength in mega-cap tech helped support stocks in May, but concerning breadth trends kept the bulls from getting too excited.
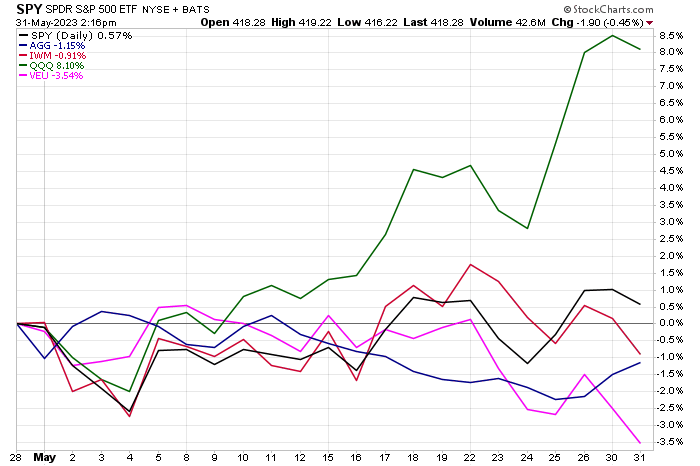
For the month, the S&P 500 Index (SP500) was close to the unchanged mark, finishing fractionally higher. The Nasdaq 100 ETF (QQQ) surged nearly 8%, while more value and cyclically-oriented small caps, as measured by the iShares Russell 2000 ETF (IWM), were down about 1%.
Overseas, early-year strength in the Vanguard FTSE All-World ex-US ETF (VEU) paused in May – the exchange-traded fund ("ETF") was down more than 3%.
In the fixed-income space, the aggregate bond market was lower by 1%, dividends included.
Looking ahead, I have a hold rating on the broad market when analyzing the Schwab U.S. Broad Market ETF™ ( SCHB ).
Stocks Sputter in May, Tech Enjoys Monster Gains
Bad Breadth: A Handful Of Companies Capture The May Gains
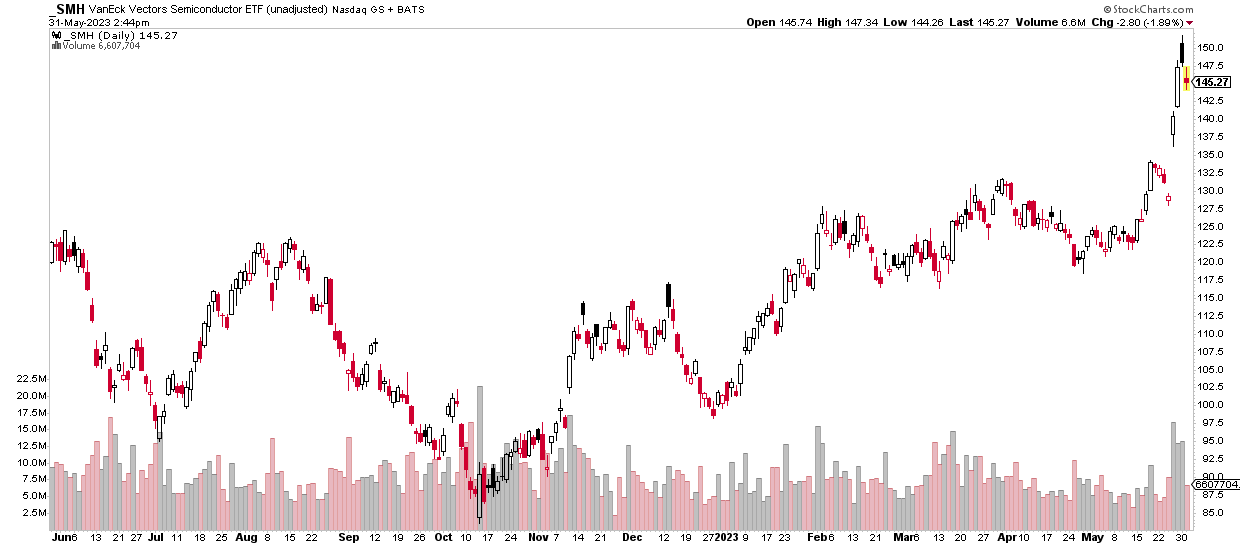
The big story was the massive move in chip stocks care of the emerging AI boom. As bubble talks brew, the VanEck Vectors Semiconductor ETF (SMH) surged from near the low $120s to start the month to a high above $150 for a time on the penultimate day of May before moving lower on the 31 st .
There are signs that this hotbed industry could be peaking in terms of technical price action – the high on Tuesday was notched in the morning as sellers emerged in the afternoon. The fund then underperformed the S&P 500 on Wednesday. SMH is perhaps the most impacted major ETF that is exposed to AI mania right now.
Semiconductor Stocks Surge in May, Leading SPX
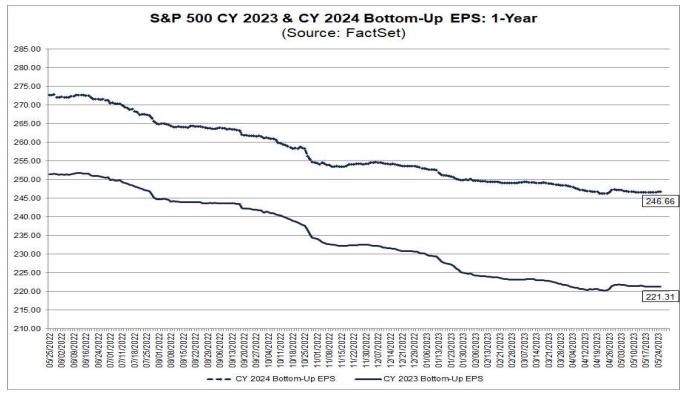
Bigger picture, the second quarter earnings season verified much better than Wall Street’s best and brightest feared. With 78% of SPX firms topping estimates, highlighted by Nvidia Corporation’s (NVDA) blowout Q2 report , the blended earnings growth rate is –2.1%, according to John Butters at FactSet. “If -2.1% is the actual decline for the quarter, it will mark the second straight quarter that the index has reported a decline in earnings,” according to Butters.
But with a robust YTD rally in stocks, the forward 12-month P/E is somewhat pricey at 17.8 as we head into the summer months. The good news is that analysts’ earnings estimates have stabilized. I imagine EPS projections may even creep higher given decent current-quarter consumer spending and GDP growth expectations.
S&P 500 Earnings Estimates No Longer Falling
A Recession For Another Day: Q2 GDP Seen Near 2%
Atlanta Fed GDPnow
But all eyes remain on what the Fed will do at its June 14 meeting. In less than two weeks, following very dovish comments from Tim Harker, President of the Federal Reserve Bank of Philadelphia earlier today, there’s now less than a 1-in-3 chance of a rate rise. But the market still prices in one more hike through July.
A Sudden Shift To "No Hike" Fed Expectations For June
CME FedWatch Tool
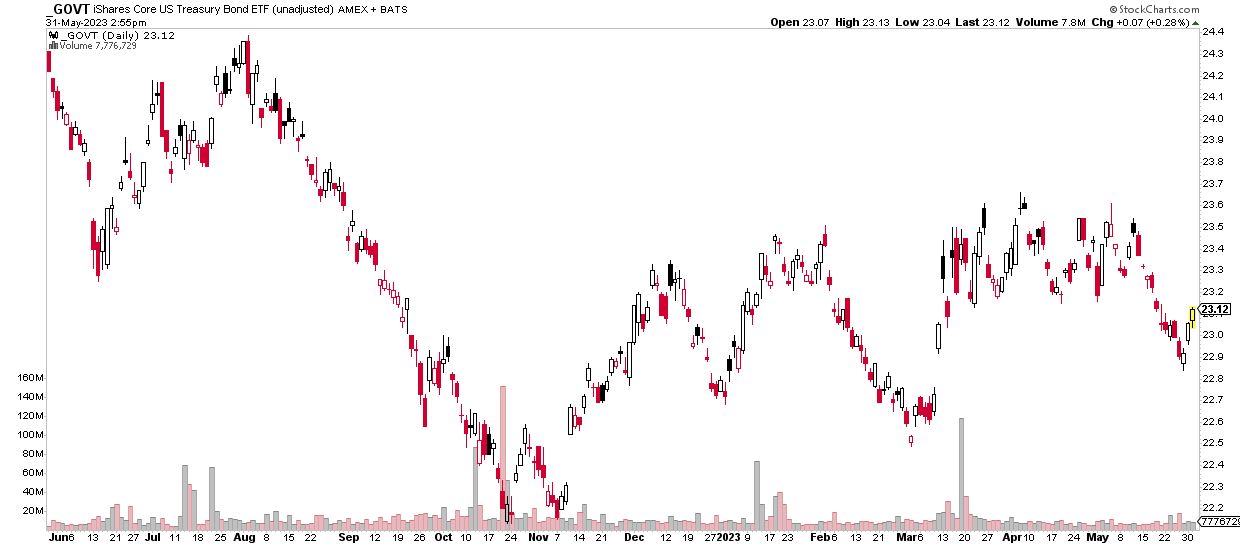
Amid mixed economic data lately, the Treasury market has caught a bid after falling for much of May. I track the iShares Core U.S. Treasury Bond ETF (GOVT) for a broad look at the government bond market. It finished the month with three straight strong rallies, implying lower yields across the curve.
Treasuries Rebound To Round Out May
A bond bid arrived as lawmakers managed to orchestrate a deal with the White House on a lift of the debt ceiling. Equities had largely looked beyond the battle in DC, but the bond market had been more jittery. The T-bill maturing on June 6 had surged to nearly 7% last week but then traded back near 5% by month-end in light of a fiscal compromise.
T-Bill Yields Plunge Amid A Debt Ceiling Agreement
Sober Look
With all that hoopla, the U.S. Dollar was in rally mode throughout the month – that, in part, caused foreign equities to underperform so dramatically. A stronger greenback also sent the prompt-month price of crude oil ( CL1:COM ) tumbling under $70 this week. The stronger dollar is a headwind for stocks heading into June.
US Dollar Index: Rallies Off 101 Support
TradingView
Let’s take a closer look at the U.S. stock market, via SCHB, and where it may go as the summer doldrums ensue.
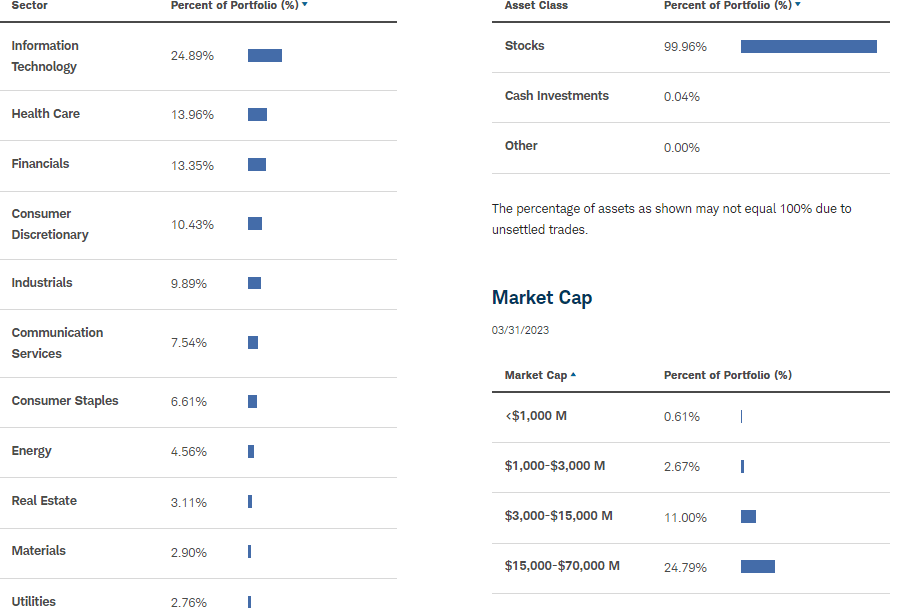
According to the issuer , SCHB’s goal is to track as closely as possible, before fees and expenses, the total return of the Dow Jones U.S. Broad Stock Market Index. It is a straightforward, low-cost fund offering potential tax efficiency that can serve as part of the core of a diversified portfolio. The ETF consists of the 2,500 largest publicly traded U.S. companies and provides a comprehensive measure of large-cap, mid-cap, and small-cap U.S. equity securities.
SCHB, despite holding mid and small-cap stocks, features heavy exposure to the Information Technology sector. As such, the ETF’s weighted average market cap is high at $465 billion as of March 31, 2023. But with a net annual expense ratio of just three basis points, it is about as inexpensive as you will get for broad US equity access. Total assets under management sum to more than $21 billion and the fund yields about 1.6%.
SCHB: Tech-Heavy, Mega-Cap Oriented
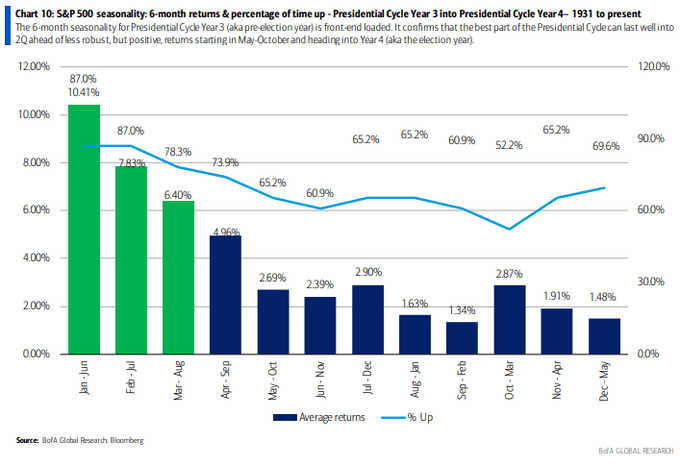
As we embark on June, it’s key to recognize seasonal performance trends in this pre-election period. According to BofA Global Research, the June through November stretch of a pre-election year has, on average, featured lackluster returns, and the percent positive rate is just 60% as the bulk of pre-election year gains are focused in the early portion of the year. So, this is a neutral piece of evidence in my view.
S&P 500 Seasonality Turns Less Bullish June-November
The Technical Take
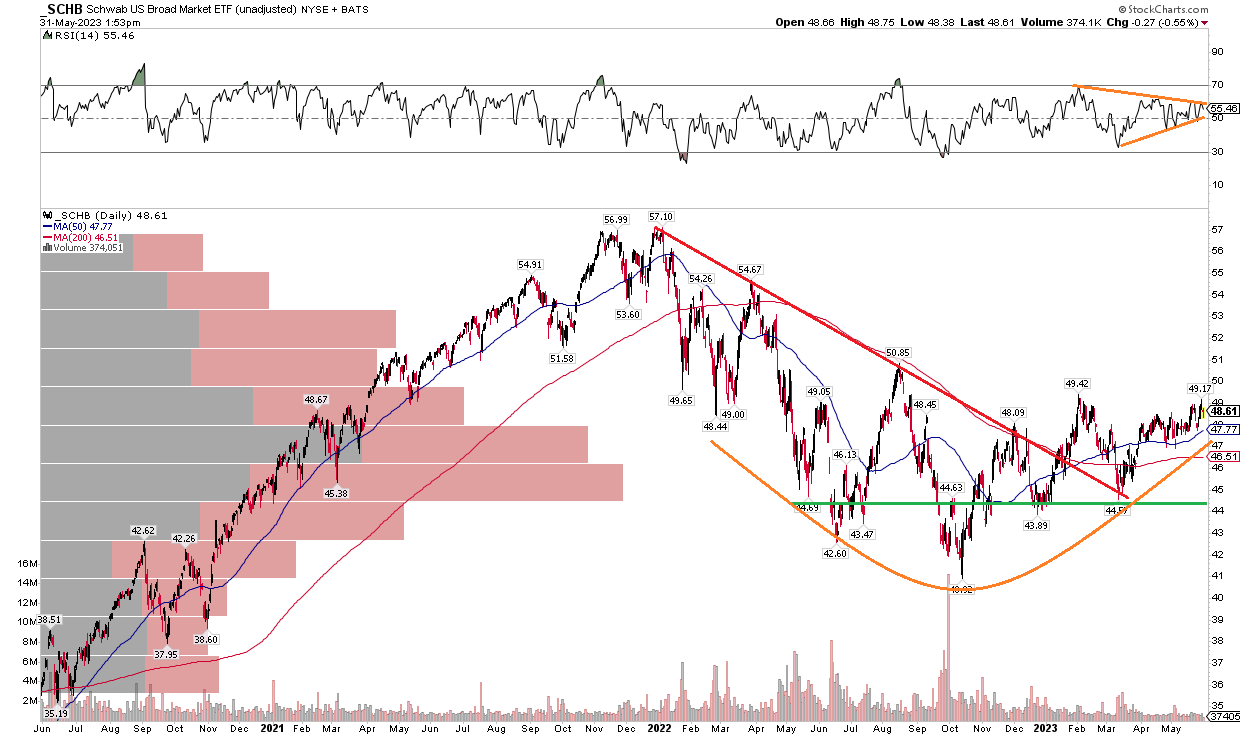
With neither bullish nor bearish seasonal trends, the chart also appears in a holding pattern. Notice in the graph below that Schwab U.S. Broad Market ETF™ has been working on a bullish rounded bottom pattern but take a look at the top of the chart. The RSI momentum index has been consolidating in a symmetrical triangle. Be watchful for a break from that momentum coil as it could portend the next intermediate market trend.
For now, the fund’s long-term 200-day moving average is sideways, indicating trendless price action, though SCHB remains above that price indicator. I would like to see SCHB rally above the $49 to $51 zone to help confirm a continuation of the bearish to bullish reversal off the October low. I see support near $44 – that's not only the late 2022 and March 2023 lows but where the base of strong volume by price is seen. Overall, the Schwab U.S. Broad Market ETF™ chart shows some promise, but the uptrend appears paused for now.
SCHB: Equities Consolidating Heading into June, Rally on Hold
The Bottom Line
I am a hold on the broad market here. There are signs that a shaky summer could ensue amid poor market breadth and lackluster seasonal trends.
For further details see:
Summer Swoon Or Surge? May Returns Concentrated Among Mega Caps, SCHB Rally Pauses