SUM - Summit Materials: Growth Relative To Assets + Capital Not As Attractive
2023-11-27 07:33:38 ET
Summary
- Summit Materials is a construction materials company that has outperformed the S&P 500 this year.
- Investing in construction and infrastructure can provide stable cash flows and manage portfolio volatility.
- Summit Materials' merger with Cementos Argos could enhance its market position and capacity expansion.
- Projected growth may not translate to investor value based on this analysis.
Investment Outlook
Summit Materials ( SUM ) is a high-margin construction materials company that has outpaced the S&P 500's price change this year to date. It displays a number of interesting readouts. Further, the market looks to be valuing SUM on a combo of (1) earnings growth and (2) cash produced for investors.
The case for tactical allocation to construction + infrastructure is gaining appeal, as real assets can potentially lower portfolio volatility and offer predictable cash flows through distributions. The companies underneath are typically robust as well, producing dependable investment income.
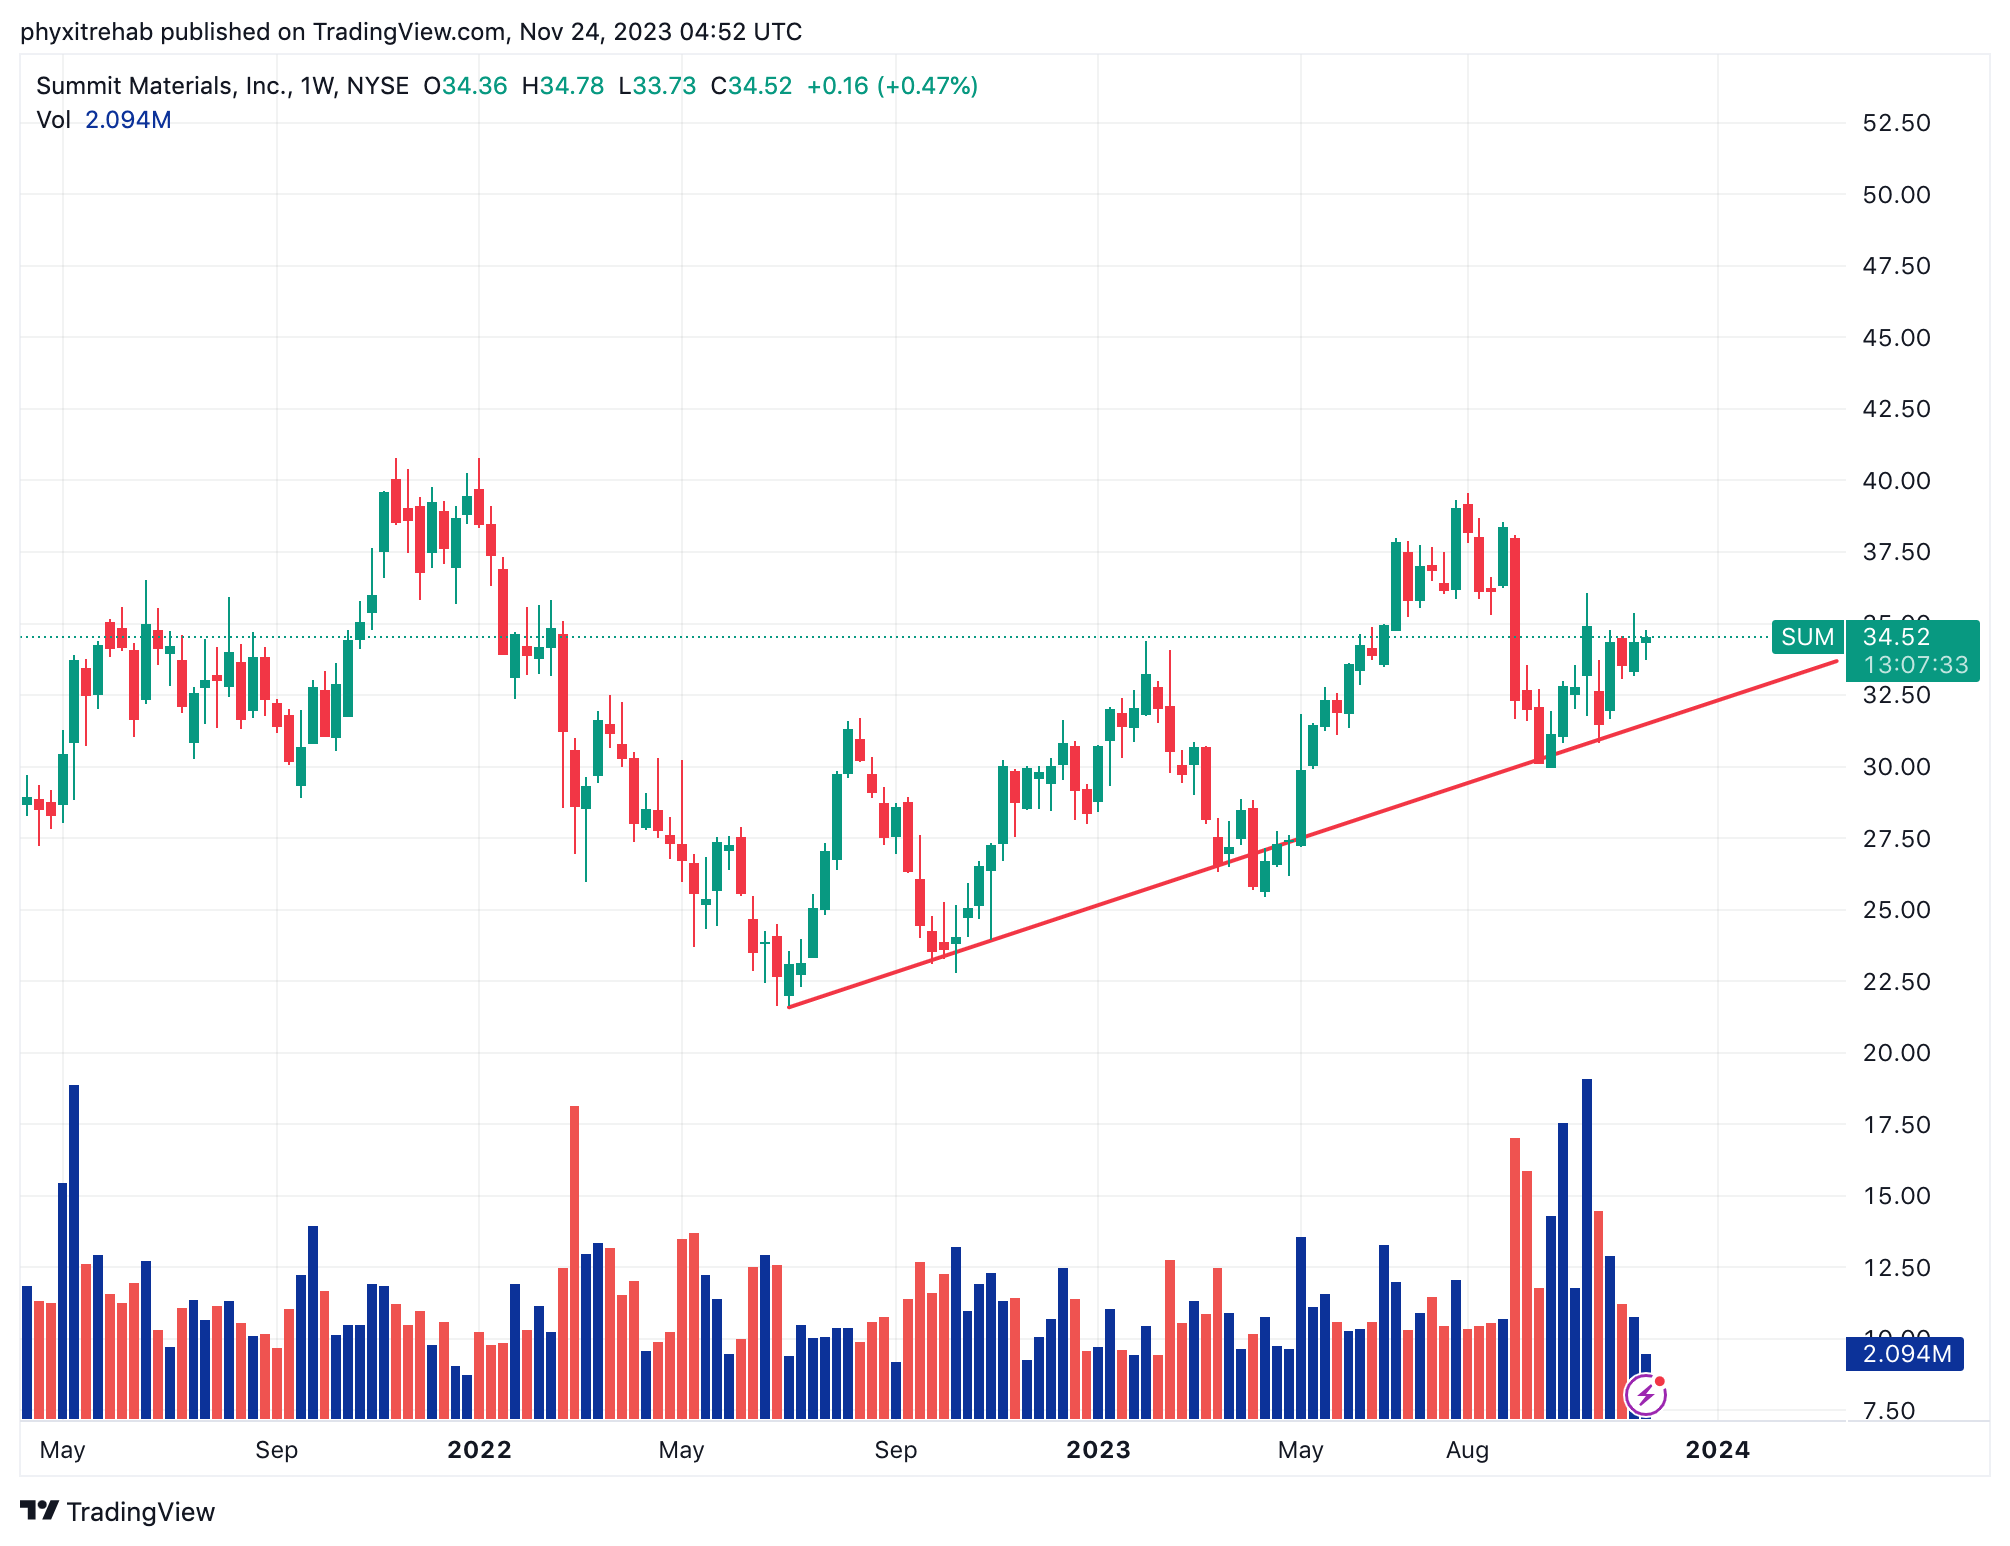
SUM's fundamentals are reasonably sound for the investor of low to moderate risk tolerance. The market has projected a period of better business for the company over the last 12 months, as seen in Figure 1. The stock couldn't retake its previous highs, but we are in fact testing another technical level in an uptrend started in May. Aside from that, the key investment facts are:
(1) Steeply priced at 22x earnings , 17x EBIT, but just 1.8x book value,
(2) Modest 3-year sales growth at 3.5% CAGR on 30.8% growth in earnings,
(3) Again modest business profitability : trailing ROE 14%, ROIC 7-10%,
(4) Dividends, of which there are none,
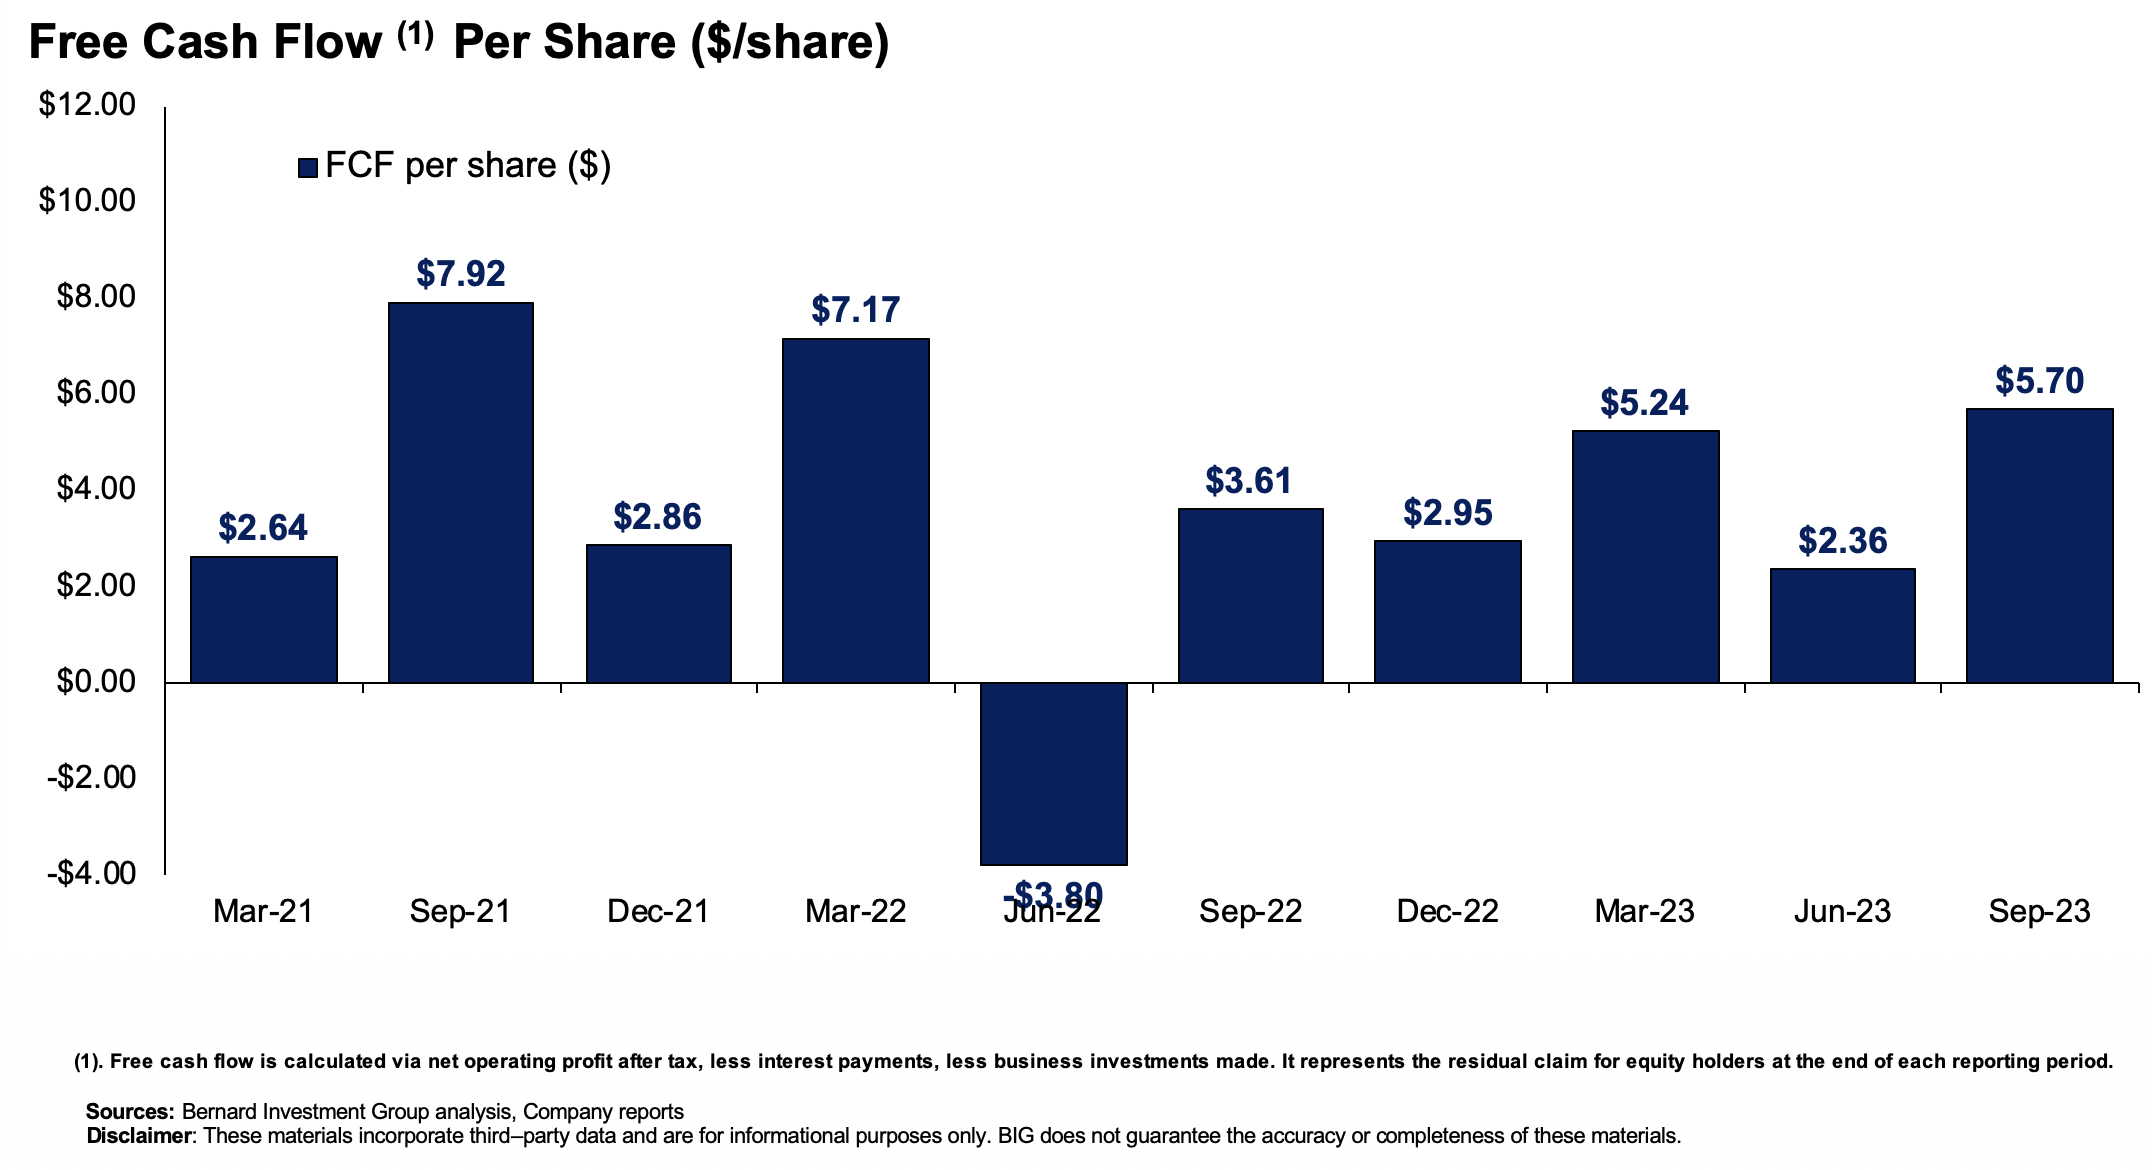
(5) Producing around $3-$5.00 in FCF per share on a rolling TTM basis,
(6) Cementos Argos ( CMTOY ) will acquire 31% of SUM by H1 next year.
Based on these facts, my judgement is that SUM comes with a number of core competencies that might see it compound wealth over the very long term (5 to 20 years). It depends on one's horizon. But for those looking in the next 12 months, starting valuations may be an issue. Beyond that (1-3 years), growth might be a standout factor for SUM, but I question if it is accretive to shareholder value. Net-net, rate hold.
Figure 1. SUM Long-term price evolution, continuation of uptrend since May '23
Cementos Deal Potentially Accretive
The company announced it will merge with Cementos Argos ("Argos USA") on September 7th. The deal, valued at $3.2Bn, places both companies in a period of sustained industry positioning.
The two strategic upsides for SUM in my opinion include the following, namely around market impact and capacity expansion:
-
The rationale is clear when looking at the facts. Argos is currently the 7th largest cement producer in the U.S. and contributes an annual output of 9.6mm metric tonnes. It did $1.7Bn in 2022 sales on $300mm EBITDA, 85/15% split to cement/ready-mix. Combined with SUM's 2.2mm metric tonnes, new capacity is 11.8mm metric tons, positioning it as the 4th largest player in the U.S. market.
-
Operationally, this merger aligns with strategic objectives. Argos brings substantial assets, including:
-
140 ready mix plants,
-
4 integrated cement plants,
-
8 ports,
-
10 inland terminals,
-
2 grinding plants,
-
It also holds 9.6mm metric tons of installed cement grinding capacity with material reserves for 67.5 years.
-
Net-net, the merger positions SUM for an enhanced market presence. The transaction involves a payment of $1.2Bn in cash and the issuance of over 54.7mm new shares, valued at ~$2Bn as of September 6th. Post-merger, Argos will hold a 31% stake in SUM, whilst existing shareholders will retain the remaining 69%.
The market has appraised the announcement well, forecasting a period of strong business for the company in its higher market values since May this year.
Critical Facts to Investment Debate:
(1) Multiples, return on equity
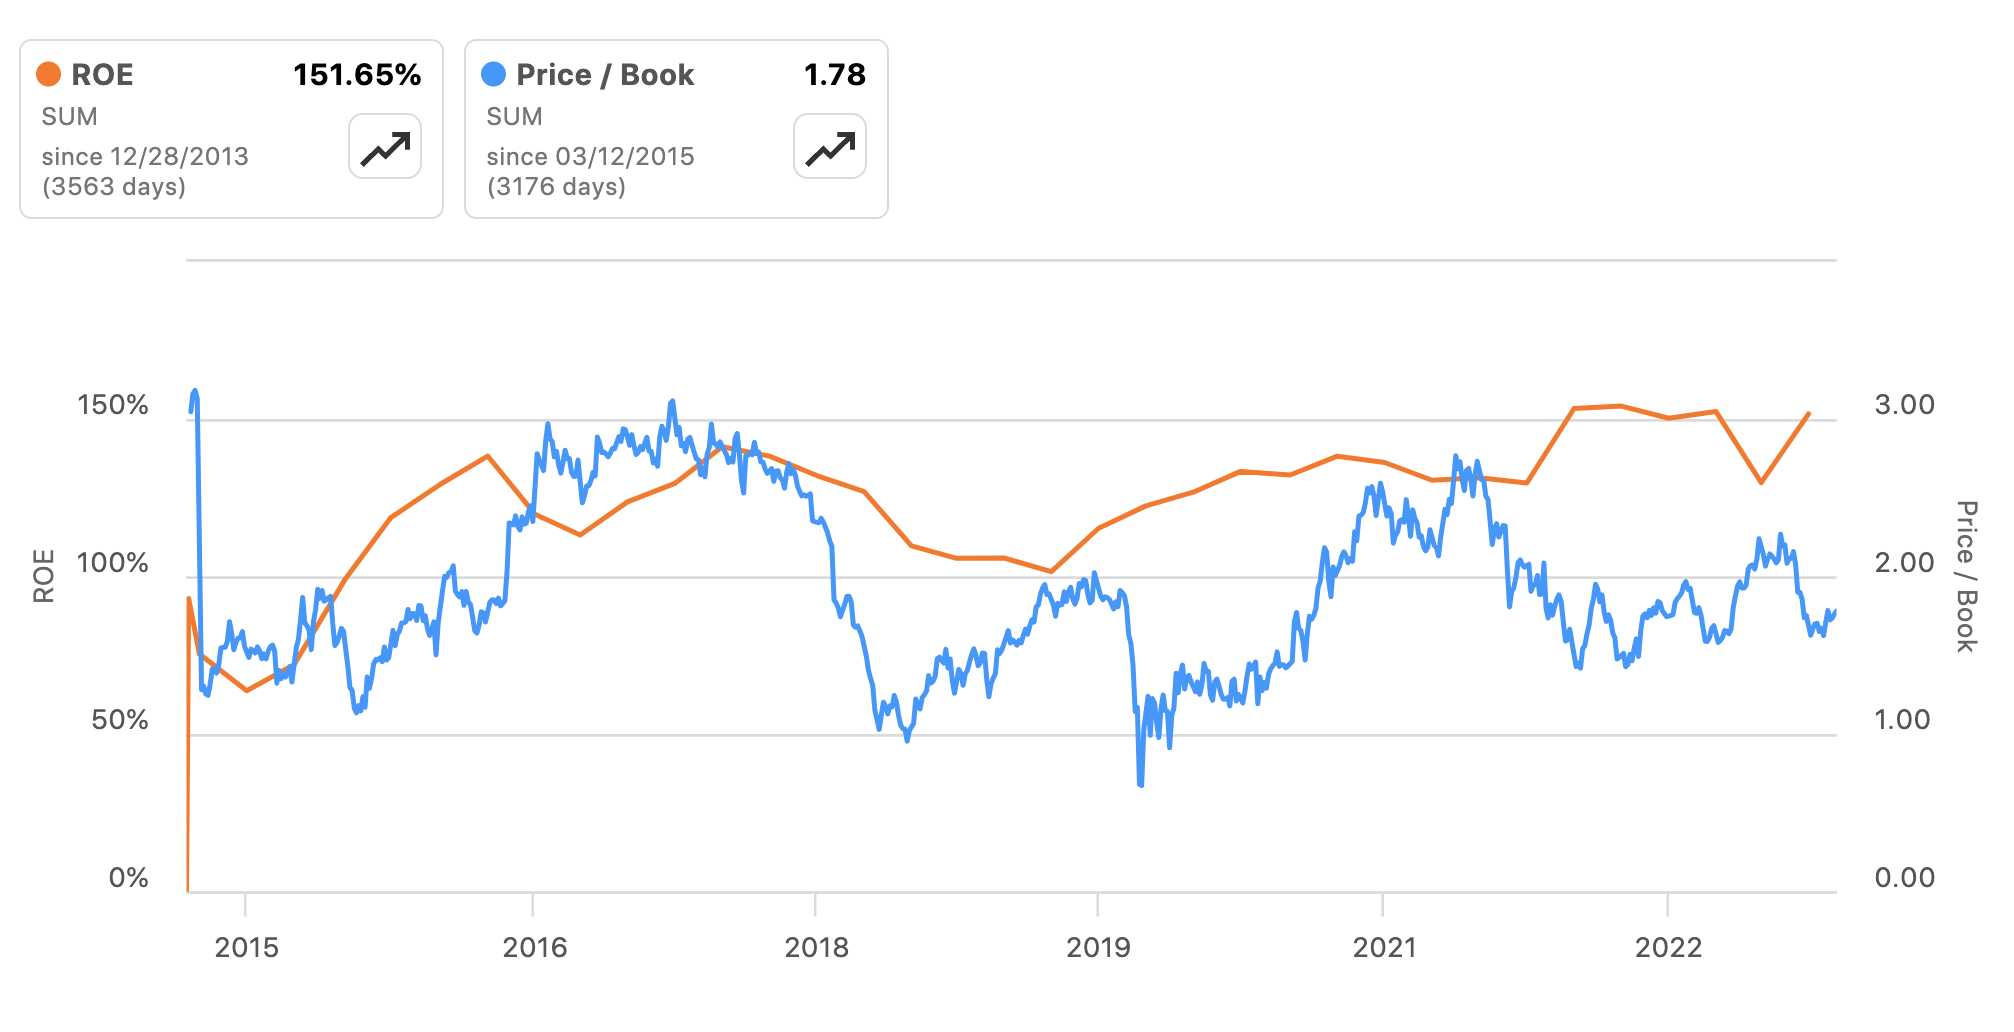
Forward 12-month returns are heavily influenced by starting valuations. On earnings power, the company is priced expensively at 22x forward earnings and 17x forward EBIT. On asset factors, it is cheaply priced at 1.8x book value and 1.4x EV/invested capital. What is true?
The company produced a 14% rate of earnings on equity last period. This is above the 12% long-term market return, and roughly in line with the S&P 500 index's last 12 month's average return. Two critical factors must be noted- how the 14% is produced, and the quality of this to investors. Starting with the quality:
(i) Company ROE came to 14% in the TTM (316/2,307 = 0.136)
(ii) The market return on its equity is 1.8x (4,150/2,307 = 1.79x), 1.4x EV/IC
(iii) Paying 1.8x in the market is a premium to the company's book value and reduces the investor's ROE to 7.6% (1.8 x 2,307 = 4,152 = 316/4,152 = 7.6%)
Secondly, the company's equity multiplier from leverage is 1.89x, on net margins of 12.6% and asset turnover of 0.58x, getting you to the 14% ROE. Removing the leverage effect gets you to 7.3% ROE produced net of leverage.
The company's profits do not transpose over to the investor, wiping 50% of the profitability off the table to a 7% rate of return if paying 1.8x book value or removing leverage in this instance. Therefore it's not a statistical discount in my opinion, as I'd be looking to get >12% even when paying 2x book value.
Paying 22x forward earnings is also a difficult task. The company's growth rates (discussed later) cannot be overlooked, but it is still difficult to grow into these multiples in my opinion. Returns for the next 12 months may be balanced, in my opinion.
Figure 2
(2) Economic + compounding value
The construction supplies business is a low-profitability segment where you expect to see high capital turnover and durable cash flows in the winning companies. Most often, products are undifferentiated, and service quality + other intangibles differentiate two companies in the same line of business. Production advantages + cost leadership are therefore critical as a competitive advantage.
SUM's economic characteristics are as follows:
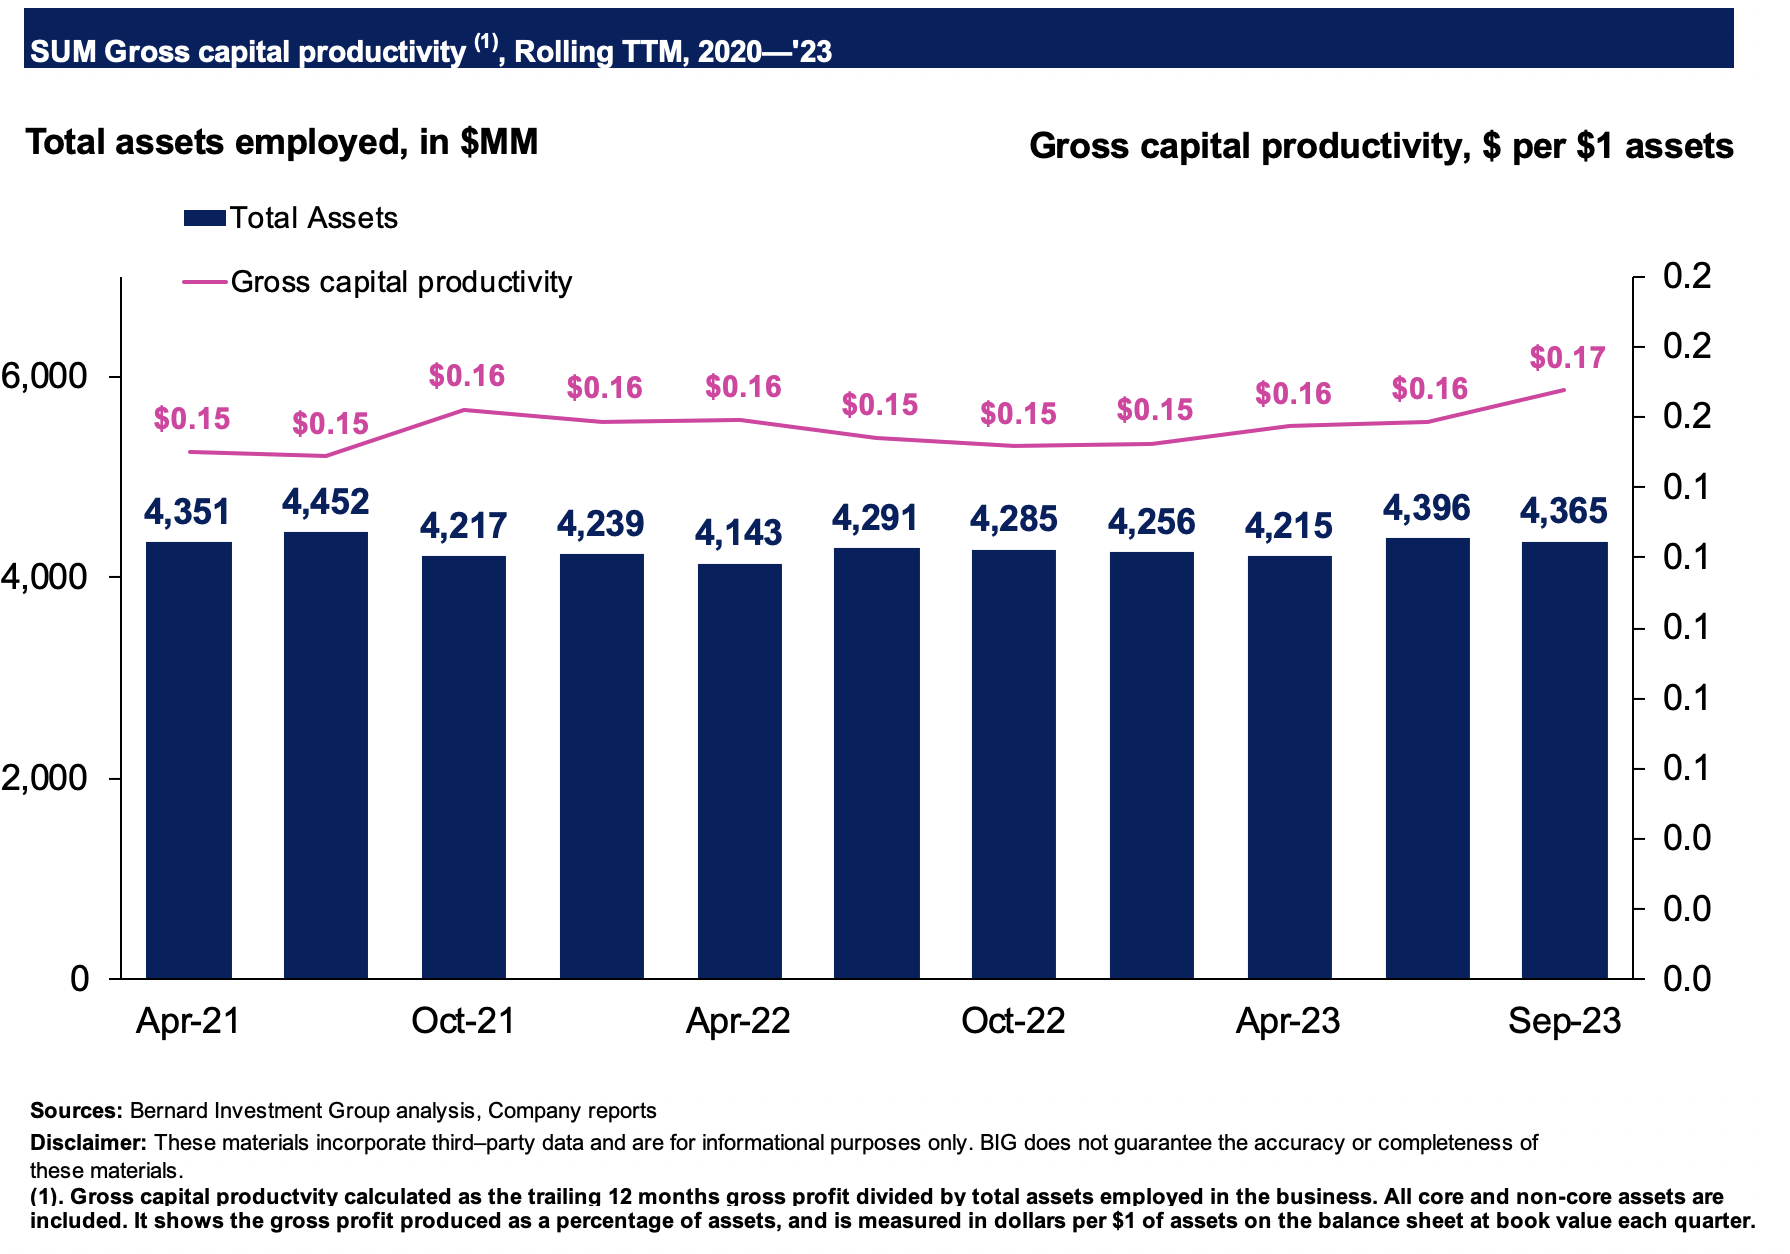
- On $4.3Bn of assets employed on the balance sheet, the company rotated back $0.17 per $1 in gross profit in the TTM (Figure 3),
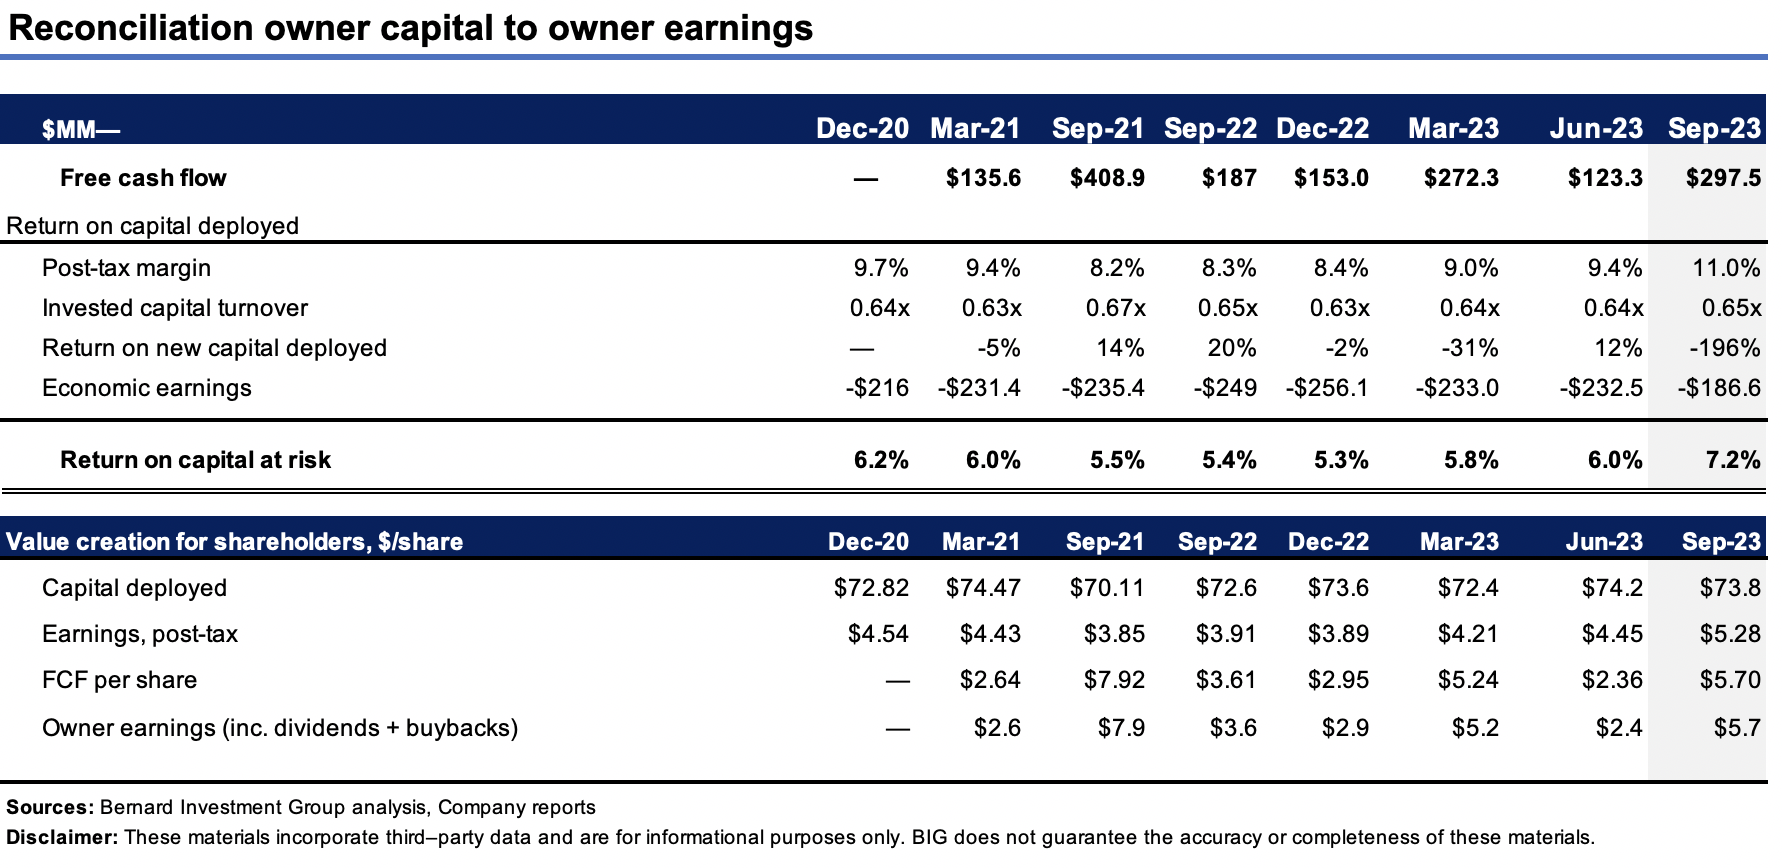
- The company had roughly $74/share of capital invested to run its business end of Q3. It produced $5.30 in trailing NOPAT on this, a 7.2% return on investment. The company uses a 5-year average invested capital in its calculations, to show a 10% return on investment.
- SUM is neither a high-margin or high-capital turnover business. Since 2020, post-tax earnings averaged 10-11% of revenues, whilst the ratio of sales to capital was 0.6x (Figure 4). Sales turnover is slow, on tight profit margins. Therefore, SUM enjoys neither consumer advantages or production advantages/cost leadership. For the investor, long-term wealth creation will be challenging without one or both of these factors.
Figure 3
- Earnings growth has been superb and averaged 30% annualized since 2019. Analysts project a period of superb business for SUM out to FY'25, eyeing 17-20% bottom line growth. This justifies recent market gains off May than September lows. For this, it looks to sales growth of 4-7% per year. This equates to normalized operating leverage of 2.8-4x. This could be favourable for or 1 to 3-year investment returns. A steepening earnings curve could provide additional growth opportunities with earnings reinvestment. Plus, new capital commitments have been flat to sport earnings growth to date. Since 2020, it has put up another c.$1.00 per share of new capital, to grow earnings per share by $1.27-a 127% incremental return on investment. My judgement is the market is recognizing this combination of earnings and asset factors.
Figure 4
BigInsights
- As projected, this is a reasonably high cash-flow business, with average FCF per share in the range of $3-$5 in the last 3 years, as high as $7/share (Figure 5). As a positive, the company has thrown off $36.60 in FCF to shareholders since 2020, on a rolling TTM basis. With the stock priced at $34 per share, this does start to justify itself.
Based on this critical data, in my opinion, the market is looking to the company's earnings growth and FCF per share to fuel it. At an avg. $3.00 in FCF per share to 2028 gets you to $60 per share in direct value, $100 at $5.00/share. Discounting both at our 12% hurdle rate arrives at $34.0 and $56.0/share respectively, so it could be the market is projecting $3/share in FCF going forward. Anything above this is, therefore, a specialty.
Figure 5
Q3 Earnings Insights
The company's Q3 numbers provided multiple facts to add into the investment debate. The breakdown is as follows:
(1) Financials
- Q3 earnings were up 15.7%, pushing the year-to-date growth to >31%. This was on net revenues growth of 8.2% to $741mm and cash growth profit of 15.5%. Growth was underscored by pricing across all segments. For instance, the word pricing was mentioned 64 times on the earnings call.
- Operating income was $128mm on better pricing, clipping 17% margin for the quarter, and record quarterly adj. EBITDA margin of 24%.
- Management has now pushed its FY'23 EBITDA guidance to $565mm, aiming for mid-teens EBITDA growth on margins of 23.5% and 24%.
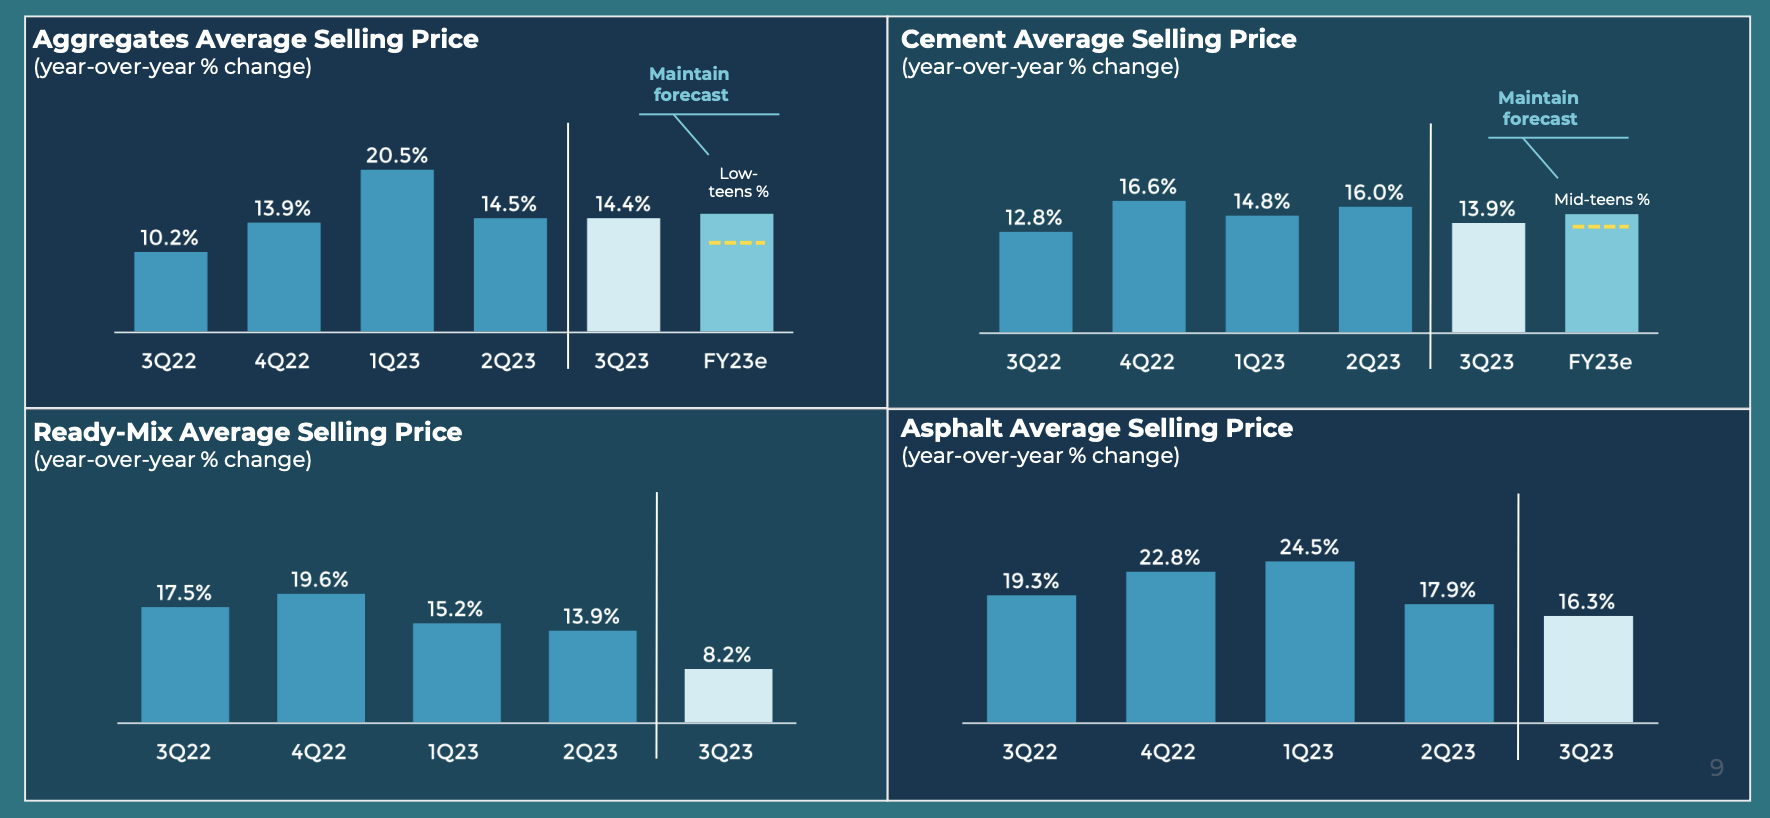
(2) Efforts on pricing recognized in P&L
- As to market value + inputs, cement prices got a $15/tonne boost on January 1st. Q3 average selling price ("ASP") went up to $155.79/tonne, an increase of nearly $6.70 per tonne from Q2.
- Management also noted that upstream businesses are optimistic about pricing trends. The expectations are of low-teens pricing growth in aggregates and mid-teens growth in cement for FY'23. The feedback mechanism is- (i) downstream is capturing the upside on cement input costs, (ii) leading to higher ready-mix pricing, and (iii) continuous pricing growth.
- Management also reported the success of its "dynamic pricing model". It notes customers are now used to receiving "at least two price hikes a year", which, in fact, is remarkable. This is important as companies in SUM's domain face high CapEx needs, making FCF per share growth lumpy. You see this for SUM in the step from 9.6x forward EBITDA to 17x forward EBIT. Depreciation is a real cost that can't be ignored.
Figure 6
The company also bakes in $250mm of CapEx in '23, around $65-$70mm of this due in Q4. Depreciation charge - which we've approximated at maintenance CapEx - is forecast for $220mm. So we could expect ~$30mm of growth investment from SUM this year.
Valuation and Conclusion
On margins and growth, the company's market value makes sense. In terms of asset factors and earnings power, SUM is fairly valued in my opinion. This has been largely discussed already, but is summarized below for effect:
- At a market value of $4.15Bn, the investor pays 1.8x the company's book value of equity to receive a ~7% rate of return.
- Similarly, at an EV of 5.5Bn, investors pay 1.4x this to buy SUM's invested capital. The business ROIC is 7.2% so the investor ROIC is 5.14% when paying this.
- The current market price is 22x higher than next year's earnings, also above the sector's 14x multiple, but below SUM's 5-year average of 26x.
- You are receiving a 14% cash flow yield and a 16% FCF yield at the time of writing.
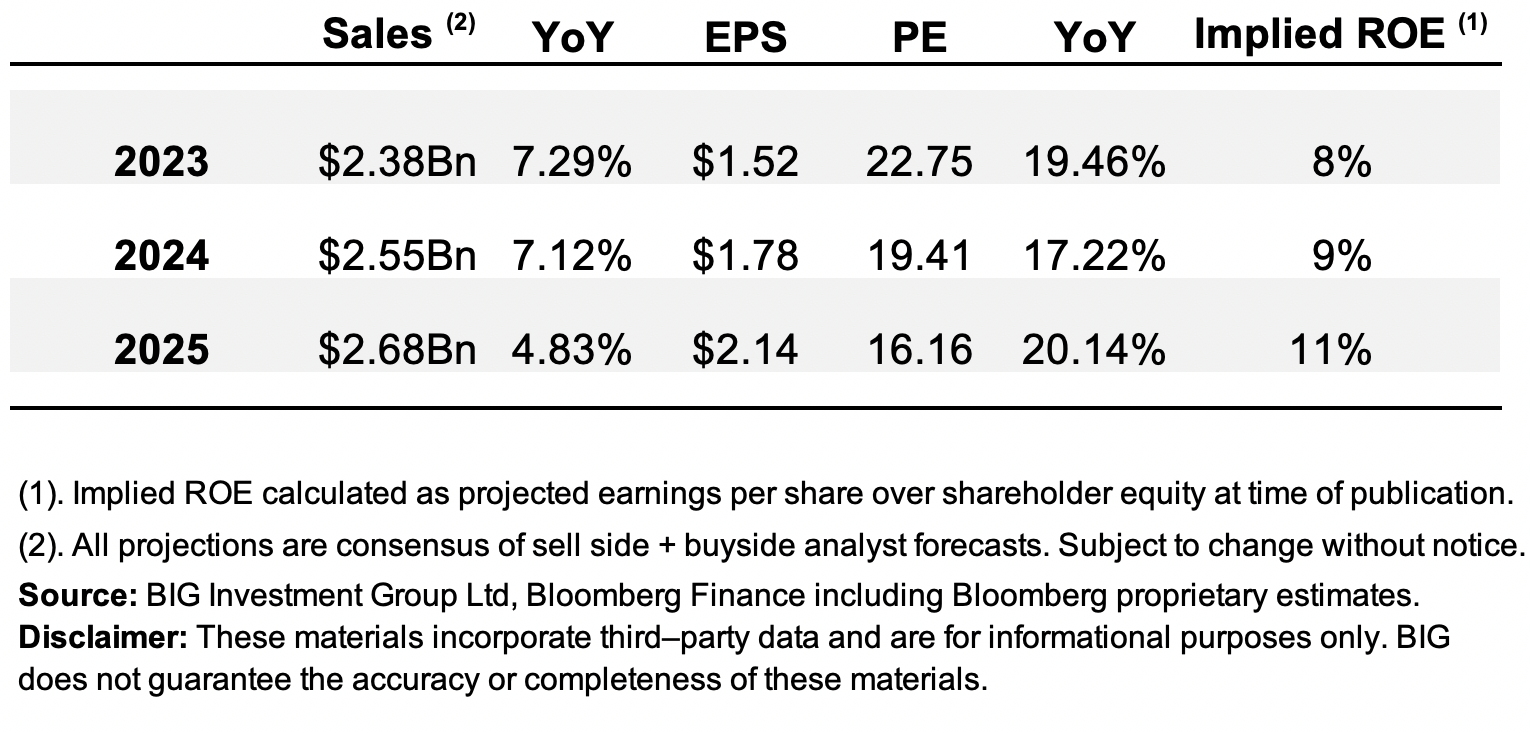
Projected growth is clearly a standout on a YoY basis. Compared to the equity investors own, however, not so appealing. As seen in Figure 7, relative to Q3 FY'23 net assets, the projected 17-20% earnings growth would lift ROE from 8% to 11%, both negligible change and small numbers.
In this vein, a multiple of 1.8x book value or 22x earnings does not interest me here in the slightest. Not even a pullback to 11.5x earnings, unless it was earnings driven - to $3 per share (34.53/3 = 11.5). This produces a forward ROE of 15.5%, with room for multiples expansion. If it is just a pullback on price - you still get the 8% implied ROE.
Figure 7
In short, SUM has exhibited a number of quality factors. Earnings growth and projections of this kind are noteworthy. To date, however, growth has demonstrated it will come at a much higher capital charge for SUM, a trend I see continuing further downstream. Earnings relative to net assets (equity) and capital required to run the business - already quite small - could be hampered by this.
Further, all growth is not created equally. My judgement is that the business's projected earnings growth might not coincide to investor wealth. Wall Street looks to 17-20% earnings growth in FY'23-'25. This would only lift return on equity from 8 to 11% using Q3 2023 net asset value, both small numbers anyhow.
So the argument on growth cannot be one-sided. What's good for the company mightn't come through for the investor. This appears to be the case for SUM when taking this view. That is, shying away from buying growth alone (i.e., earnings growth), getting more constructive on growth relative to assets + capital required to produce this expansion. In this vein, I rate SUM a hold.
For further details see:
Summit Materials: Growth Relative To Assets + Capital Not As Attractive