SGC - Superior Group Of Companies: Aiming For A Comeback
2023-09-18 10:44:47 ET
Summary
- Superior Group of Companies announced it would be paying dividends to shareholders, boosting investor confidence.
- SGC's lack of profitability in the past year raises concerns about the sustainability of high dividend yields.
- After effects of COVID still linger as this company aims to return to its normally impressive earnings growth.
- This article focuses on the fundamentals, the real value versus the current share price, and if SGC is currently worth investing in.
Superior Group of Companies, Inc. ( SGC ) manufactures and sells apparel and accessories both in the United States and internationally. Recently, they've generated buzz over an announcement that they would be paying dividends to their shareholders. On September 8th, 2023, SGC paid out $0.14 a share . While this is sure to make investors happy at the moment, SGC might not maintain such a high dividend yield in the future. The fact that SGC did not generate profit last year is room for concern.
Because SGC is not currently generating profit, they paid out dividends using their free cash flow. Interestingly enough, SGC's free cash flow is healthy and was more than enough to cover dividends. On the other hand, while there is speculation that SGC's EPS will rise within the next few years, a closer look reveals that SGC's EPS has been in a nosedive recently, falling 51% over the last year. Unfortunately, such a drastic fall does not inspire much confidence for the immediate future. Additionally, their most recent earnings missed projections by 5.9% , and their yearly projections decreased accordingly.
SGC's recent inability to hit earnings projections and generate profits may be linked to the general state of the global economy. In 2020, amidst the COVID-19 Pandemic, ecommerce sales skyrocketed by 46% . And while SGC benefited from this situation at the time, lingering effects are no longer positive. Economies around the world are still suffering and have not fully rebounded. As a result, many people simply don't have the disposable income they've had in recent years , thus contributing to the decreased earnings of SGC.
When considering these current stories about SGC, we need to determine which news topics will have a long-term and ongoing effect on the company and its share price. While reports of healthy free cash flow and dividend payouts may appeal to investors at the moment, SGC's continued missed earnings along with global economic headwinds cause more than enough reason to further examine this company before investing in it.
While current news stories, good or bad can sway our opinion about investing in a company, it's good to analyze the fundamentals of the company and to see where it's been in the past and in which direction it's heading.
This article will focus on the long-term fundamentals of the company, which tend to give us a better picture of the company as a viable investment. I also analyze the value of the company versus the price and help you to determine if SGC is currently trading at a bargain price. I provide various situations which help estimate the company's future returns. In closing, I will tell you my personal opinion about whether I'm interested in taking a position in this company and why.
Snapshot of the Company
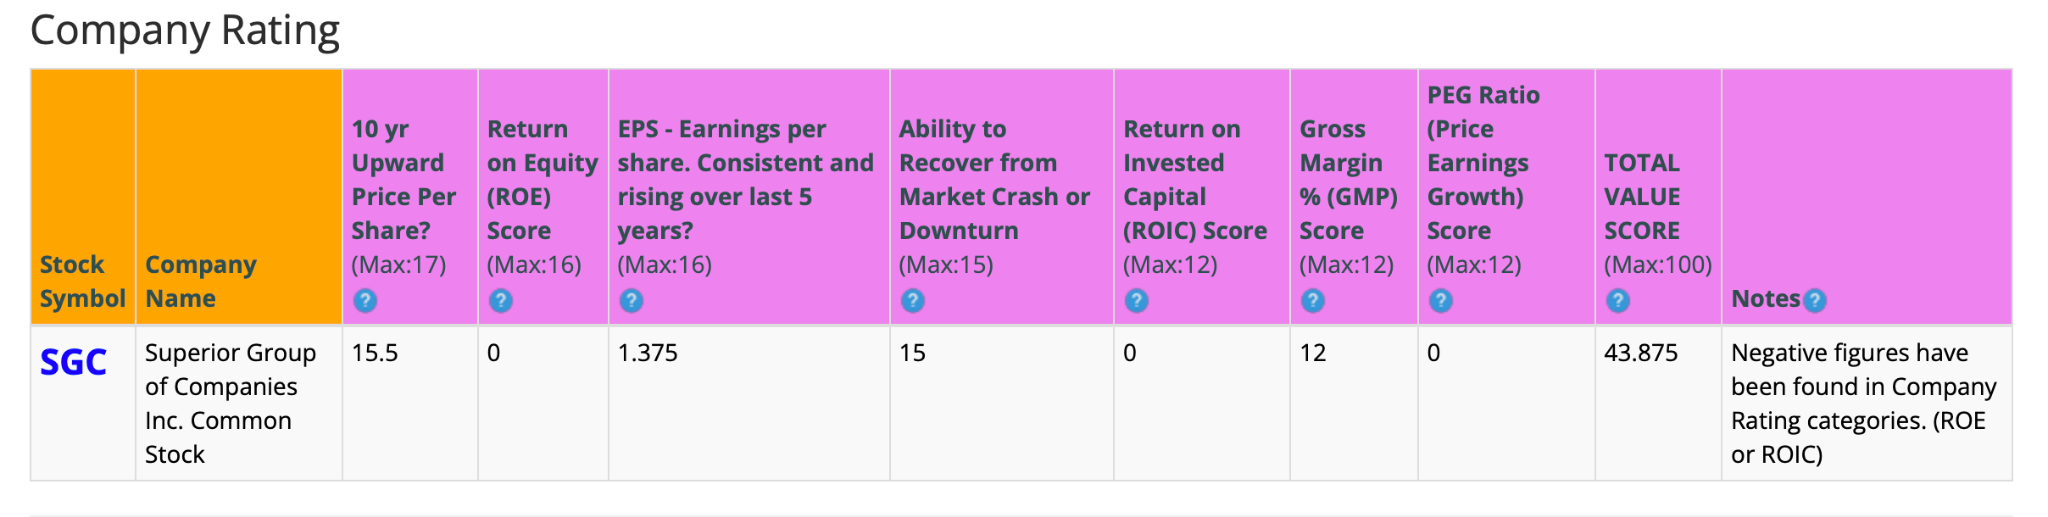
A fast way for me to get an overall understanding of the condition of the business is to use the BTMA Stock Analyzer's company rating score. SGC currently has a company rating score of 43.9 out of 100. While they appear to have a few strong factors working in their favor, the majority of their scores are significantly low, leaving their overall score unfavorable.
Before jumping to conclusions, we'll have to look closer into individual categories to see what's going on.
(Source: BTMA Stock Analyzer )
Fundamentals
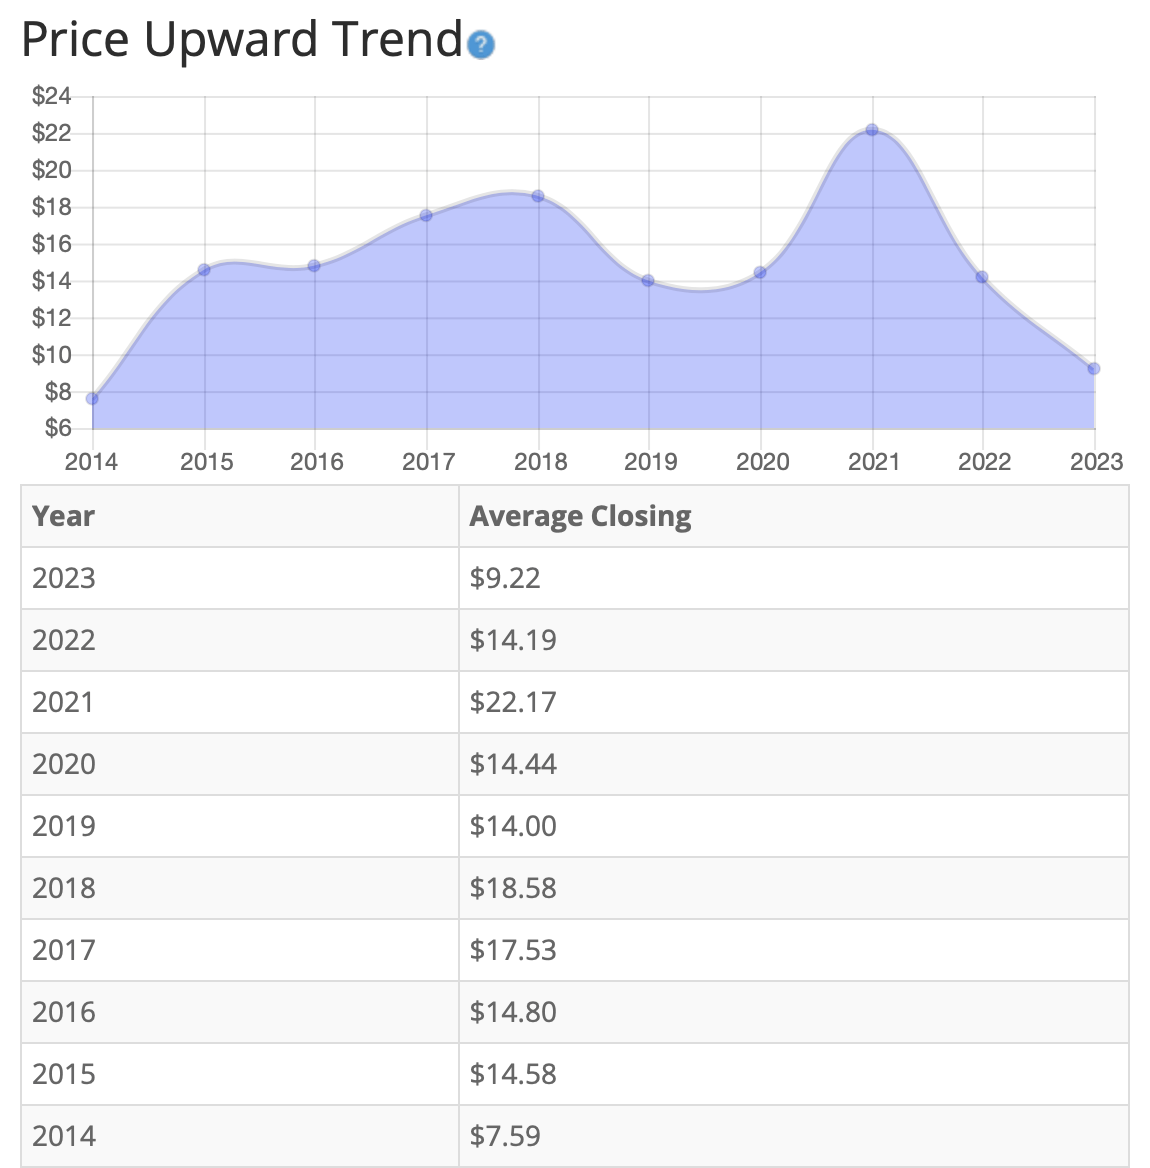
Let's examine the price per share history first. In the chart below, we can see that price per share has shown significant volatility over the last 10 years. While positive upward trends were encouraging, they were followed by sharp downward movement, negating these positive increases. Overall, share price average has grown by about 21.48% over the past 10 years, or a Compound Annual Growth Rate ((CAGR)) of 2.19%. This is obviously a poor return.
(Source: BTMA Stock Analyzer - Price Per Share History)
Earnings
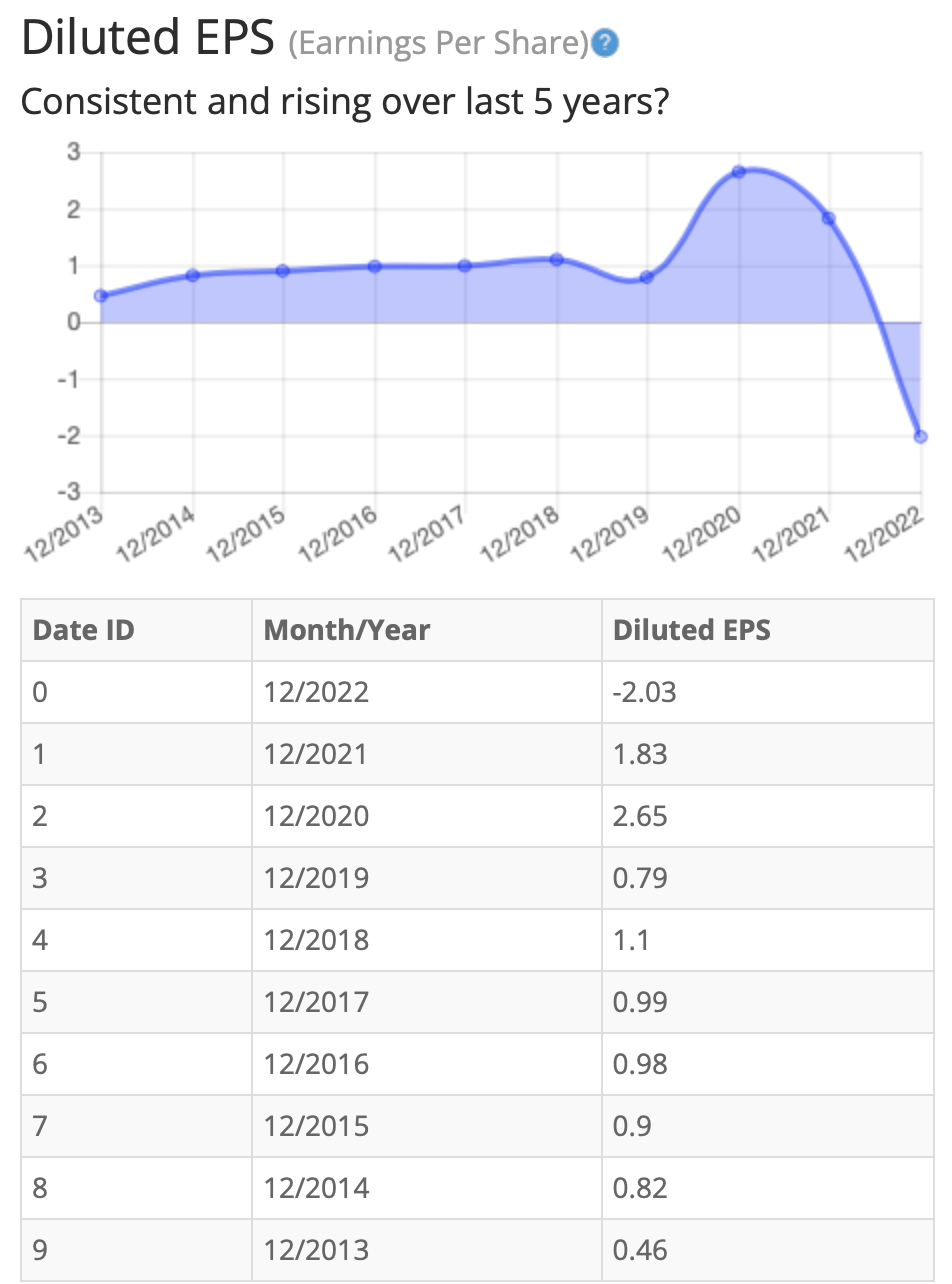
Looking closer at earnings history, we see earnings remained consistent for many years, until EPS began trending downward in 2021. In 2022, EPS continued this downward trend, plummeting even further.
When looking at this graph and the years in question, a major global issue comes to mind immediately: the COVID-19 pandemic. During the pandemic, SGC pivoted its business and became a strong producer of personal protective equipment (PPE), which was in high demand. As a result, sales skyrocketed. But loads of competitors continued to join the PPE market, and when the pandemic started to become better controlled, there was an oversupply of PPE and the market was full of competition. Sales of PPE and SGC's earnings have fallen accordingly.
Consistent earnings make it easier to accurately estimate the future growth and value of the company. So, in this regard, SGC does not provide a clear picture to help us accurately estimate the company's value. In my opinion, it would be better to exclude the influence of the COVID outlier years and to try and draw a valuation trajectory from the more consistent years prior to COVID.
On the bright side, SGC's earnings prior to COVID where impressive and consistently increasing.
(Source: BTMA Stock Analyzer - EPS History)
Since earnings and price per share don't always give the whole picture, it's good to look at other factors like the gross margins, return on equity, and return on invested capital .
Return on Equity
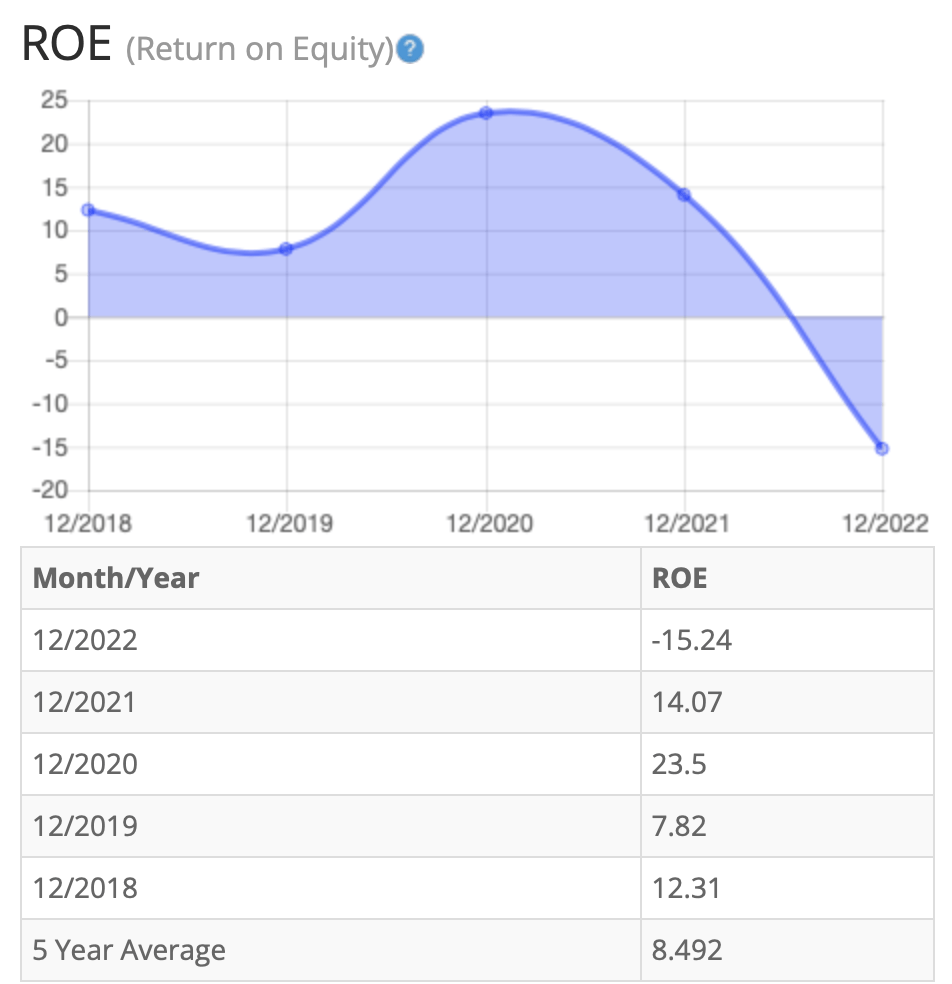
Return on equity has decreased considerably in the period from 2020 to 2022. Beginning a downward trend from 2020 to 2021, SGC's ROE has quickly entered a free fall. Their latest numbers from 2022 reflect a -15.24% ROE. It's worth noting, however, that because of a large spike going into 2020, SGC's 5-year average is still positive. For return on equity ((ROE)), I look for a 5-year average of 16% or more. Therefore, SGC's 8.49% falls well short of this requirement.
(Source: BTMA Stock Analyzer - ROE History)
Let's compare the ROE of this company to its i ndustry . The average ROE over 39 apparel companies is 13.52%
Therefore, both SGC's 5-year average of 8.49%, and current ROE of -15.24%, are well below average .
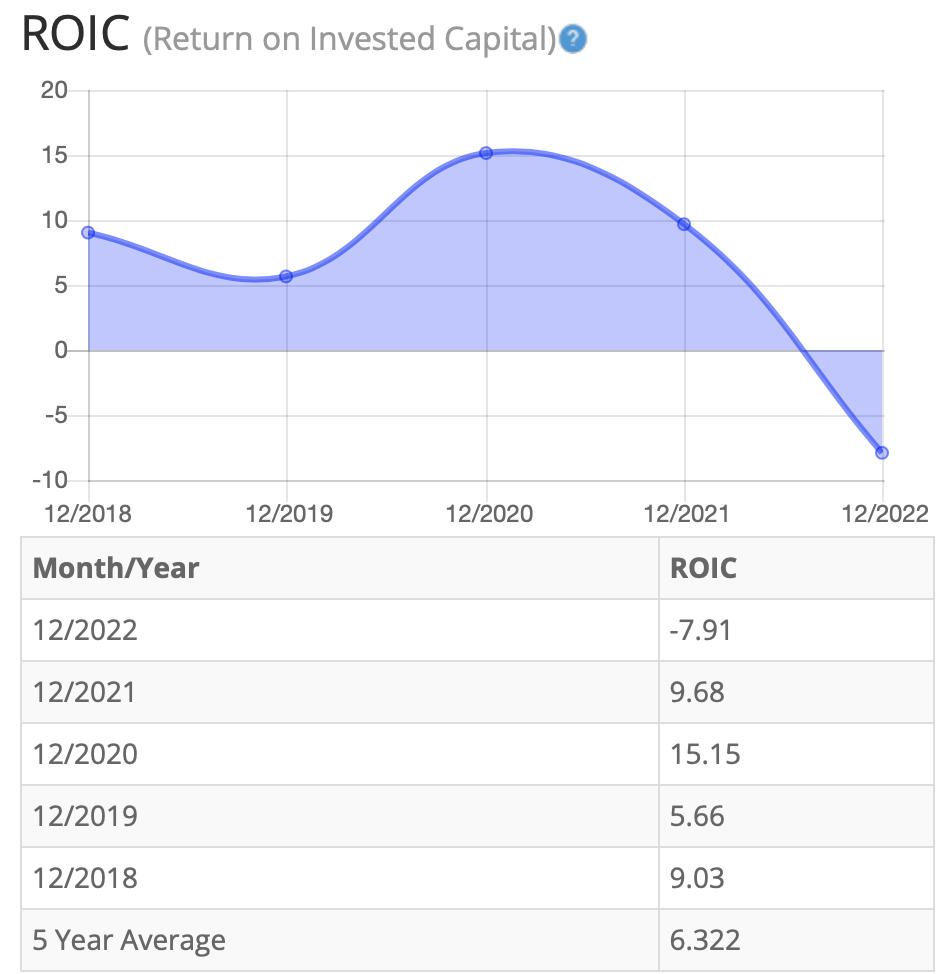
Return on Invested Capital
The return on invested capital has mirrored SGC's ROE trends. ROIC peaked in 2020, before sharply falling over the next two years. In SGC's most recent ROIC update, it even recorded a negative return of 7.91%. For return on invested capital ((ROIC)), I also look for a 5-year average of 16% or more. SGC's 6.32% average is well below this target.
(Source: BTMA Stock Analyzer - Return on Invested Capital History)
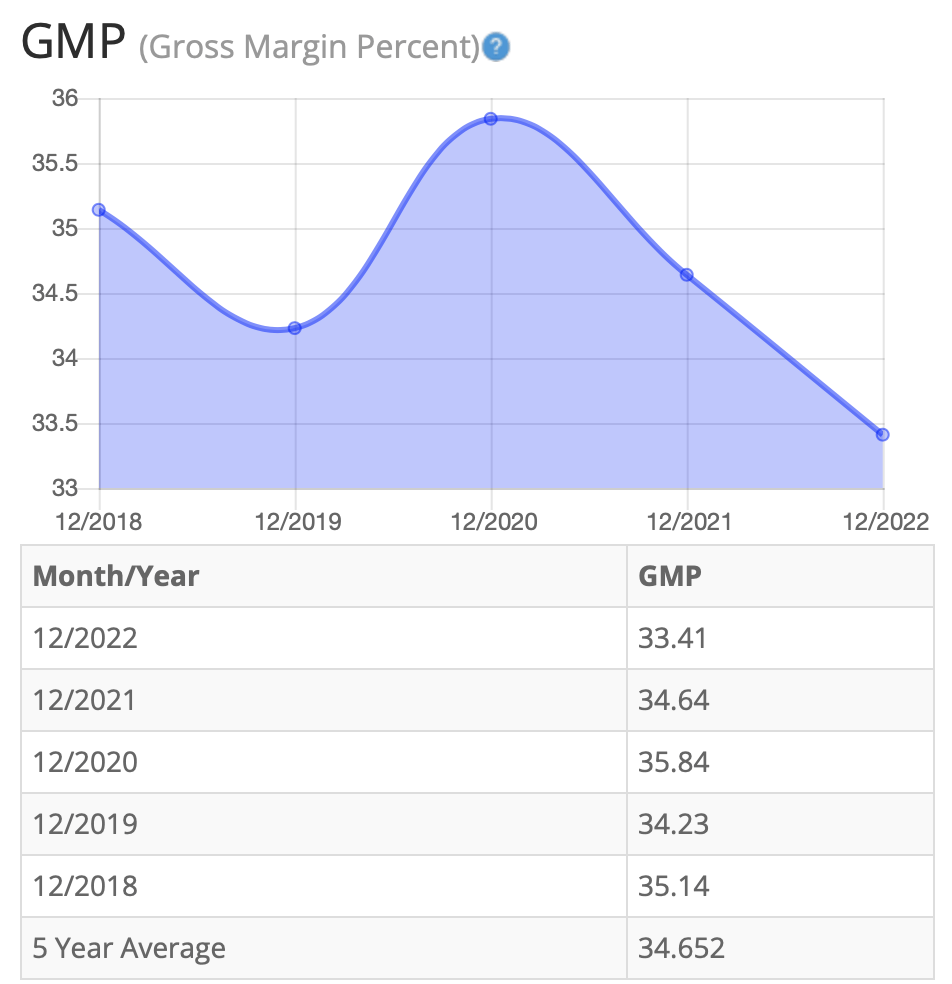
Gross Margin Percent
The gross margin percent ((GMP)) has mostly decreased over the last five years. The sole exception to this came in 2020 where GMP increased from 2019 levels. Unfortunately, this spike was short-lived, and it continued to decrease over the next two years. Even with the decline, however, the overall gross margin percent is still at acceptable levels and it has been mostly stable within a range of 33% to 36%. Five-year GMP average is holding at around 34.65%. I typically look for companies with gross margin percent consistently above 30%. So, SGC has indeed proven its ability to maintain acceptable margins over a long period.
(Source: BTMA Stock Analyzer - Gross Margin Percent History)
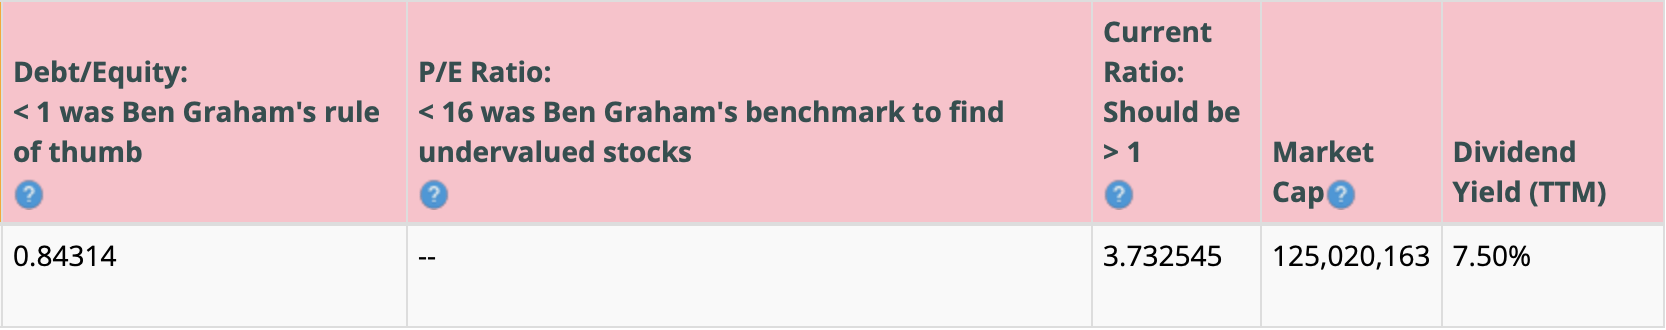
Financial Stability
Looking at other fundamentals involving the balance sheet , we can see that the debt-to-equity is less than 1. This is a positive indicator, telling us that the company owns more than it owes.
SGC's Current Ratio of 3.73 is more than satisfactory, indicating it has an adequate ability to use its assets to pay its short-term debt.
Ideally, we'd want to see a Current Ratio of more than 1, so SGC easily exceeds this amount.
According to the balance sheet, the company appears to be in strong financial health. In the long term, the company has more than enough assets to cover its debts. In the short-term the company is generating enough cash flow to fulfill its obligations.
SGC currently pays a dividend yield of 7.50%.
(Source: BTMA Stock Analyzer - Misc. Fundamentals)
This analysis wouldn't be complete without considering the value of the company vs. share price.
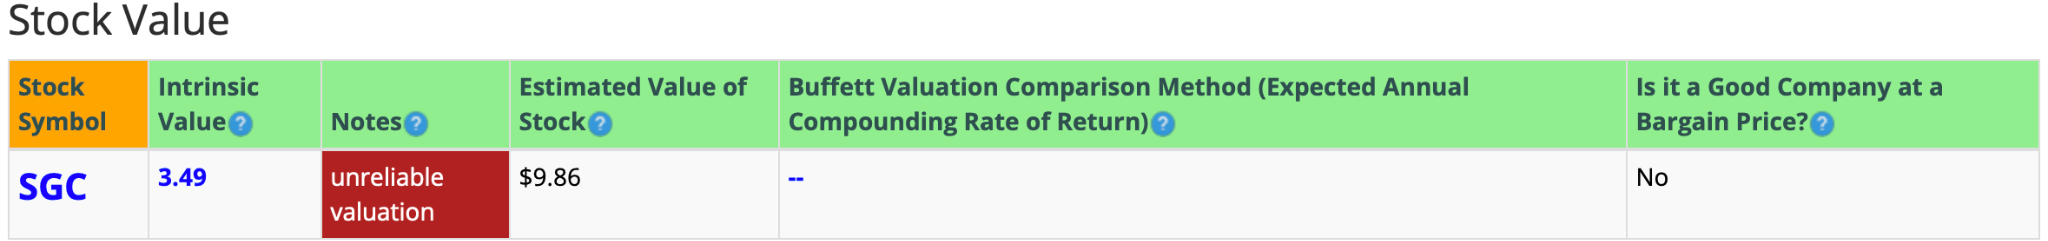
Value Vs. Price
SGC does not currently have a Price-Earnings Ratio, because they have recently had negative earnings.
But even if we conservatively estimate that SGC's earnings return to levels back in 2017 of around $1, then a conservative earnings multiplier of 10 would still put the stock value at around $10, and an average earnings multiplier of 15 would put the stock value at around $15.
The 10-year average PE Ratio of SGC is around 16.3.
(Source: BTMA Stock Analyzer - Stock Value)
The Estimated Value of the Stock is $9.86, versus the current stock price of $7.58. This indicates that SGC is currently selling at a bargain price.
For more detailed valuation purposes, I will be using a pre-COVID EPS from 2018, of 1.10. I've used various past averages of growth rates and PE Ratios to calculate different scenarios of valuation ranges from low to average values. The valuations compare growth rates of EPS, Book Value, and Total Equity.
In the table below, you can see the different scenarios, and in the chart, you will see vertical valuation lines that correspond to the table valuation ranges. The dots on the lines represent the current stock price. If the dot is towards the bottom of the valuation range, this would indicate that the stock is undervalued. If the dot is near the top of the valuation line, this would show an overvalued stock.
BTMA Wealth Builders Club BTMA Wealth Builders Club
According to this valuation, based on Pre-Covid Normalized Levels, the stock is undervalued. I base this valuation on the pre-Covid levels because the pandemic skewed earnings.
This analysis shows an average valuation of around $13.89 per share versus its current price of about $8, this would indicate that SGC is slightly undervalued , especially when the company normalizes its earnings as the pandemic effects dissipate.
Summarizing the Fundamentals
According to the facts, SGC is financially healthy in a long-term sense in having enough equity as compared with debt, and in the short-term because the current ratio indicates that it has plenty of cash to cover current liabilities.
It's clear that SGC has displayed impressive and consistently increasing earnings prior to the pandemic. The other fundamentals like ROE and ROIC seem to be worse as a result of the pandemic effects as well.
In terms of my pre-COVID valuation, my analysis shows that the stock is undervalued.
SGC Vs. The S&P 500
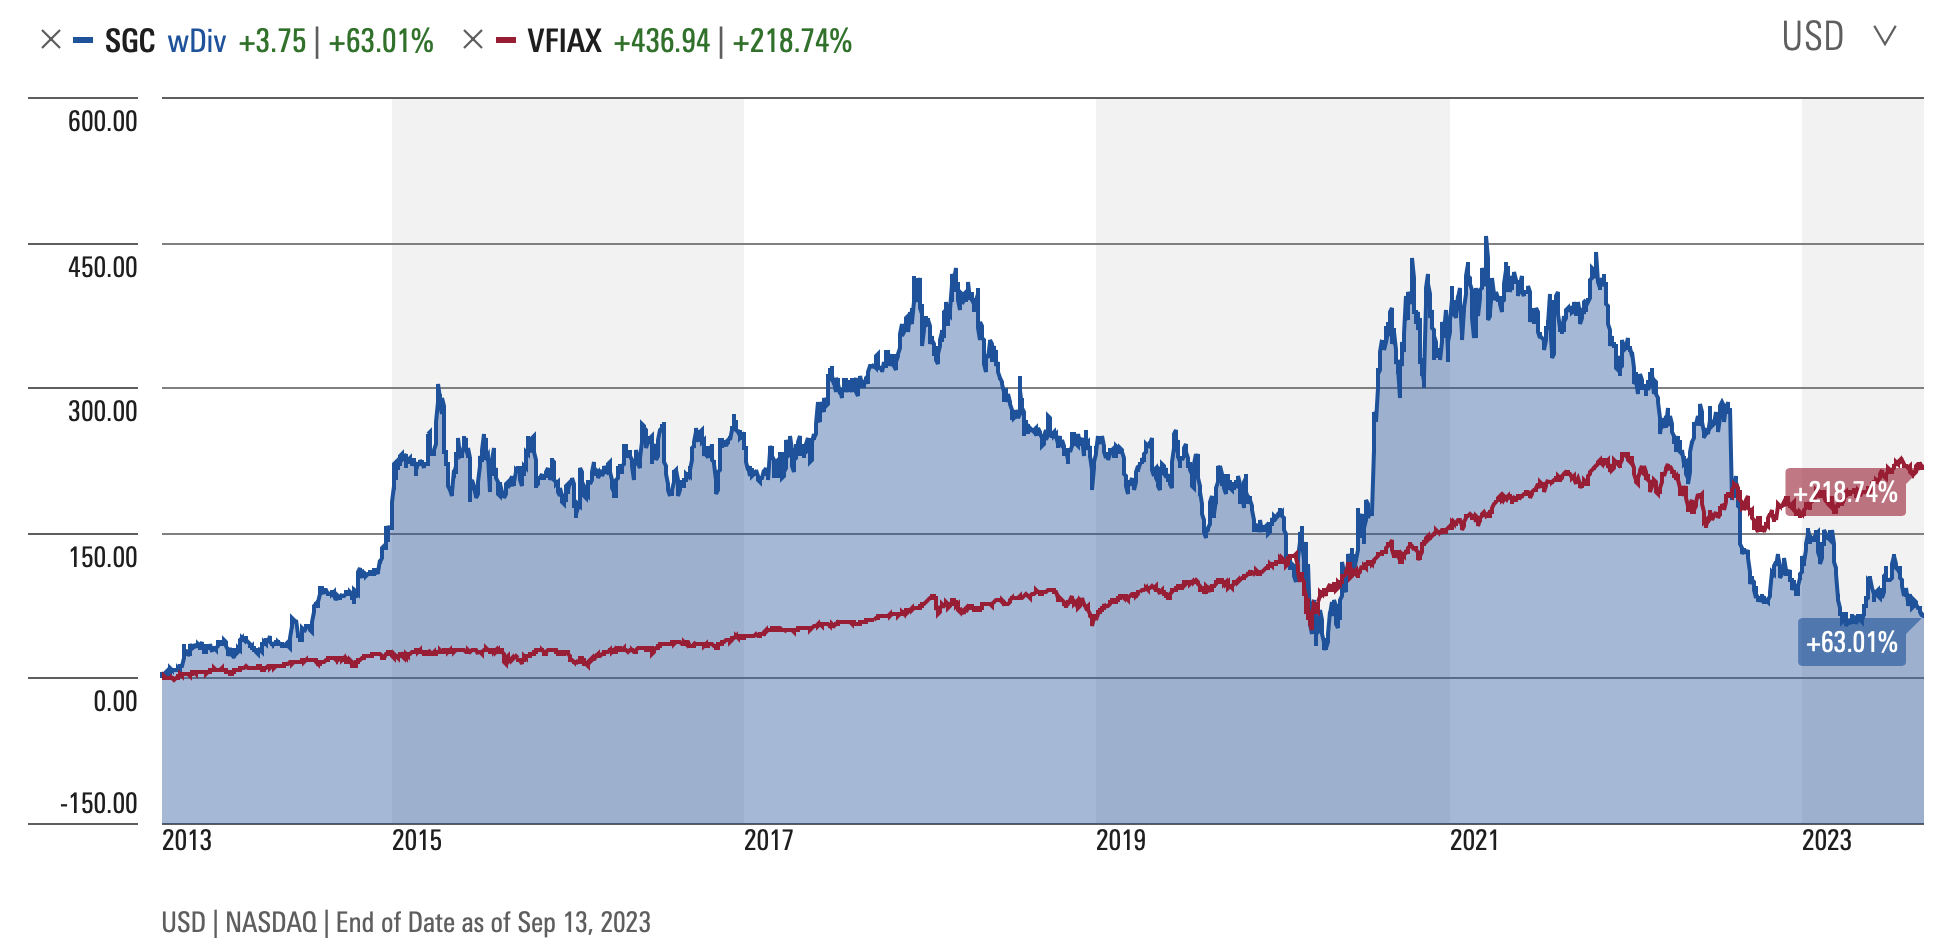
Now, let's see how SGC compares versus the US stock market benchmark S&P 500 over the past 10 years. From the chart below, we can see that for many years, SGC outperformed the general market. In fact, for almost the entirety of the last 9 years, SGC has dominated the general market. Because of a recent nosedive from SGC, however, the general market finally outperformed SGC is 2023. It's clear that SGC has demonstrated that it can be a high growth company that can outperform the market benchmark in typical years.
Forward-Looking Conclusion
Over the next five years, the analysts that follow this company are expecting it to grow earnings at an average annual rate of 10.00% .
In addition, the average one-year price target for this stock is at $15.67 which is about a 106.73% increase in a year.
Does SGC Pass My Checklist?
- Company Rating 70+ out of 100? NO (43.9)
- Share Price Compound Annual Growth Rate > 12%? NO (2.19%)
- Earnings history mostly increasing? NO
- ROE (5-year average 16% or greater)? NO (8.49%)
- ROIC (5-year average 16% or greater)? NO (6.32%)
- Gross Margin % (5-year average > 30%)? YES (34.65%)
- Debt-to-Equity (less than 1)? YES (0.84)
- Current Ratio (greater than 1)? YES (3.73)
- Outperformed S&P 500 during most of the past 10 years? YES
- Do I think this company will continue to successfully sell their same main product/service for the next 10 years? YES
SGC scored 5/10 or 50%. Therefore, on the surface SGC seems like it shouldn't be considered as a potential investment for most investors.
Is SGC currently selling at a bargain price?
Estimated Value greater than Current Stock Price? YES (Value $13.89 > $8 Stock Price)
In conclusion, I see SGC as an opportunity to buy a solid business that has strong financial health. The earnings in normal years, prior to COVID, were consistently increasing. The after-effects of COVID have made the fundamentals worse than they would normally be. Once the company returns to its norm, the earnings will follow and the stock price will increase accordingly.
The company is still diversified with 3 main businesses: healthcare apparel, branded products, and contact centers.
The cash flows have been able to maintain the dividend payments and the company has a regular history of dividend payments, even dating back to the 2008 crisis.
This company has been beaten down in terms of share price and it goes under the radar because of its smaller size and lack of analyst coverage. I'd be confident to add to my current position of SGC and to collect the dividends while I wait for it to climb back up in price.
For further details see:
Superior Group Of Companies: Aiming For A Comeback