VUSE - SYLD: #1 For Now But This Shareholder Yield Fund Looks Vulnerable
2023-09-13 17:26:21 ET
Summary
- In June 2020, SYLD switched to an actively-managed fund, and has since become the top-performing ETF with a total market focus, delivering a 117% total return vs. 54% for SPY.
- SYLD's shareholder yield-focused portfolio currently results in high concentrations of commodity-linked stocks in the Energy and Materials sectors. It's a bet that inflation will run higher for longer.
- However, I'm not willing to take that bet today. SYLD performance ranks just #76/108 YTD, and it's currently a highly-volatile ETF with a 1.39 five-year beta.
- The fund's quality is relatively weak, too. Based on Seeking Alpha Factor Grades, I've calculated a 7.92/10 Profit Score, far less than what more consistent performers like AVUS, VFVA, JQUA, DGRW, and VUSE feature.
- An industry-level fundamental analysis of SYLD is included below, along with a list of the top 30 performing Total Market ETFs in the last three years.
Investment Thesis
In June 2020, the Cambria Shareholder Yield ETF ( SYLD ) switched from a passive to an active-management style, resulting in 60-64% total outperformance over plain-vanilla funds targeting all size segments. It's undoubtedly impressive, but one of my goals with this article is to explain how most outperformance occurred early on, with SYLD ranking just #76/108 among U.S. ETFs with a Total Market Focus so far in 2023. While investors should never look at one year in isolation, remember that the track record is short. Furthermore, SYLD's current portfolio is risky, and its quality needs improvement. Therefore, out of caution, I recommend readers avoid SYLD today, but I will suggest three alternatives in my conclusion worth looking into.
SYLD Overview
Strategy Discussion
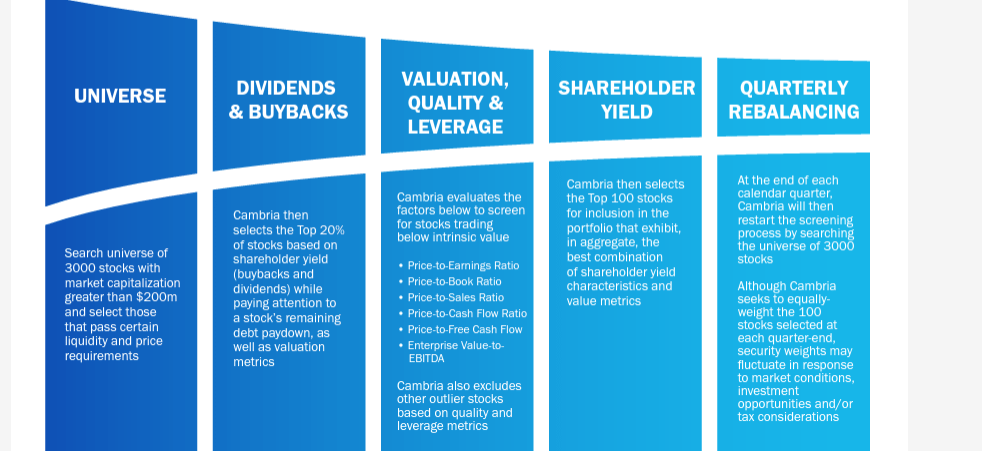
According to its Investment Case , SYLD's selection process begins with approximately 3,000 U.S. stocks with market capitalizations greater than $200 million. The next step is to calculate each stock's shareholder yield. Cambria defines shareholder yield as the sum of a company's cash dividends, net share repurchases, and net debt reduction, divided by market capitalization. Only the top 20% qualify for the next step, described in the graphic below.
Valuation screens are applied, with the goal being to find stocks trading below their intrinsic values. Outliers are excluded based on quality and leverage metrics, with 100 stocks ultimately chosen in equal weight. From its summary prospectus :
Cambria's quantitative algorithm... applies a number of value metrics to create a composite, including metrics such as, but not limited to, price-to-book (P/B) ratio, price-to-sales (P/S) ratio, price-to-earnings (P/E) ratio, price-to-free cash-flow (P/FCF or P/CF) ratio, and enterprise multiple (EV/EBITDA).
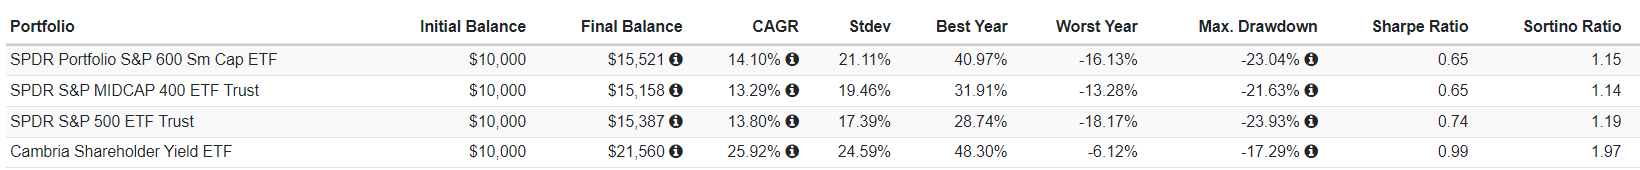
How its algorithm weights these metrics isn't known, but we effectively have a portfolio that represents 3.33% of its selection universe with cheap valuation ratios. The quality and leverage metrics are less critical, but regardless, SYLD's high concentration provides investors with the possibility of substantial outperformance. And, alluded to earlier, it's done just that since it became an actively managed fund in June 2020. Consider SYLD's total returns since that date compared to the SPDR S&P 600 Small Cap ETF ( SPSM ), the SPDR S&P MidCap 400 ( MDY ), and the SPDR S&P 500 ETF ( SPY ) since then.
From June 1, 2020, to September 8, 2023, SYLD gained 115.60% vs. 55.21%, 51.58%, and 53.87% for SPSM, MDY, and SPY. Volatility, as measured by standard deviation, was noticeably higher. However, drawdowns were better, as were risk-adjusted returns (Sharpe and Sortino Ratios). Although the measurement period is short, this warrants further analysis, so let's do that next by evaluating SYLD against several other all-cap ETFs.
Performance Analysis
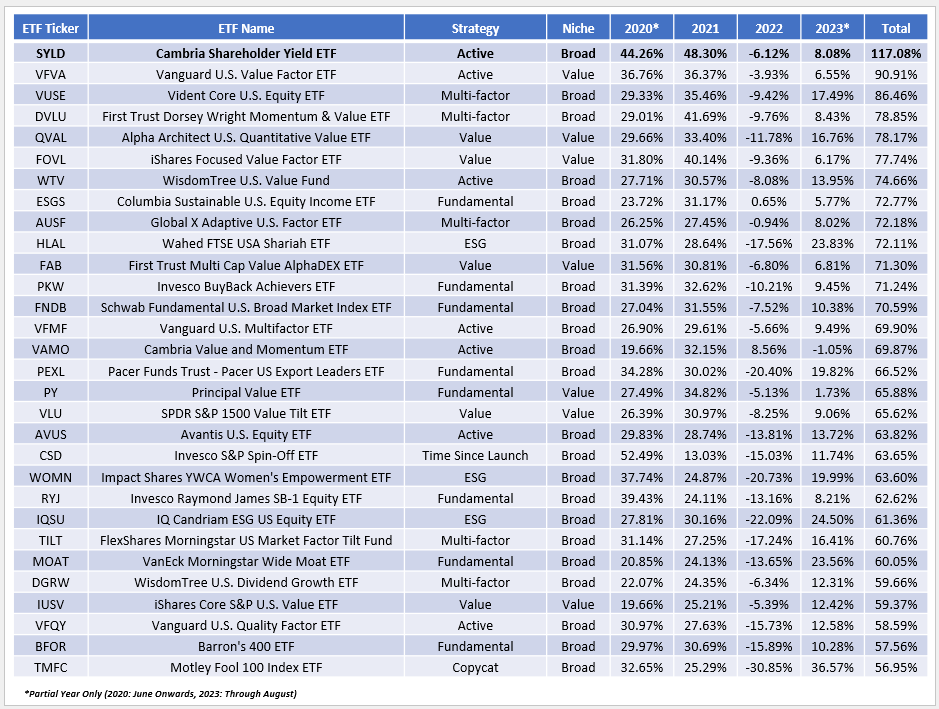
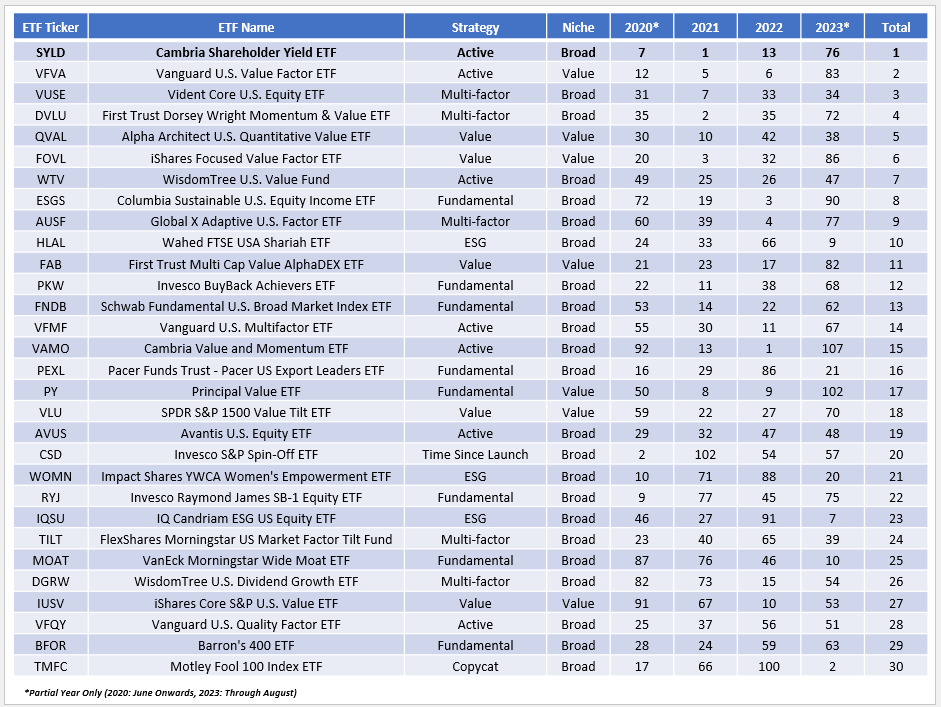
In my investment thesis, I mentioned how SYLD is ranked #76/108 in 2023 among U.S. ETFs with a Total Market Focus. However, its cumulative returns since June 2020 are the best. I've listed the top 30 in the first table below, followed by another table that ranks each year from 1-108. Notice how other actively managed funds are also at the top of the list, including the Cambria Value and Momentum ETF ( VAMO ). Although the measurement period is relatively short, this demonstrates that, despite the stigma, active managers can generate alpha above their usually higher fees.
The Sunday Investor The Sunday Investor
The Vanguard U.S. Value Factor ETF ( VFVA ) has also struggled this year after being a top performer from June 2020 to December 2022. In contrast, the Vident Core U.S. Equity ETF ( VUSE ) and the Avantis U.S. Equity ETF ( AVUS ) are more consistent performers. If you're not yet convinced SYLD's strategy works based on its relatively short track record, then these funds are worth examining further.
SYLD Analysis
Sector Exposures and Top Ten Holdings
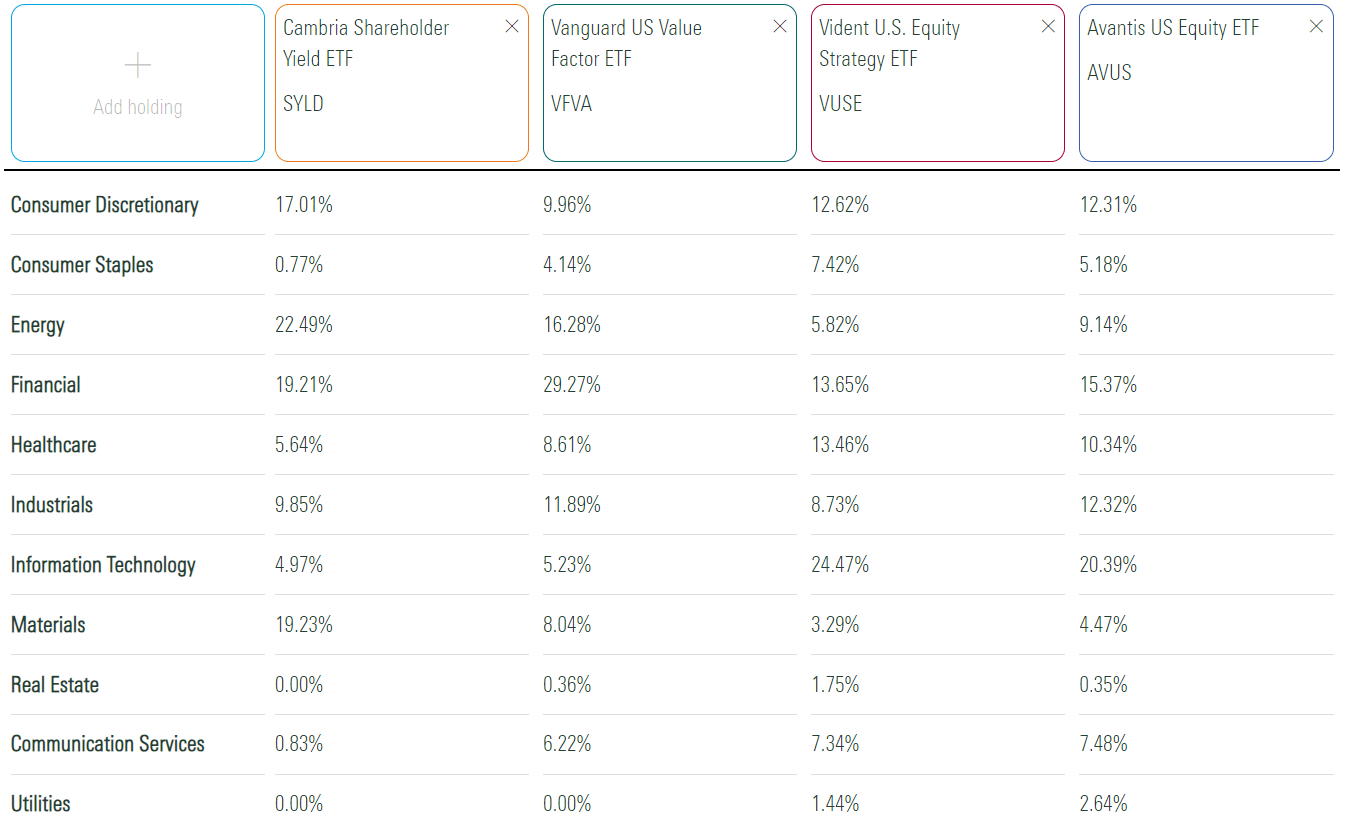
The following table highlights SYLD's sector exposures alongside VFVA, VUSE, and AVUS. Note how SYLD overweights Energy (22.49%) and Materials (19.23%), two sectors with considerable exposure to commodity prices. As a result, we can expect SYLD to be highly volatile, and based on the high standard deviation figure noted earlier, this isn't unusual.
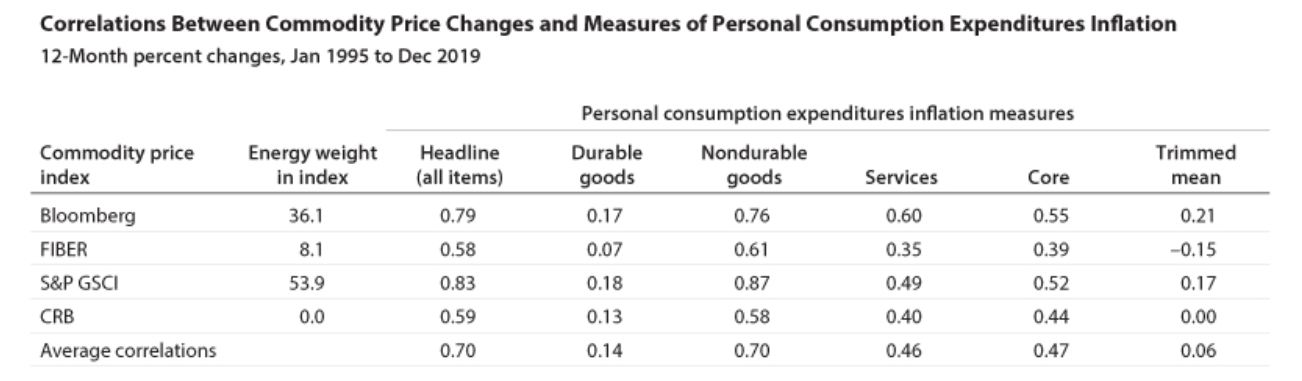
As indicated in the table below, there is a high correlation (0.70) between commodity price changes and headline inflation. In addition, researchers noted an even stronger correlation with price indexes with more significant energy components (Bloomberg, S&P GSCI) between 1995-2019. Therefore, I think SYLD works best for investors who believe inflation will run high for longer. That should also lead to higher interest rates, which also supports SYLD based on its high Financial sector exposure (19.21%).
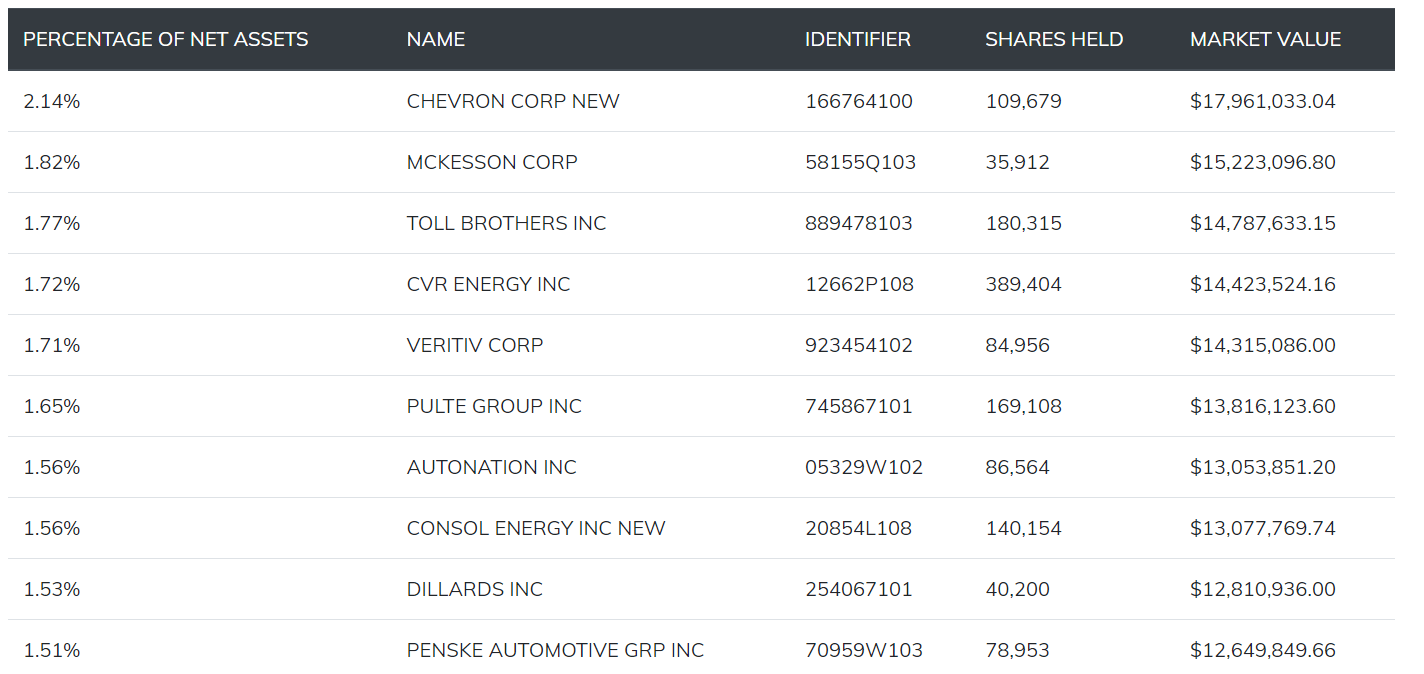
SYLD's top ten holdings are listed below, totaling 16.97%. They include Chevron ( CVX ), McKesson ( MCK ), and Toll Brothers ( TOL ). By this measure, SYLD looks well-diversified. However, as we saw earlier with SYLD's sector exposures, and as I will demonstrate next, it represents a big bet on only a handful of industries doing well. That's what makes it a high-risk, high-reward offering today.
SYLD Fundamentals By Industry
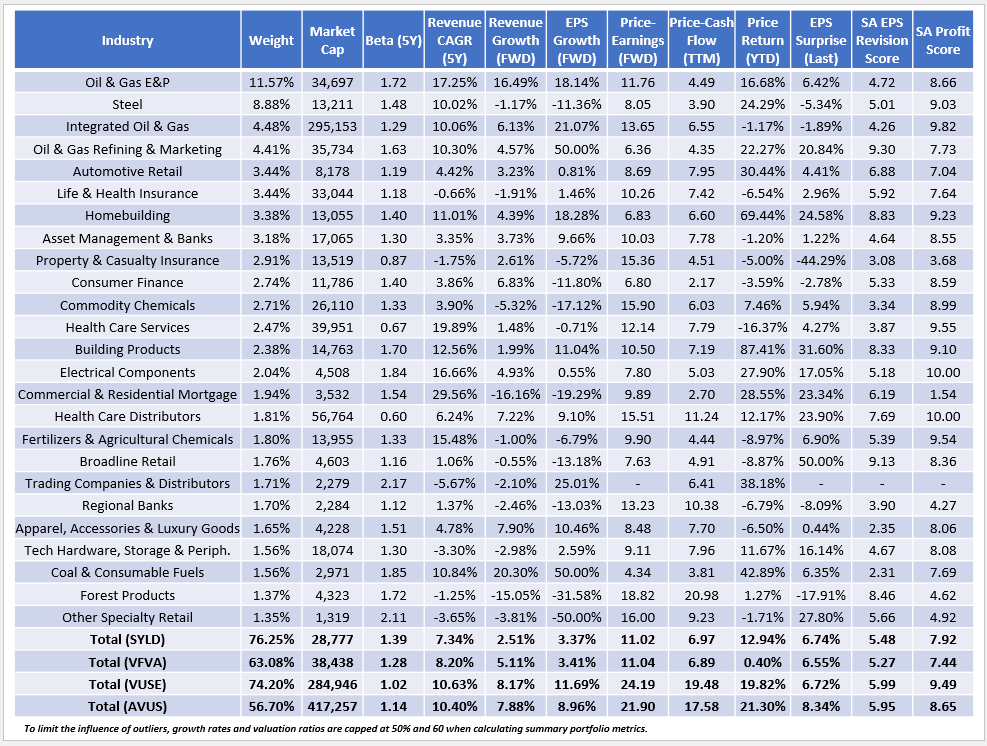
Rather than look at individual holdings, I've summarized SYLD by its top 25 industries, which total 76.25% of the portfolio. This figure is 13% more than VFVA, the #2 performing total market ETF since June 2020. SYLD and VFVA have similar weighted average market capitalizations ($29 vs. $38 billion), so they're close comparators.
I want to make a few observations:
1. Oil & Gas E&P companies total 11.57% of the fund, and their high volatility is reflected in the industry's 1.72 five-year beta. SYLD's top eight industries have betas above average, indicating it's incredibly volatile today. The composition could change as an actively managed fund, but at least for now, it doesn't look suitable for conservative investors.
2. Estimated sales and earnings growth rates are meager at 2.51% and 3.37%, respectively. VFVA's rates are slightly better, while VUSE offers the highest growth potential. Naturally, these are reflected in each ETF's valuation. SYLD and VFVA trade at 11x forward earnings, while VUSE and AVUS are at 24x and 22x.
3. SYLD's price is up 6.74% YTD. However, its constituents' prices are up 12.94%, indicating the portfolio is momentum-driven. It's a mixed bag, but we see that most Energy-related industries are up substantially on the year despite relatively poor last-quarter earnings surprises and EPS Revision Scores. This disconnect is a red flag for me, and given the volatile nature of oil prices, I'm not comfortable with the composition.
4. VUSE has the highest Seeking Alpha Profit Score at 9.49/10. Add it to the list of ETFs (along with DGRW and JQUA , reviewed here) with scores around this level and are consistent performers. To be sure, VUSE's track record is not impressive . However, according to its summary prospectus , it began tracking a new Index effective December 2022, and from what I can tell, the ETF is entirely different now. Based on a July 2022 archived version I downloaded of its holdings, VUSE's Profit Score used to be just 7.26/10.
5. SYLD's 7.92/10 Profit Score is better than VFVA's, but little focus is on quality. Recall how its methodology only screens out the outliers, which isn't good enough if consistent performance is your main objective.
Investment Recommendation
SYLD is the top-performing Total Market Focus ETF since switching to an active approach in June 2020. It's crucial that investors and analysts are aware of this change and not place weight on its performance before this date, as doing so will likely bias your analysis negatively. The relevant statistics are that SYLD ranked #7/108, #1/108, and #13/108 from 2020-2022 but has slipped to #76/108 in 2023. It's designed to be held for the long term, meaning that its potential to deliver substantial returns in one year can easily offset underperformance in others. A short three-year track record may not convince you that its strategy works.
I'm cautious about SYLD today mainly because it's so concentrated in Energy, Materials, and Financials, and high inflation and interest rates for longer is a gamble I'm not willing to take. In addition, its relatively weak profitability lends itself to inconsistent performance, and I would like to see that score improve. Until then, I think you'll find higher-quality ETFs like DGRW, JQUA, and possibly VUSE to be safer investments. Thank you for reading, and I look forward to the discussion in the comments section below.
For further details see:
SYLD: #1 For Now, But This Shareholder Yield Fund Looks Vulnerable