PHM - SYLD: A Value-Focused Strategy Worth Sticking With
2023-11-27 20:59:33 ET
Summary
- SYLD is a buy-rated ETF that focuses on companies returning cash to shareholders through dividends, buybacks, and net debt reduction.
- Global corporate buyback announcements have fallen dramatically, but actual share repurchase activity has increased.
- SYLD is a value fund with significant exposure to the Energy and Financials sectors, and its technical situation suggests a 'hold' call.
- I highlight key price levels to watch heading into 2024.
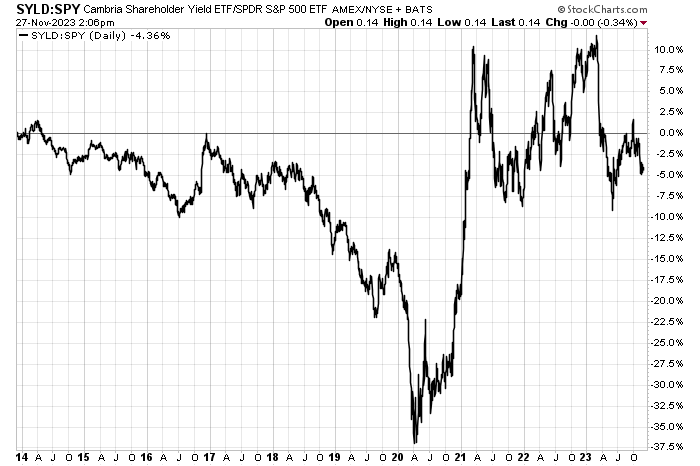
I always encourage investors and students to review relative strength performance charts as part of a well-rounded analysis. Pockets of alpha can be more easily detected through this tactic. From there, digging into the fundamentals often provides the ‘why’ with respect to performance numbers. For instance, companies buying back their stock and issuing impressive dividend amounts sharply beat the broad market from Q2 2020 through early 2021. The ‘total shareholder yield’ factor has been lackluster for closing in on three years now, though.
I reiterate my buy rating on the Cambria Shareholder Yield ETF (SYLD). I continue to like its valuation, though the technical view leaves something to be desired. Of course, investors must know what they are buying with this ETF, and SYLD is significantly overweight the value style.
Shareholder Yield Factor Neutral For Nearly 3 Years
For background, SYLD focuses on U.S. companies that are returning cash to shareholders through three attributes - dividends, buybacks, and net debt reduction, according to Cambria Funds . The ETF has a differentiated sector allocation compared to the SPX and sports a lower-than-average price-to-earnings multiple. Since corporate buybacks generally don’t trigger taxable events for investors, this fund can be considered more tax-efficient compared to strictly high-dividend payout ETFs. The total return approach can also help investors weather significant market downturns.
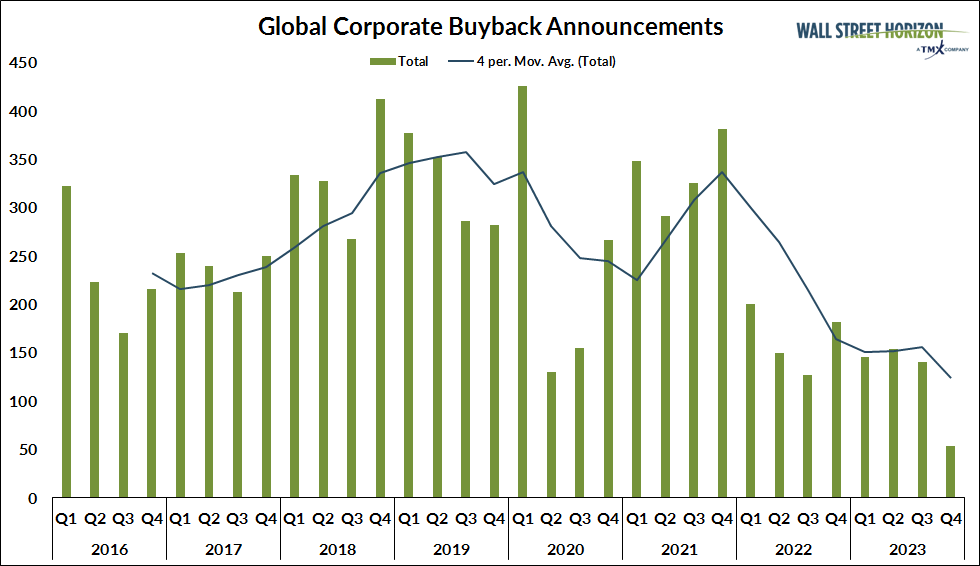
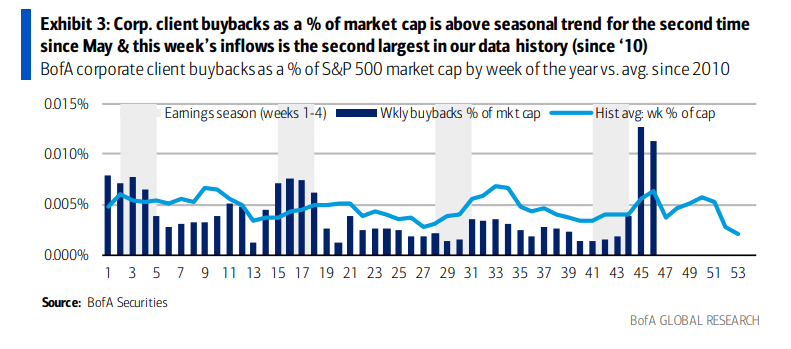
Unfortunately for buyback bulls, Wall Street Horizon reports that the count of global corporate buyback announcements has fallen dramatically in 2023. BofA reports, however, that actual share repurchase activity has spiked lately thanks to mega-cap tech-related companies being on the hunt to scoop up their own shares.
Fewer Buyback Announcements Worldwide
Buyback Activity Steps Up In November
Ranked no. 5 in its Sub Class by Seeking Alpha’s Quant Rankings, SYLD is a somewhat small ETF with just $916 million in assets under management and it pays a higher-than-market 2.5% trailing 12-month dividend yield as of November 24, 2023. Share price momentum has an A- rating, but I will detail later why I see price action as being not as sanguine as that evaluation. Moreover, there are some liquidity concerns as measured by average daily trading volume near 70,000 shares and a median 30-day bid/ask spread of 13 basis points, so using limit orders with SYLD is prudent. The fund features a moderate 0.59% annual expense ratio and is considered a risky ETF, though its 1-year price range is only about 20%.
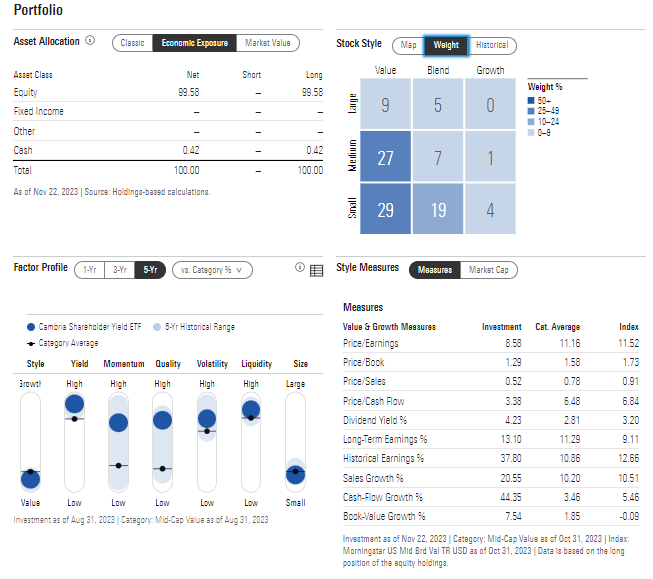
Digging into the portfolio, SYLD is very much a value fund, and there’s significant exposure to riskier mid- and small-sized companies. The 5-star, Neutral-rated ETF by Morningstar features a very low earnings multiple under 9 while it trades at a low 3.4 price-to-cash flow ratio. Long-term earnings growth near 13% makes for a PEG ratio well under 1, which is a great value from a quantitative perspective.
SYLD: Portfolio & Factor Profiles
This is where SYLD garners a few skeptics. Nearly an equally weighted allocation, more than 40% of the portfolio is invested in companies from just two sectors: Energy and Financials. Those two cyclical value niches are smaller portions of the S&P 500 with Energy being a massive overweight in the SYLD. The Information Technology sector is less than 5% of the ETF compared to a more than 20% position in the SPX. Thus, it’s important to know what you own and why you own it. Of course, the largest positions include stocks from the Consumer Discretionary sector.
SYLD Holdings & Dividend Information
Seeking Alpha
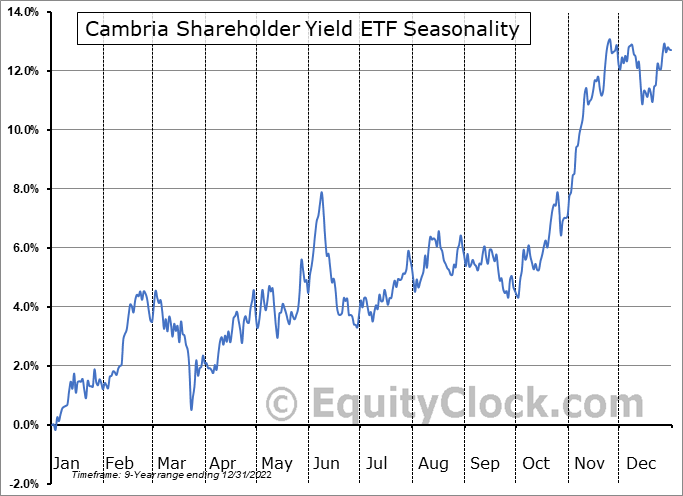
Seasonally, SYLD tends to cool off after a strong October through late November rally, according to data from Equity Clock . That is not too far off from what we’ve seen lately. The fund hit a low last month, albeit later than has been the seasonal tendency, near $58 then jumped to near $63 in recent days. The fund, on average, tends to trade sideways through early January in its 10-year history.
SYLD: Neutral Seasonal Trends Looking Through Early 2024
The Technical Take
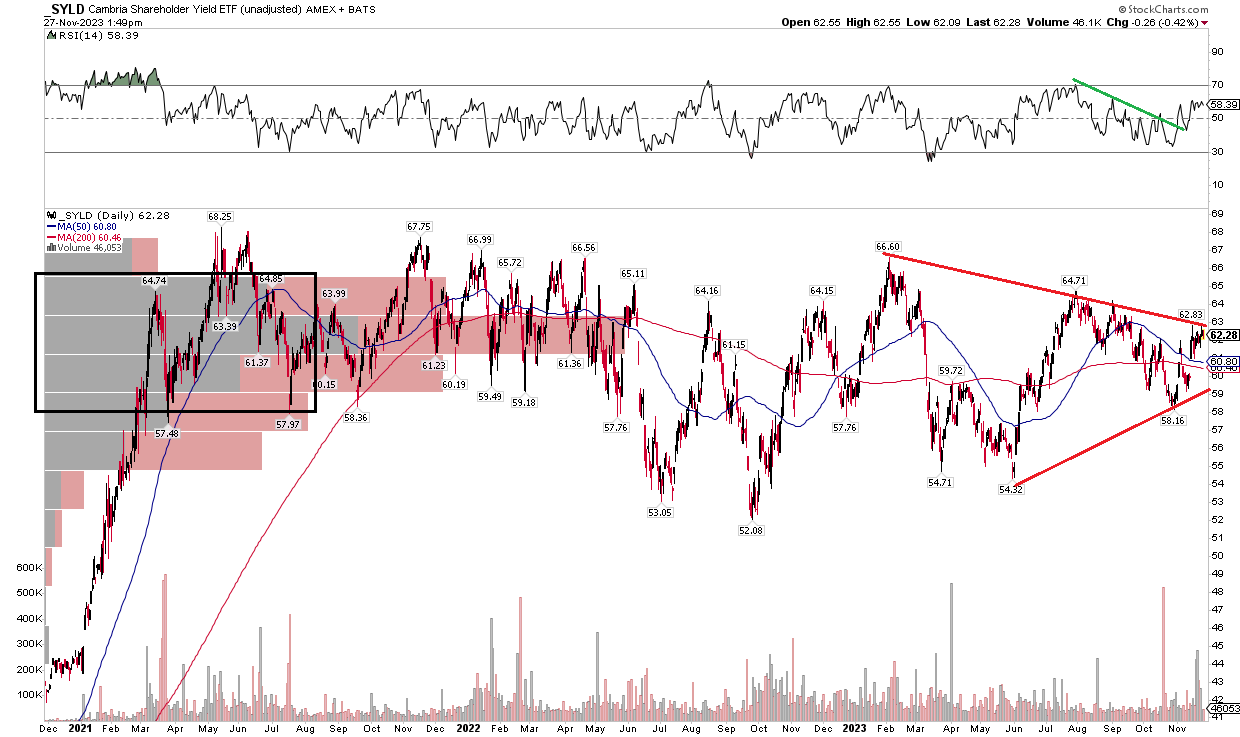
As I detailed at the onset of the second half of 2023, the low- to mid-$60s is key resistance on SYLD. Notice in the chart below that a new pattern has emerged, however. A symmetrical triangle, whereby a series of lower highs and higher lows mark a consolidation in the price trend, is in play. What’s helpful about this type of pattern is that we can project a measured move price target based on the height of the triangle. In this case, the range at the onset of the pattern was about $11. So, if SYLD breaks out above $63, then a target of near $74 would be in play.
Of course, that is just one indicator. There remains a high amount of volume by price up to the $65 mark, so it could be a challenging time for the bulls to get the ETF above that point. Finally, long-term selling pressure has been seen in the $66.60 to $68.25 zone, yet another layer of resistance. Meanwhile, support is in the $52 to $54 area. Finally, a recent bullish breakout in the RSI momentum oscillator at the top of the chart is an encouraging sign.
There are clearly mixed signals today, and with neutral relative strength compared to the S&P 500 total return since early 2021, the chart asserts a ‘hold’ call.
SYLD: Symmetrical Triangle, Bullish RSI Breakout
The Bottom Line
I reiterate my buy rating on SYLD. While it’s not the cheapest fund you’ll find and the technical situation is not perfect, it is ranked highly by the Seeking Alpha Quant system and its valuation is exceptionally low compared to the broader market.
For further details see:
SYLD: A Value-Focused Strategy Worth Sticking With