VYM - SYLD: Great Dividend Growth For The Long Term
2023-04-18 08:20:42 ET
Summary
- The Cambria Shareholder Yield ETF is designed to provide investors with exposure to mostly large and mid-cap U.S. stocks with high shareholder yield.
- The SYLD ETF invests in a diversified portfolio of a 102 U.S. stocks, delivering high shareholder yields and providing investors with exposure to a broad range of companies and sectors.
- SYLD is an actively managed fund and much smaller than alternatives in this article and could experience more volatility due to its smaller cap exposure and actively managed portfolio.
- SYLD has delivered exceptionally strong total return and dividend growth performance since its inception, outperforming the SPY and competitors over the last 3 and 5 years.
- SYLD could be very attractive for dividend growth investors looking for sustainable and fast growing dividends with capital appreciation.
Editor's note: Seeking Alpha is proud to welcome Investrava Analytics as a new contributor. It's easy to become a Seeking Alpha contributor and earn money for your best investment ideas. Active contributors also get free access to SA Premium. Click here to find out more »
Investment Thesis
Dividend growth ETFs have grown in popularity in recent times and is receiving much attention due to the perceived lower volatility and decent dividend yield and dividend growth. The current macro environment and uncertainty around fiscal policies could be contributing factors to shift to value and dividend growth. We believe that the Cambria Shareholder Yield ETF ( SYLD ) could be a great long-term investment for dividend growth investors due to its exceptional performance, deep discount valuation metrics and outsized compounded annual dividend growth rate over the last 3 and 5 years. The fund afford investors quality stock picks with fair diversification through active management, but not over diversification (which could increase the probability of inclusion of average to lower performing stocks in our opinion) as an alternative to single stock selection without the market timing complexity. SYLD could also be a great alternative/complementary fund to the common Large to Mega-Cap dividend funds. This article focus on this top performing, albeit it lesser known ETF. We will go into some analysis and details of SYLD to point out its great performance based on total returns, dividend growth and other metrics.
Fund Objectives and Approach
SYLD was incepted in May 2013 and changed to an actively managed fund from June 2020, so a relatively high level of sector and stock rotation can be expected in our opinion. The objective of the fund is income and capital appreciation. As per cambriafunds.com:
"The Cambria Shareholder Yield ETF utilizes a quantitative approach to invest in US equities with high cash distribution characteristics. The initial screening universe includes stocks in the United States with marketing capitalizations over $200 million. The ETF is comprised of the 100 companies with the best combined rank of dividend payments and net stock buybacks, which are the key components of shareholder yield. The ETF also screens for value and quality factors, including low financial leverage."
Asset Allocation
Asset allocation is predominantly focused on large and mid-cap stocks equality weighted in contrast to comparative funds in this article mostly concentrated on large to mega-caps, which are market cap weighted. It could be a great alternative / complementary fund to the more popular utilisation of mega-caps in our view. The equal weighting could diversify risks and avoid a "top heavy" fund with only 17.69% in the top 12 of the fund (according to cambriafunds.com):
cambriafunds.com
Sector Weights
The fund consists of a diverse mix of sectors with currently a high tilt towards consumer discretionary, financials, energy and materials and low exposure to technology that could be an interesting mix for current market conditions to capitalise on valuations in our view. Most SYLD holdings have overall strong profitability as illustrated by about 80% having a Quant Profitability rating of B- or higher (according to cambriafunds.com).
cambriafunds.com
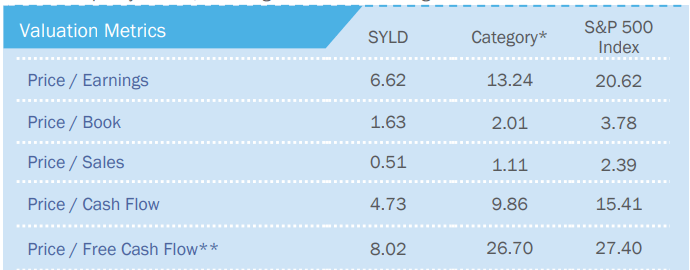
Valuation Metrics
The fund constituents are extremely strong on valuation metrics - with reference to the US Fund Mid-Cap Value Morningstar Category and S&P 500 as of March 31, 2023 (according to cambriafunds.com) that could provide some downside protection and accelerated growth prospects to support fund objectives in our view:
Fund Holdings
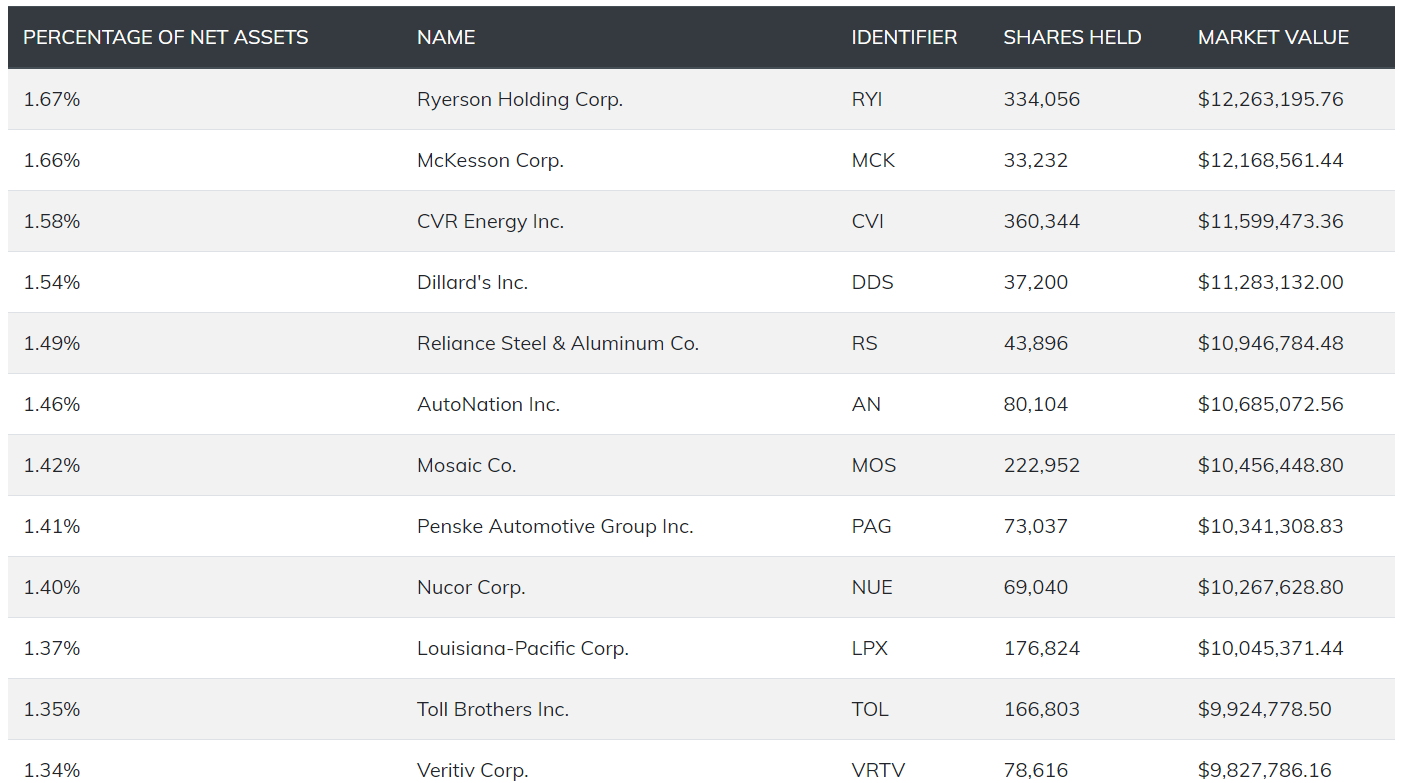
SYLD's investment managers consider broader portfolio diversification, resulting in a reasonably well diversified equally weighted fund. SYLD's current 102 constituents is a reasonably focussed amount, much lower than that of most broad-based U.S. equity indexes, however, this is a result of strict screening and quality filters based on the set of value, profitability, and debt criteria all working together to minimize the number of included stocks in an attempt to limit average to lower performance in the medium to longer term. Here are lists of top 12 and bottom 12 holdings (according to cambriafunds.com) on April 11, 2023 (higher weights are a result of recent outperformance and other factors):
Top 12 Holdings
An interesting observation is that the top 12 is containing none of the mega-caps ($200 billion + total market capitalization) - an interesting and alternative approach to supplement any portfolio and in our view a great way to diversify from the oversubscribed mega-caps. The top 12 only carries 17.69% of the total fund value avoiding a "top heavy" fund allocation spreading risk more evenly in our opinion.
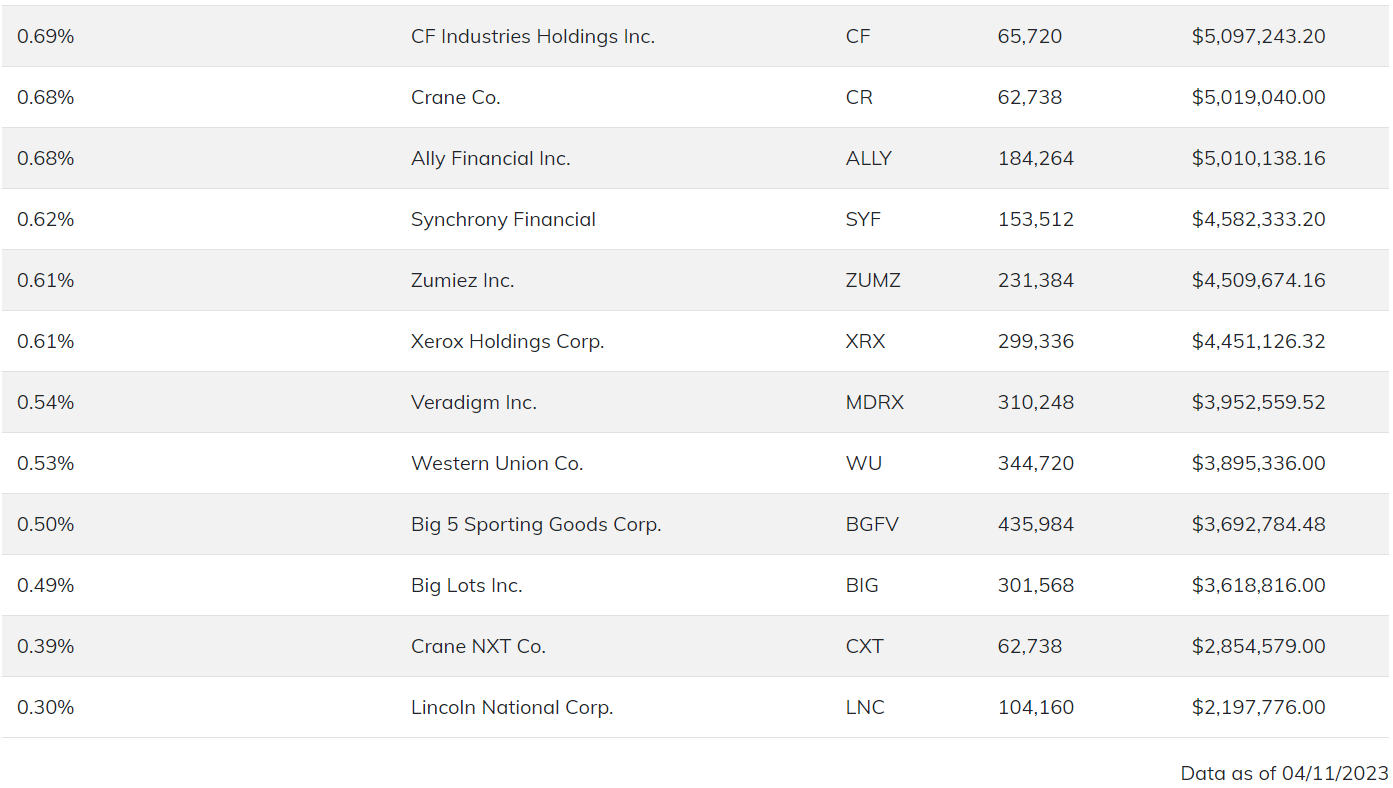
Bottom 12 Holdings
The bottom 12 comprise of a mix of deep value plays in mostly the Financials, Industrials and Technology sectors, but only carries 6.64% of the total fund value managing risk exposure to potentially the most volatile tickers in the fund in our opinion.
Fund Performance Analysis
To better understand the quality and performance of the constituents, some analysis of the average of the top 12 as well as the average of the bottom 12 is looked into. The metrics used include total return performance, earnings per share growth, valuation and dividend related measures. Although 3 and 5 year time horizons are included, consideration must be given that constituents might not be included in the fund from the start of these periods.
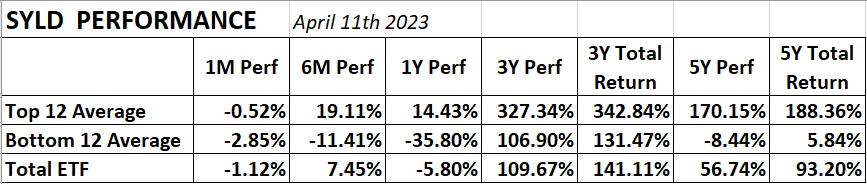
Total Return Performance
Author's analysis based on seekingalpha.com
Impressive performance figures especially the top 12 (based on statistics from Seeking Alpha). A substantial difference is seen between the top 12 and bottom 12 with the aggregate fund figure somewhere in between. We are of the opinion that this could point to the value driven selection criteria in combination to the diversification towards higher volatility mid-caps utilised, resulting in a fair amount of volatility the past few years.
EPS Growth
Author's analysis based on seekingalpha.com
The Earnings per Share Growth on Year to Year as well as the annual figures (based on statistics from Seeking Alpha) over the last 3 years are exceptionally strong for the top 12 and very strong for the bottom 12. It is encouraging for us to see even the bottom 12 having very strong earnings growth underlining the general quality of stock picks within the fund in our view.
Valuation
Author's analysis based on seekingalpha.com
From a relative valuation perspective, the S&P 500 Weighted Average PE Ratio at April 1, 2023 was 22.05 and the Price per Book 4.12 (according to data.nasdaq.com). This clearly indicate far superior value for both the top 12 and bottom 12 (based on statistics from Seeking Alpha).
Dividend Related Metrics
Author's analysis based on seekingalpha.com
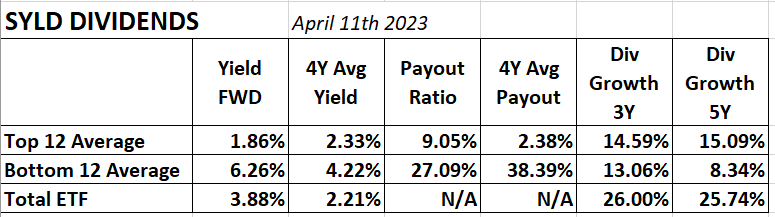
Dividend related metrics (based on statistics from seekingalpha.com) comes out exceptionally strong in general. What the bottom 12 are conceding in terms of price performance, they are compensating for in terms of dividend yield. Payout ratios are very conservative overall, but much higher for the bottom 12 than the top 12 but still quite sustainable in our view. Total ETF Dividend growth is exceptional with apparently the middle section of the fund (excluding the top 12 and bottom 12) being the big contributor to the fund's massive annual dividend growth rate of around 26% over the last 3 and 5 years.
Key observations from the fund performance analysis
- Overall fund total return performance is eye catching in spite of the lower performance of the bottom 12
- Earnings per share growth is very strong with the top 12 leading the way by a big margin.
- Valuation metrics reflect the great value contained and driving of possible out-performance in the future in our view.
- Dividend yield is attractive and boosted by the high yield of the bottom end of the fund. Dividend growth is massive with very sustainable payout ratios throughout the fund.
- The overall fund composition seems to be bringing together the best of price performance, value characteristics, dividend yield and dividend growth in a focused actively managed fund avoiding top-heavy and over-exposure risks in our opinion.
Total Return Comparison
For reference, how does SYLD compares to a few rivals? It shines in the key investor metric of total returns. Here is a comparison (as on market close April 11th 2023) with SCHD, VIG, VYM and SPY (from Seeking Alpha) with far superior 3-year (161.46%) and 5-year (88.88%) figures (figures are always net of fees):
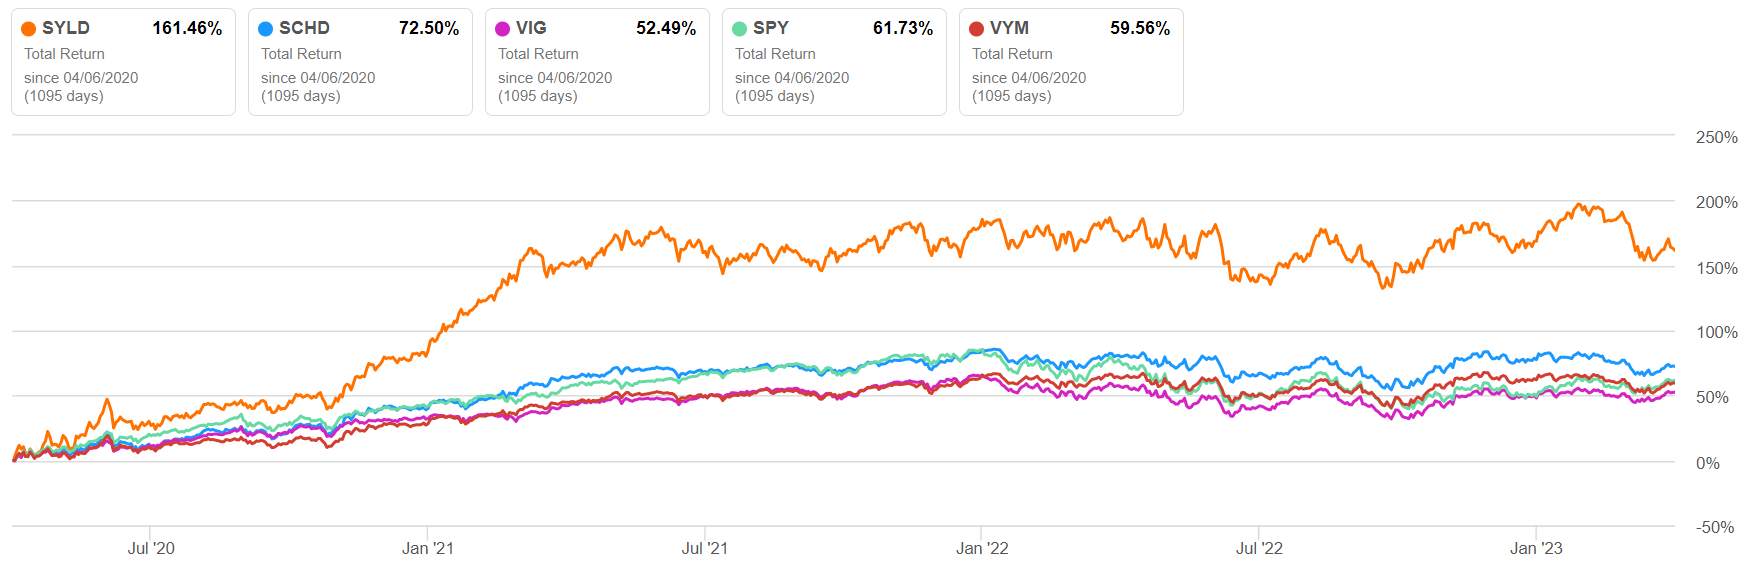
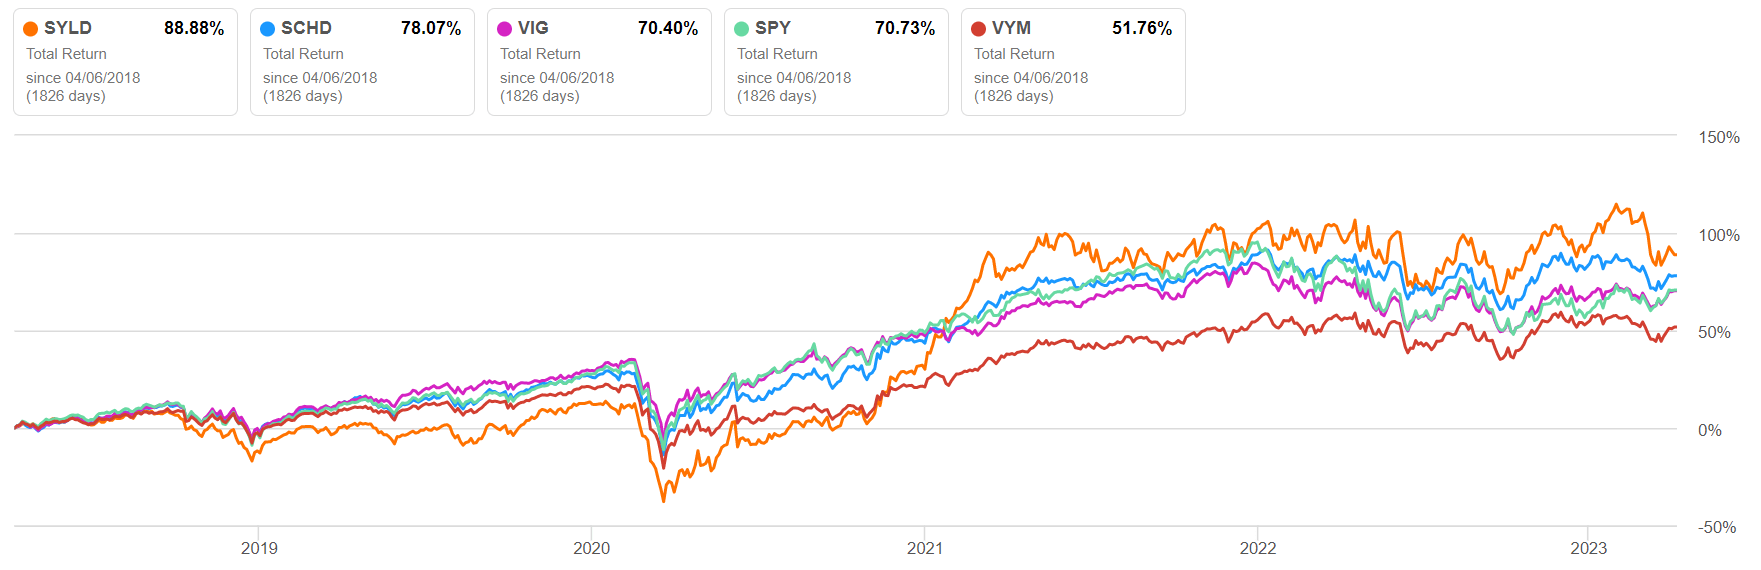
The strongest period for SYLD was between May 2013 and June 2021, when it managed to deliver a CAGR of almost 16% in spite of the Covid-19 drop during early 2020.
Dividend History Comparison
SYLD is paying dividends on a quarterly basis, but of more importance, its dividend growth measured as CAGR over the last 3 years (26.00%) and 5 years (25.74%) is exceptional and far superior to compared funds. Here is a view on some dividend and dividend growth statistics (from Seeking Alpha) sorted on dividend CAGR over the last 5 years.
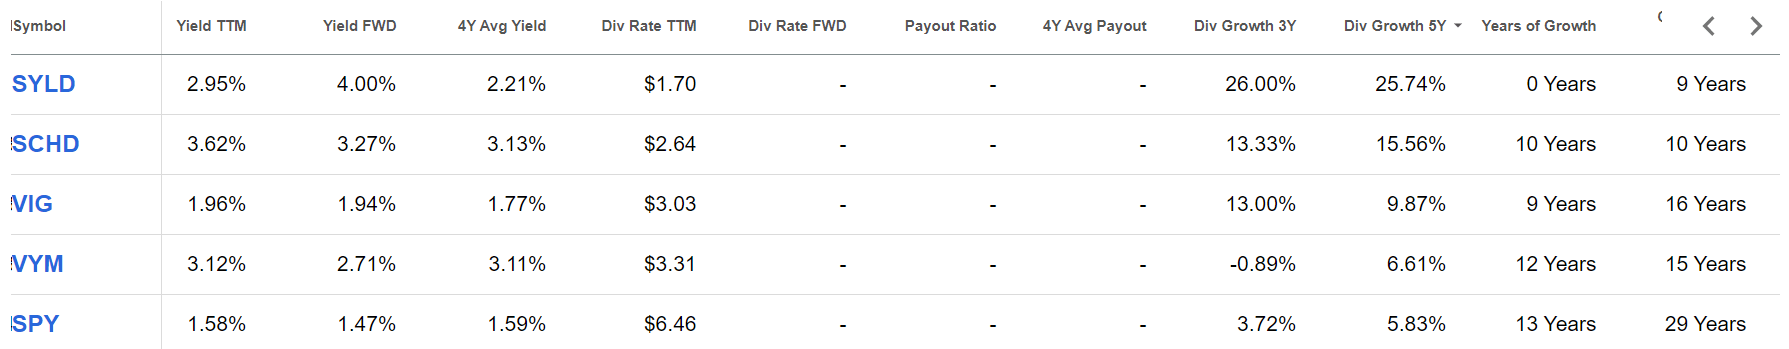
Manageable Risks
SYLD's AUM is $713.15 million - a small fraction compared to for instance SCHD, VIG and VYM, however, it has been growing relatively fast. This figure could be too small for some speculators / traders although we would not consider it an issue for long-term retail investors. Its Week Volume/Shares is standing at 1.22% compared to 0.44%, 0.25% and 0.24% for SCHD, VIG and VYM respectively (based on statistics from Seeking Alpha), which is compensating somewhat from a trade volume perspective in our view.
The asset allocation focus on large and mid-cap could result in higher volatility (as can be seen in the price history) and lower performance over some periods, but could also drive outperformance as manifested. The equal weighting approach for stock selection (although other discretionary factors are impacting as well) is reducing risk of over exposure to a single stock or few stocks (top-heavy effect) with Ryerson Holding Corp the biggest holding at 1.68%.
The current sector weightings are somewhat unconventional. This could be a risk in the medium to longer term, but this actively managed fund has a high level of turnover (51%) to adjust to the latest market conditions and geopolitical factors. Cambria will restart the screening process at the end of each calendar quarter by searching across the universe of more than 3000 stocks. Although Cambria seeks to equally weight the 100 stocks selected at each quarter-end, weights may fluctuate in response to market conditions, investment opportunities and/or tax considerations.
Conclusion
SYLD is a top performing actively managed dividend ETF measured by total return and dividend growth achieved by an equal weight, selective, large to mid-cap value stock selection approach. We are not aware of better total return and dividend growth metrics for any similar type of dividend ETF over 3 and 5 years. Considering its great track record over nearly 10 years (albeit with some amount of volatility), exceptional current value characteristics and top dividend growth, we would recommend this ETF to be carefully considered by any dividend growth investor, especially as an alternative / complementary to mega-cap heavy funds. We believe that with a dollar-cost-averaging approach, SYLD offers long-term investors the opportunity to achieve sustainable and fast growing dividends supported by capital growth.
For further details see:
SYLD: Great Dividend Growth For The Long Term