DTEGY - T-Mobile Vs. Verizon: Which Is The Better Telecom Stock?
2023-05-11 10:39:21 ET
Summary
- In this article, I explore the question of whether Verizon Communications Inc. stock is better than T-Mobile US, Inc. or whether the high-growth company is a better long-term investment.
- I highlight the key differences that justify the seemingly excessive valuation of T-Mobile US stock.
- I lay out my long-term expectations for the US telecom industry, discuss why I don't believe in Verizon Communications' terminal decline, and why I consider its dividend reasonably safe.
- At the same time, I point out a scenario in which Verizon could be forced to rebase its dividend.
- I also explain how to invest in T-Mobile US while collecting an attractive dividend that also has quite favorable tax characteristics.
Introduction
Fundamentally, I am not a big fan of the telecommunications industry, as it is very capital intensive and competition is fierce. However, telecom companies do have an economic moat because they operate in an oligopoly, which allows them to generate at least acceptable shareholder returns, with the added advantage of being relatively non-cyclical. After all, a phone contract is one of the last to be cancelled in times of economic distress, similar to utility bills. I would even go so far as to say that "being connected" has become almost as important as electricity and a heated home.
In this article, I take a close look at telecom stocks T-Mobile US, Inc. ( TMUS ) and Verizon Communications Inc. ( VZ ). The investment cases are straightforward:
- T-Mobile is growing aggressively, capturing market share, and offering a phenomenal value proposition that customers appreciate, especially in tough economic times. It is a growth stock, and investors welcome the fact that management is investing heavily in the company and therefore not (currently) paying a dividend. The company is currently in transition from aggressive growth to improving profitability.
- Verizon is "the better AT&T ( T )" because it is more conservatively managed and has not committed nearly as many strategic blunders. Its asset base is extremely solid, and the company is far less dependent on leased assets than T-Mobile. Verizon continues to pay an increasing dividend, which is why the stock is popular with income-oriented investors - after all, VZ stock currently yields nearly 7%.
While the investment cases are straightforward, they still come with some caveats and important considerations that I'd like to discuss in this article. In my view, it doesn't make sense to run out and buy Verizon stock in haste just because it pays a high dividend - after all, there's also a way to invest in TMUS and also benefit from a growing dividend.
Let's start by comparing the size and growth trajectory of the two telecom companies....
Customer Base And Growth: Is Verizon Larger Than T-Mobile?
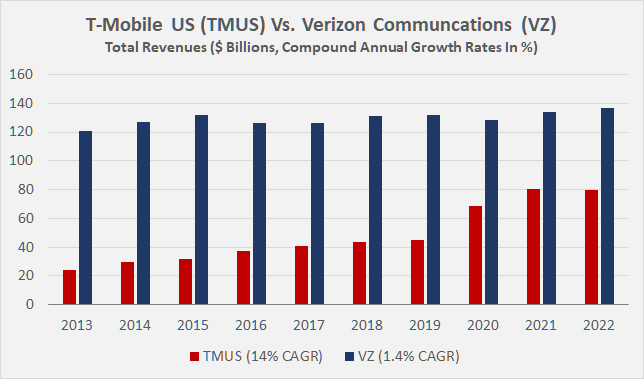
Both Verizon and T-Mobile US are very large companies, as evidenced by their current market capitalizations ((MC)) of approximately $158 billion and $174 billion, respectively. Of course, MC by itself tells only part of the story - and this is especially important for capital-intensive companies - as discussed in a later section of the article. In terms of revenues, Verizon is (still) much larger, with operating revenues of $136.8 billion in 2022 (up 2.4% year-over-year), compared to TMUS' $79.5 billion (roughly flat year-over-year). The market values TMUS' revenues significantly higher than Verizon's, which is an early indicator of TMUS' stronger growth potential despite its flat performance in 2022. Longer-term revenue trends look as follows:
Figure 1: T-Mobile US [TMUS] vs. Verizon Communications [VZ]: Total revenues and compound annual growth rates (CAGR) in % (own work, based on data supplied by Morningstar)
TMUS has significantly outperformed Verizon over the past decade, but the huge revenue increase in 2020 was due to the merger with Sprint that year, which also significantly improved T-Mobile's spectrum position and thus the quality and reach of its services, in particular 5G. The $26 billion all-stock deal was undoubtedly bold, but it has put T-Mobile US well ahead of AT&T and much closer to Verizon, allowing it to take advantage of economies of scale. According to T-Mobile’s 2020 10-K (p. 42), its customer base grew by more than 34 million, or 50%, to 102.1 million. However, T-Mobile also reported strong growth of nearly 5 million new customers last year to 113.6 million (+4% year-over-year).
In contrast, Verizon's total wireless retail connections declined by about 875,000 to 114.5 million (-0.8% year-over-year) in 2022 (p. 29, VZ 2022 10-K ). This figure excludes approximately 8 million Total Broadband connections and 3 million retail Fios Video connections. Verizon's Business segment had approximately 29 million wireless connections (+4.8% year-over-year) and approximately 1 million Total Broadband customers. In total, the company had approximately 144 million wireless connections at the end of 2022.
Taken together, Verizon is still larger than T-Mobile US (and AT&T) in terms of postpaid phone market share, but T-Mobile is catching up fast thanks to its well-priced plans , leading 5G coverage and network speeds . As a result, T-Mobile has lower average revenue per user ((ARPU)) than Verizon and lower margins (see below), but that will obviously change as the company increasingly focuses on profitability and less on aggressive growth.
TMUS Vs VZ – Which Company Generates Stronger Cash Flow And Is More Profitable?
As already indicated, Verizon is still significantly more profitable than T-Mobile, but this is to be expected due to its longer history as a dominant provider and extremely solid asset base. However, the merger of T-Mobile with Sprint in 2020 was, in retrospect, brilliant, not only because of the much-improved spectrum coverage, but also because of the synergies and cost savings that were and will be achieved in the process. Integrating such complex businesses is not easy, but the parties involved are doing a phenomenal job. As a result, free cash flow ((FCF)) at T-Mobile is expected to continue to experience a healthy growth spurt.
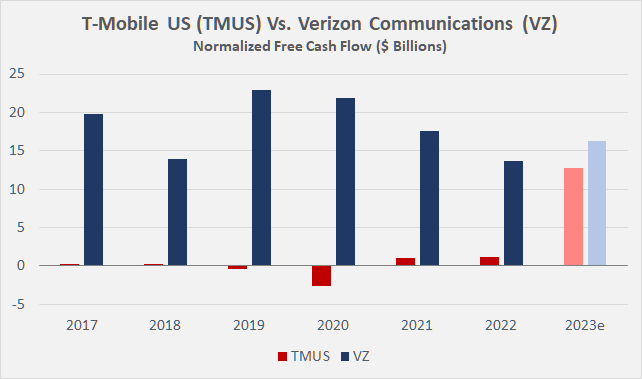
In direct comparison (Figure 2), T-Mobile naturally and understandably looks much worse than Verizon. However, it should be remembered that the company realized approximately $6.0 billion in merger synergies in 2022 and expects synergies of approximately $6.4 billion (after related costs) in 2023 ( 2022 Q4 earnings press release ). As a result, free cash flow is expected to increase sharply to approximately $12.8 billion after adjusting for estimated stock-based compensation expenses. In contrast, Verizon's FCF has not grown in recent years and actually declined in 2021 and 2022. However, in the first quarter of 2023, operating cash flow improved 22% year-over-year, primarily due to improvements in working capital and better customer payment behavior. I think it's reasonable to expect Verizon's free cash flow to continue to improve as the year progresses. According to FAST Graphs, analysts expect the company's FCF to grow 19%, 14%, and 1% between 2023 and 2025, and while these are per-share growth rates, I wouldn't overstate any potential impact from buybacks (VZ's diluted shares outstanding have actually increased slightly in recent years).
Figure 2: T-Mobile US [TMUS] vs. Verizon Communications [VZ]: Free cash flow, normalized with respect to working capital movements and adjusted for stock-based compensation expense, nFCF (own work, based on the companies’ 2017 to 2022 10-Ks, 2022 full-year earnings press releases and analyst estimates according to FAST Graphs)
Importantly, these figures do not include investments in spectrum licenses and related intangible assets. Over the past six years, TMUS and VZ have spent $21 billion (not including the Sprint transaction) and $58 billion, respectively, in this regard, with the lion's share of Verizon's investment coming from the 2021 5G spectrum auction (nearly $48 billion according to VZ's 2021 cash flow statement). Against this backdrop, TMUS's merger with Sprint and the resulting improvement in its spectrum position was a smart move, but I submit that the two telecom giants are not directly comparable due to the significantly different proportion of owned licenses. Nonetheless, Verizon's aggressive bid for 5G licenses in 2021 in particular illustrates the capital-intensive nature of the industry and underscores the desperate need to operate at the forefront of technology - literally at any cost. That being said, I would not consider these investments to be traditional capital expenditures due to their longevity, although it can be argued that spectrum improvements are indeed recurring.
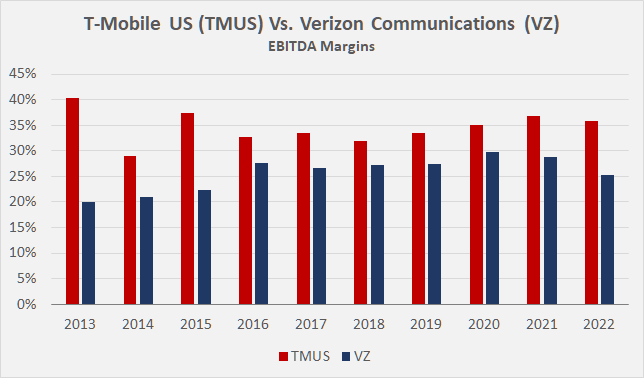
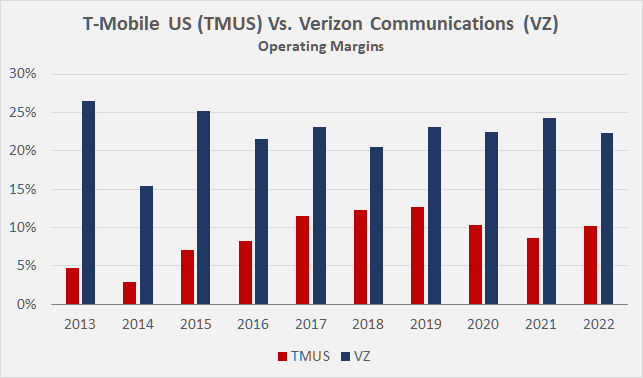
Verizon's long-standing position and T-Mobile's aggressive growth also make the two companies difficult to compare from a profitability perspective. Because of the capital intensity comparable to utilities and the heavy reliance on fixed assets, I believe operating and EBITDA (earnings before interest, taxes, depreciation, and amortization) margins are the only meaningful comparisons. While T-Mobile's EBITDA margin is quite a bit higher than Verizon's (Figure 3), the picture reverses when depreciation and amortization are taken into account (Figure 4), which confirms the dependence on slowly depreciating assets and the much lower utilization of leased assets, in my view. However, as T-Mobile's free cash flow increases, management may consider acquiring more and more spectrum licenses rather than returning cash to shareholders through buybacks (see below).
In the long run, we can expect T-Mobile, Verizon and AT&T to play more or less on a level playing field, with churn rates moving up and down over time. I think it is an extremely pessimistic and unrealistic scenario to expect T-Mobile to build a de facto monopoly in wireless. At the same time, it should not be forgotten that Verizon still has more extensive network coverage and is, therefore, often preferred in rural areas. The company also has extensive fixed line assets. T-Mobile, on the other hand, does not have any significant assets in this context and is therefore (still) in a worse competitive position from this perspective as well. Verizon has significantly more leverage through its fixed line network, so I would not overinterpret T-Mobile's industry-leading 5G coverage, which could face a bottleneck as networks become denser. At the same time, it's also worth noting that Verizon is slowly but surely starting to compete with Comcast Corp. ( CMCSA , see my recent earnings update ) and Charter Communications, Inc. ( CHTR ) through its fixed wireless offerings.
Figure 3: T-Mobile US [TMUS] vs. Verizon Communications [VZ]: EBITDA margins (own work, based on data supplied by Morningstar) Figure 4: T-Mobile US [TMUS] vs. Verizon Communications [VZ]: Operating margins (own work, based on data supplied by Morningstar)
The still quite different positioning and strategy are also the reason for the difference in ROIC and CROIC (return and cash return on invested capital). Unlike asset-lean businesses (e.g., banks, asset managers, most IT companies), it is unreasonable to expect telecommunications companies to generate a significant return on invested capital in excess of their cost of capital. Over the past five years, Verizon's and T-Mobile's ROIC has averaged 8.4% and 4.5%, respectively, while the gap widens considerably when free cash flow (or lack thereof) is taken into account: 9.0% for Verizon and -0.4% for T-Mobile. Comparing these figures to the companies' weighted-average cost of capital ((WACC)), we can determine whether the companies are earning tangible residual returns on their invested capital.
Generally speaking, I am not a fan of employing capital asset pricing model-based return expectations because they are largely based on the volatility of stocks. Instead, I determine my own expected returns, which depend on industry, company size, positioning and many other factors. I typically target a cost of equity of at least 7% for the bluest blue chips, but the number can be significantly higher. For telecoms, I think a cost of equity of 9% is appropriate in the current interest rate environment, which puts the WACC of VZ and TMUS currently at 5.1% and 6.6%, respectively. The - at first glance unintuitive - discrepancy is due to the higher weighting of equity in the case of T-Mobile.
Thus, compared to ROIC and CROIC, Verizon can be expected to continue to generate positive residual returns on its invested capital, while I would not overinterpret T-Mobile's negative returns as FCF is expected to increase significantly in 2023. In conclusion, I expect T-Mobile's profitability to improve significantly over the coming years, while Verizon's lead in profitability will most likely decrease, but should remain well above TMUS, at least in the short term.
T-Mobile's And Verizon's Balance Sheet – How Big A Problem Is The Debt?
Both T-Mobile and Verizon, unsurprisingly, have significant debt on their balance sheets. In my view, the best way to compare the debt levels of the two companies is to include lease liabilities. At the end of 2022, T-Mobile and Verizon reported debt and gross lease liabilities of approximately $118 billion and $180 billion, respectively, resulting in enterprise values ((EV)) of $292 billion and $338 billion. These values yield EV/MC ratios of 1.68 and 2.14, respectively, suggesting that either equity investors value TMUS at a relative premium, TMUS has relatively lower debt, or a combination of both.
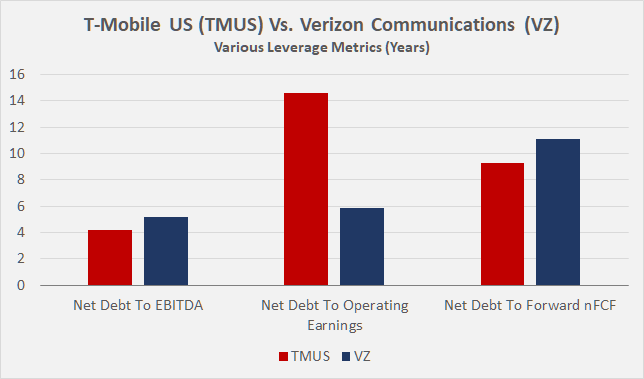
Comparing net debt and lease obligations to 2022 EBITDA, it is clear that Verizon is leveraged more significantly, with a ratio of 5.2x compared to T-Mobile's 4.2x (Figure 5). However, this discrepancy is largely due to Verizon's aggressive 5G spectrum bid in 2021 and TMUS' higher EBITDA margin. Replacing EBITDA with operating income, the picture reverses as expected and significantly in favor of Verizon (5.9x vs. 14.6x). However, given T-Mobile's focus on growth in recent years, I think a comparison with forward FCF is probably fairest and resulting in overall lower leverage for T-Mobile.
Given that the ratios shown in Figure 5 relate to annualized earnings, they can be interpreted as the number of years it would take each company to repay its debt.
Figure 5: T-Mobile US [TMUS] vs. Verizon Communications [VZ]: Various leverage metrics (own work, based on the companies’ 2022 10-Ks, 2022 full-year earnings press releases and analyst estimates according to FAST Graphs)
Although I maintain that these leverage ratios are acceptable for telecommunications companies, I would still like to highlight the sheer amounts in absolute terms and also point out other liabilities, such as pension-related liabilities and deferred taxes. If these were not telecommunications companies with very predictable and reliable cash flows, Verizon and T-Mobile's creditors would probably never have allowed such high levels of debt and other liabilities.
Moody's current long-term credit ratings for T-Mobile and Verizon are Baa2 and Baa1, respectively, both with a stable outlook. In its December 16, 2022 report , the rating agency positively highlighted Verizon's size and solid asset base, as well as the company's strong market position. T-Mobile's rating was recently upgraded from Baa3, and in its April 06, 2023 report , Moody's highlighted the company's growing FCF and "strong operating performance relative to its competitors".
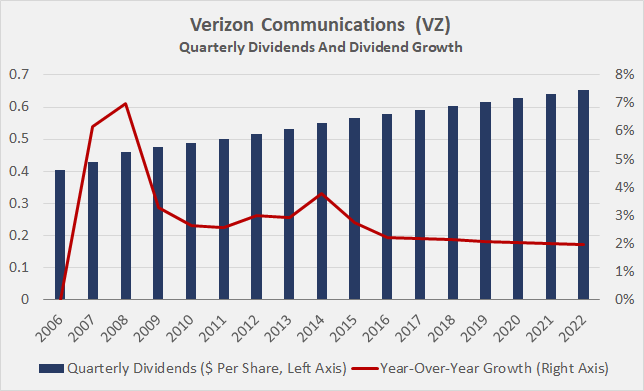
Verizon pays out a significant portion of its FCF in dividends (80% and 67% of 2022 and expected 2023 nFCF, respectively), and has increased its payout to shareholders for 18 consecutive years . In principle, I consider the dividend safe, although a return to higher inflation rates or a long-term stagflationary environment could make a dividend cut necessary (see section on risks). However, Verizon's weak nFCF growth and the maintenance of rather paltry dividend increases of $0.05 (annualized) since 2016 suggest that dividend growth will most likely continue to decline in the future (Figure 6). Largely due to the weak recent performance of VZ stock, the current dividend equates to a current yield of nearly 7%, which makes the insignificant growth seem less problematic. However, investors should keep in mind that their Verizon dividend is slowly but surely losing purchasing power, assuming that mid-single digit inflation rates become the norm (see my article on the fallacy of inflation protection through high dividend yields).
Figure 6: Verizon Communications [VZ]: Quarterly dividends and dividend growth (own work, based on the company's investor relations website)
T-Mobile does not currently pay a dividend and has no plans to do so in the foreseeable future (p. 26, 2022 10-K ). However, the company announced a $14 billion stock buyback program in September 2022. To put the repurchase authorization in perspective, this would allow the company to retire approximately 8% of its weighted average diluted shares in 2022 based on the current price of TMUS stock. In 2022 and the first quarter of 2023, the company has already spent $7.6 billion on repurchases, reducing the quarterly weighted average diluted shares outstanding by 2.4% to 1.225 billion. Especially from an enterprise value-based valuation perspective (see valuation section), I consider the buybacks an appropriate use of capital.
However, dividend-oriented investors should not write off T-Mobile prematurely. Deutsche Telekom AG ( DTEGY , DTEGF ) is the largest shareholder of T-Mobile US (49% of shares, including treasury shares, p. 6, 2022 annual report ) and recently paid a dividend of EUR 0.7 per share for 2022, which translates to a yield of about 3.3%. In principle, there are two caveats. First, German companies typically pay the entire dividend in a single installment, so don't expect evenly distributed quarterly payments. Second, the German withholding tax on dividends is substantial (26.375%), and it is relatively difficult to reclaim the excess amount withheld (usually 11.375%). In the case of Deutsche Telekom, however, investors currently receive the gross dividend and can expect to continue to do so in the foreseeable future. DTEGY currently pays its dividend from the tax contribution account in accordance with the German Corporation Tax Act, but this in turn means that the dividend payment reduces the tax-relevant acquisition cost base of the shares.
What Risks Should Be Considered Before Investing In VZ Or TMUS Stock?
Of course, leverage is a major risk when investing in TMUS or VZ. If, for whatever reason, the companies experience revenue problems or their cost structure deteriorates, the shares will certainly come under considerable downward pressure. Yet it is precisely the stable revenue trend, the predictable cost structure, and the economies of scale that make such high leverage possible in the first place. The rising interest rate environment further increases the risk, as interest coverage declines as the debt matures and needs to be refinanced. For 2022, Verizon's and T-Mobile's interest coverage ratios were approximately 5.5 and 4.8 times 2023 expected nFCF before interest, respectively. These numbers are, in my view, acceptable for telecommunication companies.
Given the mandatory nature of the services offered by TMUS and VZ, I doubt that the currently expected recession poses a significant risk to the companies' debt servicing capacity. Rather, I think that a long-term stagflationary environment could slowly but surely threaten the profitability and hence debt servicing capacity of T-Mobile, Verizon, and many other highly leveraged capital-intensive companies.
Another important risk, relevant to both TMUS and VZ, is growing regulatory pressure given the essential nature of the services. This may sound overly conservative, but I personally view all essential service providers as more or less dependent on regulators. For utilities, and this is already confirmed in some countries (see my article ), I would not rule out a secular decline in allowed returns on equity, and I therefore think that telecoms could also come under increasing pressure. It is also worth taking into account that regulators control the licensing of spectrum components. However, due to the more or less unregulated nature of the telecom business, I consider TMUS and VZ to be less susceptible to political risks than utilities, but I still think these risks are important to consider.
One risk that is generally relevant to companies that rely heavily on fixed assets and derive much of their profitability from economies of scale is the risk of malinvestments. In this context, AT&T serves as a well-known negative example, and so far I would argue that capital allocation at TMUS and VZ has been overall positive. Of particular note are TMUS's mergers with MetroPCS in 2013 and with Sprint in 2020, and the significant synergies that have been and continue to be realized (well above initial expectations).
T-Mobile's focus on 5G and the high investments associated with it should also be seen as a risk. If the technology develops to TMUS's disadvantage, this could lead to further high investments, which could quickly bring the company's leverage to risky levels and lead to lower shareholder returns.
Competition remains fierce, but I would not over-interpret this risk given the consolidated nature of the industry. As the playing field becomes more level, there is no real incentive for price wars. However, a continuation of significant reliance on third-party infrastructure would certainly limit T-Mobile's financial firepower in the (unlikely) event of a price war, potentially leading to higher capital expenditures and weaker shareholder returns. That said, Verizon's decision to increasingly compete with cable companies and the potentially ensuing price war may lead to similar negative results, especially given Comcast's very strong position (see my article from last October ).
Finally, and this is by no means an exhaustive list of investment risks, if a U.S.-based investor wants to take an indirect stake in TMUS through Deutsche Telekom AG, exchange rate risk should be considered alongside company-specific risks, as should local political risks. Deutsche Telekom reports its earnings in euros and pays its dividend in euros, so an appreciation of the U.S. dollar would lead to a depreciation of the stock's valuation and the domestic purchasing power of the dividend. Of course, a devaluation of the USD/EUR currency pair would be beneficial for U.S.-based investors, all else being equal.
Stock Valuation: Is T-Mobile Worth More Than Verizon?
There is no denying that TMUS stock has significantly outperformed Verizon stock over the years. For example, since 2007, VZ has generated an annualized rate of return of 4.6% (including dividends but excluding dividend reinvestment), while TMUS has generated a return of 6.0% p.a. over the same period. In my view, it can be argued that the comparison is not entirely realistic, since TMUS did not pay dividends to shareholders during this period and reinvesting dividends would definitely have improved VZ's return. Still, both stocks underperformed the S&P 500 (SP500), which has returned 7.8% annually since 2007. Looking at the last ten years, TMUS shined with a return of 21.5% p.a., while VZ remained a poor investment with a return of only 3.4% p.a. on a compounded annual basis.
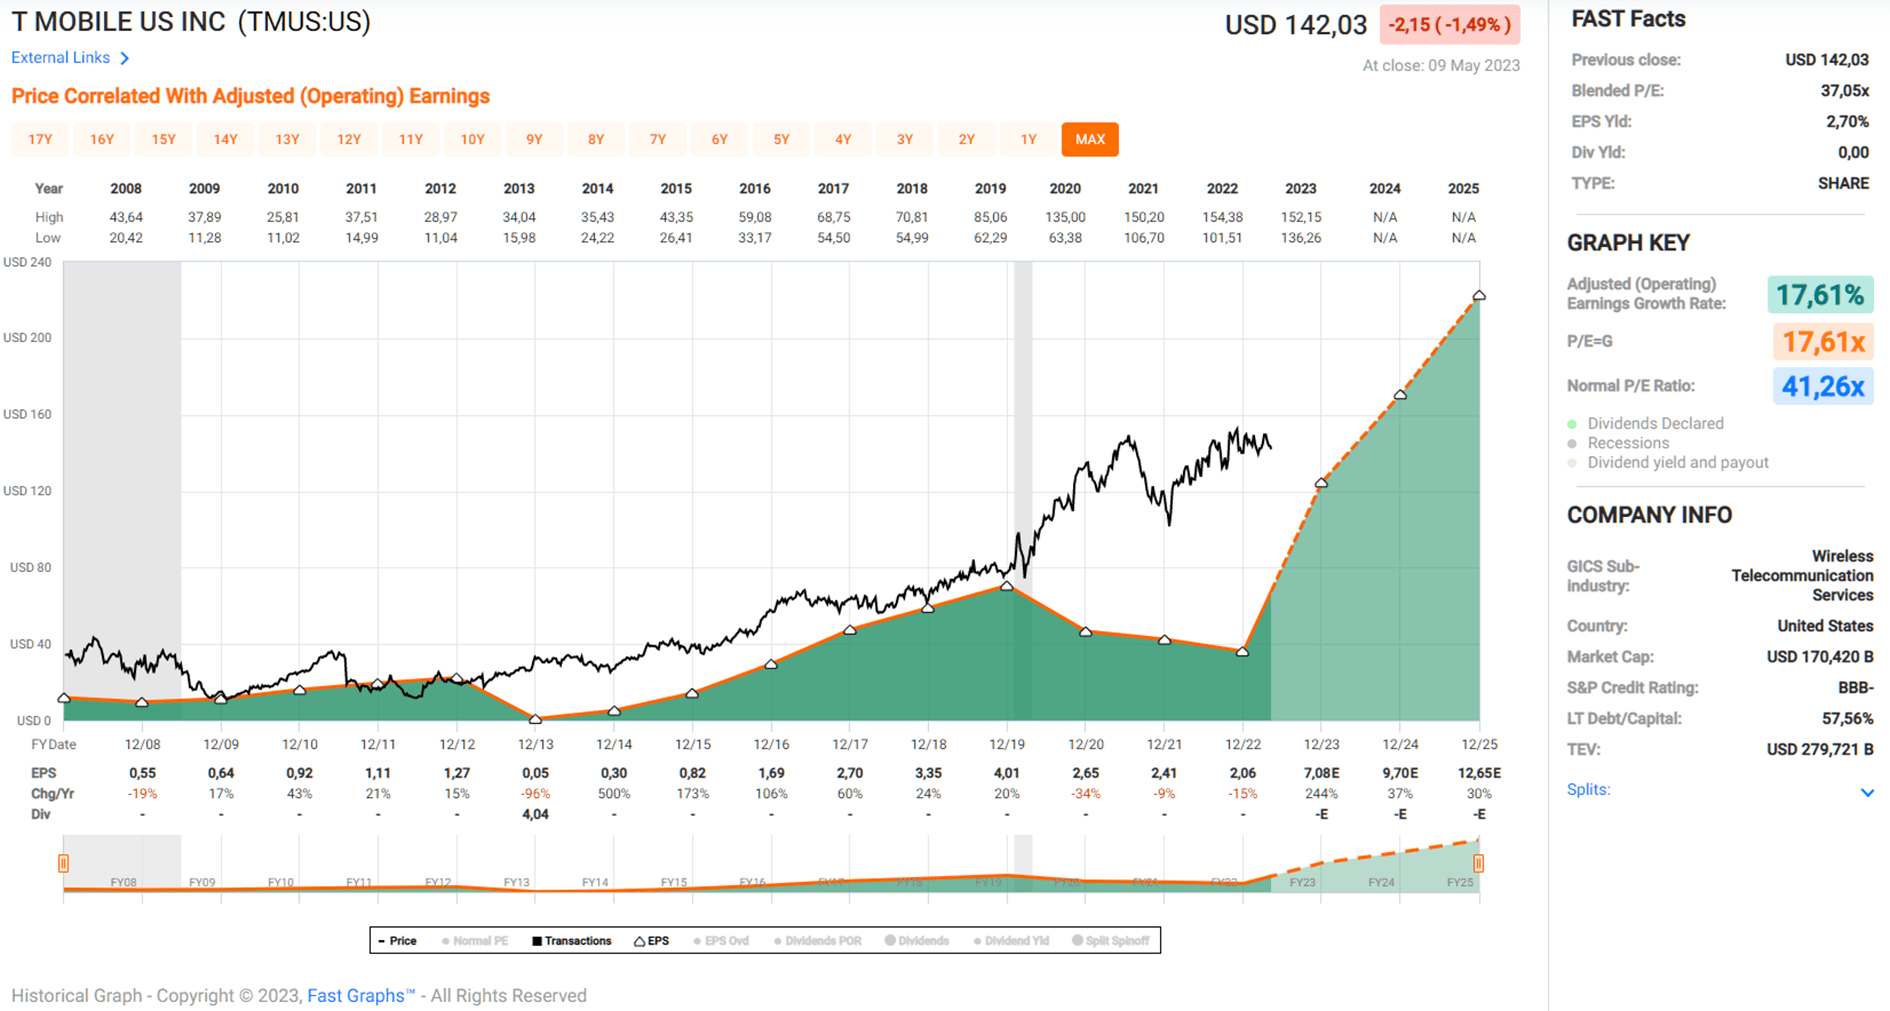
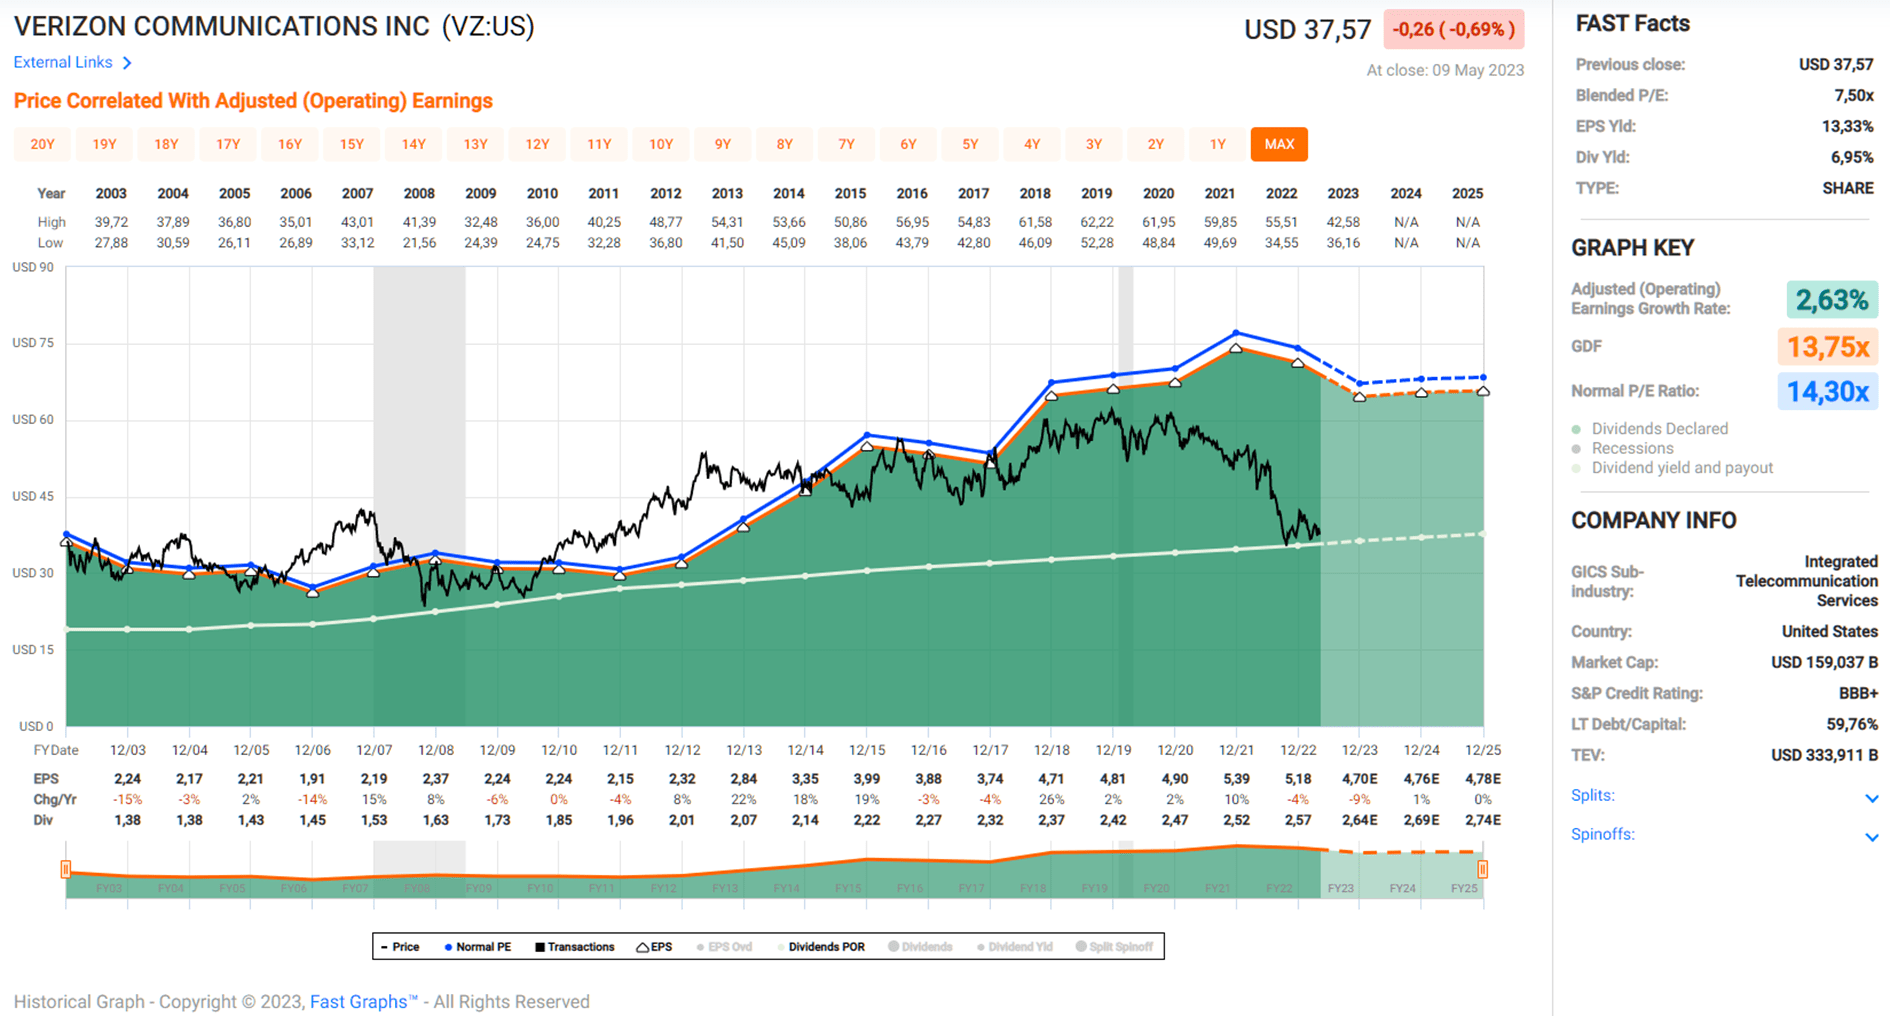
According to FAST Graphs, TMUS and VZ are currently valued at a blended price-to-earnings (P/E) ratio of 37 and 7.5, respectively. Investors have obviously priced in substantial earnings and free cash flow growth at T-Mobile (Figure 7), while they apparently no longer believe in Verizon's comparatively high profitability and leadership position in wireless (Figure 8). Put another way, and looking at 2025 earnings expectations, T-Mobile would be approaching a valuation much closer to Verizon's if both stock prices were to tread water until the end of 2025.
At the risk of sounding conservative, I personally don't think TMUS stock is worth more than a three-year forward P/E ratio of 15. After all, growth is mostly achieved through churn in this largely saturated and commoditized industry. However, a 2025 forward P/E of 15 still represents an annualized rate of return of 11.6%. For Verizon, I think a baseline P/E ratio of 7.5 is overly conservative. I realize there are no near-term upside catalysts, but if the company continues to perform as expected and investors come to the realization that T-Mobile will not displace Verizon, a three-year forward P/E ratio of 10 does not seem an unrealistic expectation. This corresponds to an annualized return of 14%, including dividends.
Figure 7: T-Mobile US [TMUS]: FAST Graphs chart based on adjusted operating earnings per share (obtained with permission from www.fastgraphs.com) Figure 8: Verizon Communications [VZ]: FAST Graphs chart based on adjusted operating earnings per share (obtained with permission from www.fastgraphs.com)
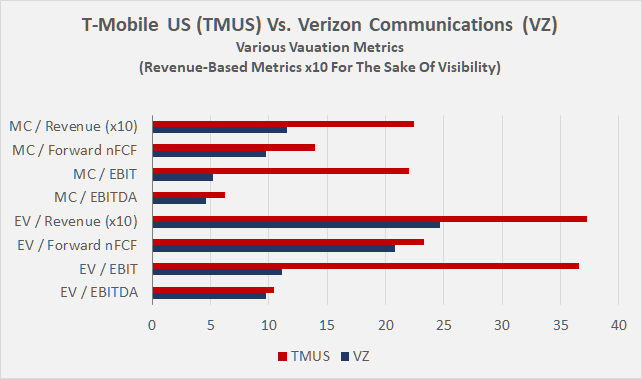
However, since both companies have a debt-focused capital structure, I believe it is important to consider other valuation metrics as well. I realize that some of the metrics shown in Figure 9 are not necessarily meaningful according to textbook standards (e.g., EV to nFCF, with the latter being a shareholder-based cash flow number), but I have included them nonetheless for comparison purposes.
As above, investors are currently trading TMUS stock at a more or less significant premium to VZ stock, largely due to TMUS's expected strong earnings and cash flow growth. However, I think investors are not doing justice to Verizon's still much stronger profitability. Granted, the edge will most likely narrow over time, but I still think the valuation difference is a bit drastic.
Figure 9: T-Mobile US [TMUS] vs. Verizon Communications [VZ]: Various valuation metrics (own work, based on the companies’ 2022 10-Ks, 2022 full-year earnings press releases and analyst estimates according to FAST Graphs)
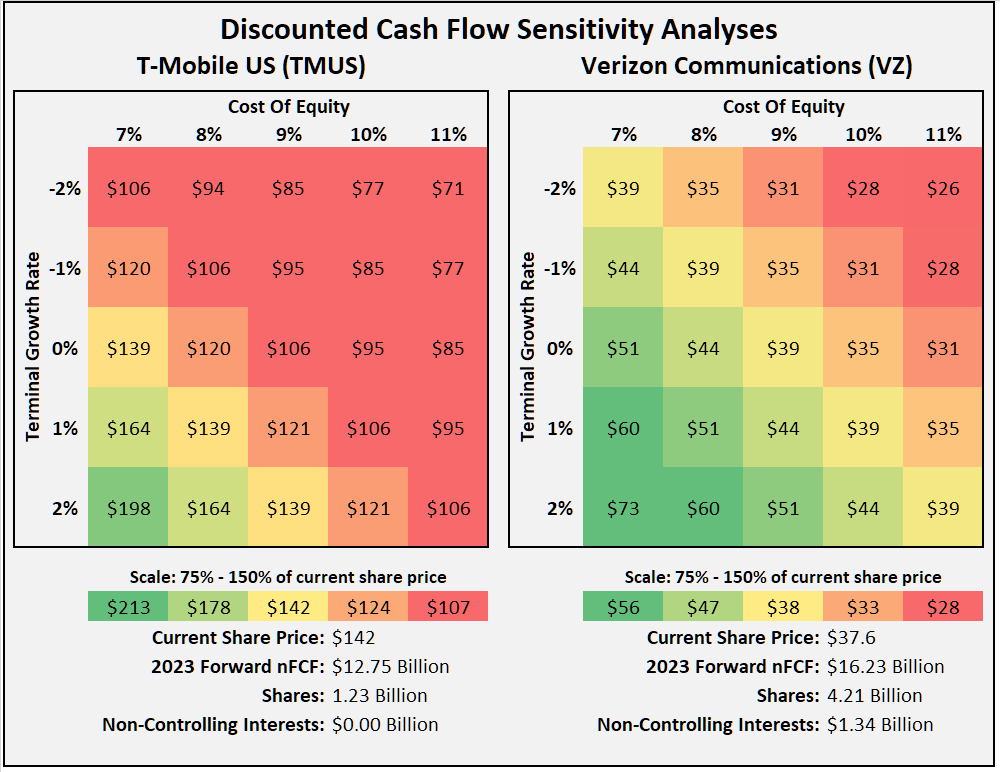
Finally, I believe that the discounted cash flow sensitivity analysis in Figure 10 provides a balanced look at the current valuation of the two stocks. Using both companies' 2023 expected nFCF and assuming investors are content with a 9% cost of equity, TMUS stock would currently be fairly valued if the company is able to grow its free cash flow at a rate of slightly above 2% over time. By comparison, Verizon's cash flow can decline by about 0.5% per year in perpetuity to justify the stock's current valuation. Considering past performance, I don't think Verizon's free cash flow will grow significantly in the future, although it's probably a bit too pessimistic to view the stock as a company in decline. At the same time, I would be careful about assuming a terminal growth rate of over 2% for T-Mobile (although it's certainly not an aggressive assumption). After all, the telecom industry is largely consolidated, saturated, and offers limited room for growth, and TMUS is heavily dependent on third-party infrastructure.
That said, I think it is realistic to expect TMUS' free cash flow to grow over the next few years before leveling off, driven by continued synergies from the Sprint merger and rising ARPU, as well as potentially (temporarily) higher churn from Verizon and AT&T. Overall, I think the uncertainty underlying Verizon's valuation is much lower than T-Mobile's.
Figure 10: T-Mobile US [TMUS] vs. Verizon Communications [VZ]: Discounted cash flow sensitivity analyses (own work, based on the companies’ 2022 10-Ks, 2022 full-year earnings press releases and analyst estimates according to FAST Graphs)
Concluding Remarks
T-Mobile US, Inc. and Verizon Communications Inc. are well-managed companies operating in a largely commoditized and well-consolidated industry. T-Mobile's acquisition of Sprint in 2020 was a smart move, and management has delivered on its promises in spectacular fashion. As a result, I think the future of the telecommunications industry in the US will be a more or less level playing field. Smaller competitors like Dish Network Corporation ( DISH ) are unlikely to be able to take significant market share from the three dominating carriers, which benefit from significant economies of scale. Verizon has invested heavily in its 5G spectrum in 2021, which underscores the capital-intensive nature of the industry and the constant need to invest to stay on the edge of technology.
As a result, the industry as a whole is not particularly rewarding for shareholders. Technology companies such as Microsoft Corporation ( MSFT ), Alphabet Inc. ( GOOG , GOOGL ) and many others are the beneficiaries of infrastructure, while T-Mobile US, Verizon Communications and AT&T do the heavy lifting. As a result, residual returns on invested capital are relatively low at best. Still, Verizon continues to generate healthy ROIC and CROIC due to its leading operating profitability, but T-Mobile is catching up as synergies from the Sprint merger are realized.
Due to the ongoing need to invest in the business, both companies are significantly leveraged and even appear somewhat like utilities, of course with the disadvantage (or advantage in certain contexts) of operating in a largely unregulated environment. The biggest risks lie in their leveraged balance sheets, which are being put to the test in the current interest rate environment. While I don't think a short-term recession will significantly affect Verizon or T-Mobile - after all, telecommunication has become almost as essential as electricity or heating - it is a long-term stagflationary environment that I think will have the most negative impact on the companies. At some point, regulators may intervene, putting shareholder returns at risk.
While T-Mobile U.S. stock is a growth-oriented capital appreciation play, investing in TMUS via Deutsche Telekom AG offers the additional benefit of a tax-advantaged dividend, but of course also carries its own risks.
T-Mobile US, Inc. stock appears overvalued based on current earnings, but I believe it is appropriate to consider forward earnings and cash flow expectations, which put the stock in fair value territory. With this in mind, I don't think management's decision to return significant cash to shareholders through buybacks ($60 billion through 2025) is a bad idea from a capital allocation perspective.
Verizon Communications Inc. stock is priced for stagnation or even a modest decline, which seems conservative given the company's leadership position and still high reliance on leased assets from T-Mobile. At the same time, I'm skeptical of Verizon's efforts in the fixed wireless space, which could lead to expensive price wars and potentially lower shareholder returns going forward. So far, the dividend (current yield of nearly 7%) looks reasonably secure, but cash flow growth - and thus meaningful long-term dividend growth - remains elusive. In a sustained period of stagflation, I can well imagine Verizon having to cut its dividend.
While I concede that the telecom industry is not a particularly rewarding place from a shareholder perspective, it might still make sense to invest a small percentage of the portfolio in slow-growth telecom companies and regulated utilities. I own a small position in VZ stock but don't expect to add to it, although I think the valuation is quite favorable. To paraphrase Peter Lynch - it's important to identify the flowers and the weeds in the portfolio and make sure the flowers are watered regularly while the weeds are cut. While I don't think Verizon stock represents an outright weed, I'll just refrain from watering it and focus instead on the flowers in my garden.
As always, please consider this article only as a first step in your own due diligence. Thank you for taking the time to read my latest article. Whether you agree or disagree with my conclusions, I always welcome your opinion and feedback in the comments below. And if there is anything I should improve or expand on in future articles, drop me a line as well.
For further details see:
T-Mobile Vs. Verizon: Which Is The Better Telecom Stock?