TROW - T. Rowe Approaches Crucial Turning Point Signaling Buy Prospect
2023-09-23 08:23:57 ET
Summary
- T. Rowe Price Group, Inc. achieved notable financial growth in Q2, 2023, with a $57.7 billion increase in assets under management.
- Despite experiencing net outflows, TROW remains optimistic about its long-term future.
- The stock price of TROW has experienced significant volatility, reaching a crucial pivot point.
This article delves into the substantial financial advancements and long-term technical trajectories of T. Rowe Price Group, Inc. ( TROW ). The article explores the economic growth of TROW in the second quarter of 2023, marked by an increment in assets under management ((AUM)) despite experiencing net client outflows. The future perspective for TROW continues to be significantly optimistic in the long term; however, the price adjustment has reached a crucial pivot point. A decline below this point could reverse the optimistic forecast. The appearance of an ascending broadening wedge further underscores the extreme volatility present in the market.
A Deep Dive into Recent Financials
In the second quarter of 2023, TROW manifested remarkable financial advancement , with its quarter-end AUM reaching a monumental $1.40 trillion, reflecting an increment of $57.7 billion. However, the net outflow was $20.0 billion. The company’s financial statements unveiled a diluted earnings per share ((EPS)) of $2.06 and an adjusted diluted EPS of $2.02. TROW continued elevating shareholder value, distributing $323 million, mainly through its regular quarterly dividend. While acknowledging the persistent equity outflows, Rob Sharps, the President, and CEO, emphasized the enhanced results in several critical investment approaches and bolstering equity markets, leading to heightened revenue compared to the first quarter. He asserted achieving meaningful cost efficiencies, maintaining a balance in expense expansion while executing strategic objectives.
Diving deeper into the financial insights, the variations in AUM were varied, spanning different asset categories. TROW preserved a considerable base of international investors, accounting for 8.9% of AUM from those outside the United States. Moreover, the firm broadened its range of services, undertaking participant accounting and plan administration for retirement plans and branching out into non-discretionary advisory services, resulting in assets under advisement of $9 billion as of June 30, 2023.
The revenues for TROW saw a favorable turn, attaining $1.61 billion in Q2 2023, a rise of 6.4% from Q2 2022, primarily attributed to an increase in accrued carried interest in Q2 2023. Nonetheless, this ascent was somewhat neutralized by a decline in investment advisory fee revenue due to diminished market levels and net outflows impacting the average AUM. The chart below illustrates the total revenue for TROW, demonstrating the company's long-term profitability with a noticeable turnaround in revenue starting in 2023.
Reviewing the income generated through capital allocation in Q2 2023, it included $38.7 million, including additional accrued carried interest of $51.0 million, balanced by $12.3 million in non-cash acquisition-related amortization. In comparison, Q2 2022 saw a downturn in net revenues by $126.3 million due to market-based reductions and non-cash amortization. A segment of the income from capital allocation was allocated to compensation, with the unpaid amount classified as non-controlling interest on the consolidated balance sheet.
The operational expenditures for TROW soared to $1,076.7 million, indicating a 27.5% surge relative to Q2 2022 and a modest 2.2% increment compared to Q1 2023. Analyzed on a non-GAAP basis, the adjusted operational expenditures amounted to $1,026.2 million, showing an 8.3% uplift from Q2 2022 and a negligible 0.4% increase relative to Q1 2023. The rise in adjusted operational expenses in Q2 2023 primarily originated from increased accrued carried interest-related compensation.
Exploring Long-Term Technical Trajectories
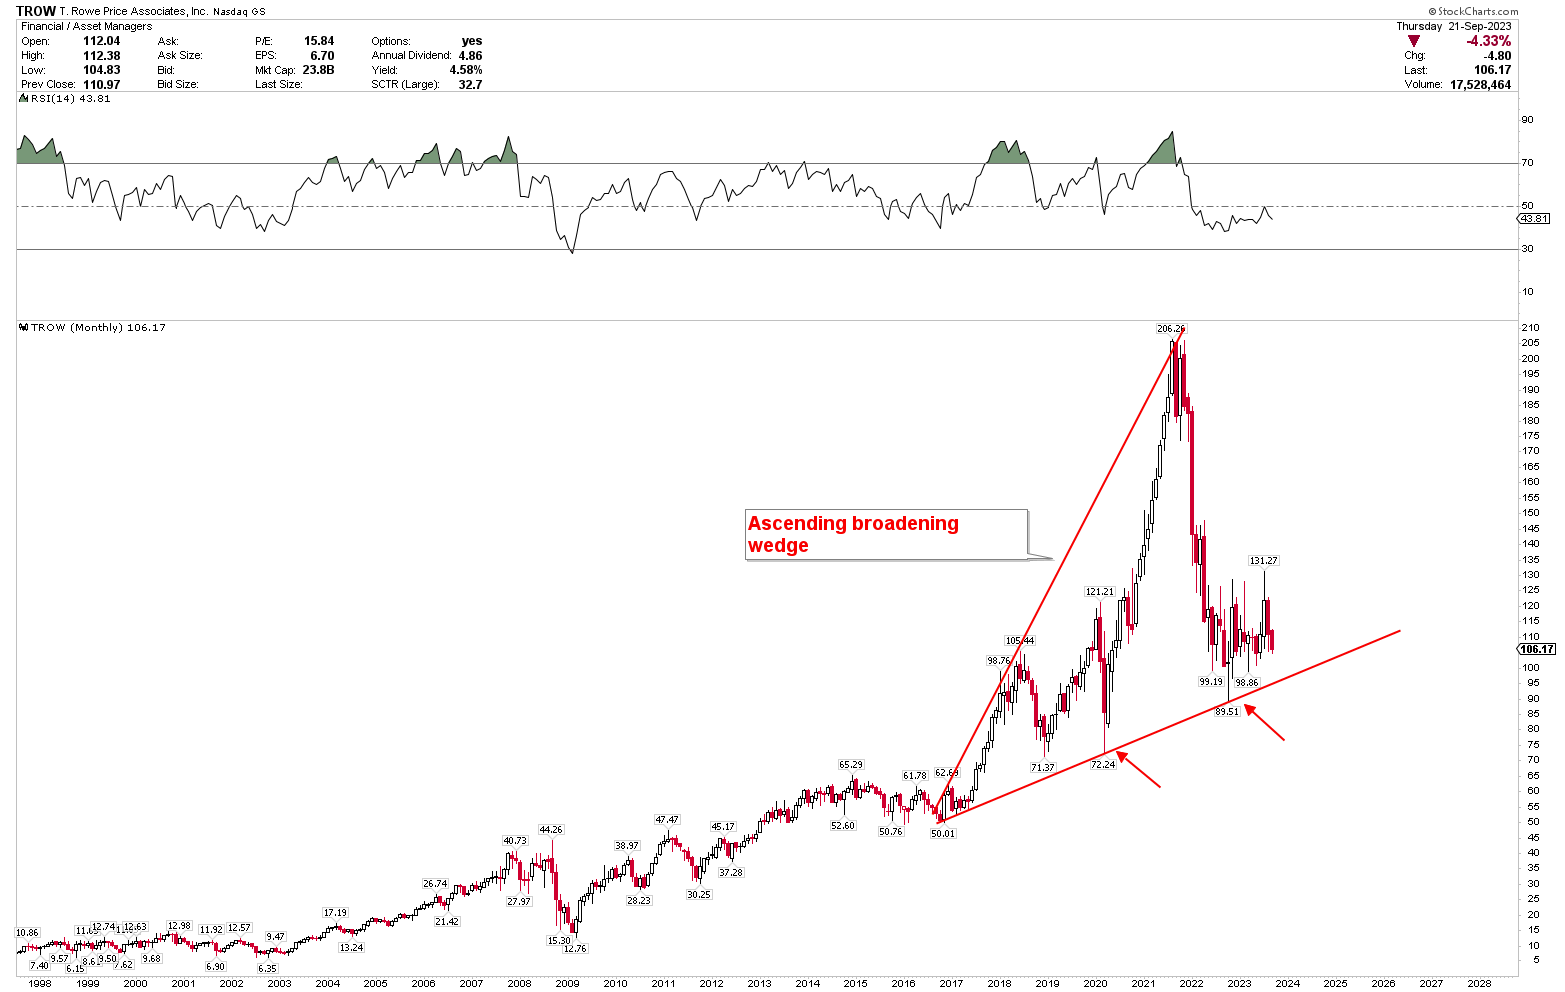
The long-term technical outlook for TROW is strongly bullish, as seen in the monthly chart below. The stock price of TROW has showcased a remarkable surge of 1516.46%, escalating from a 2009 low of $12.76 to an all-time high of $206.26. This substantial rise was mainly propelled from 2017 to 2021, primarily attributed to the firm's impressive financial stride, prudent investment management strategies, and advantageous market circumstances.
TROW Monthly Chart (stockcharts.com)
During this timeframe, TROW capitalized on a thriving stock market, experiencing an expansion in AUM, subsequently catalyzing a rise in revenues through investment advisory fees. The organization’s unwavering capability to surpass its contemporaries, emphasis on diversification of investment portfolios, and allegiance to shareholder value through dividends and stock buybacks have played pivotal roles in the stock value appreciation. Moreover, the overall supportive macroeconomic climate and investment sentiment in the specified period bolstered higher valuations for asset management entities like TROW. This mirrors a fortified market stance and heightened investor trust in its growth trajectory.
However, the stock price was corrected from the high of $206.26, descending to support an ascending broadening wedge at $89.51. This abrupt decline also breached the RSI below the median level of 50, signaling reduced chances of a rapid recovery. The current consolidation of prices at these low levels may hint at forming a new base. Nevertheless, the monthly candles of August and September 2023 manifest bearish tendencies, suggesting potential volatility at these levels.
Pinpointing Key Levels and Strategic Moves for Investors
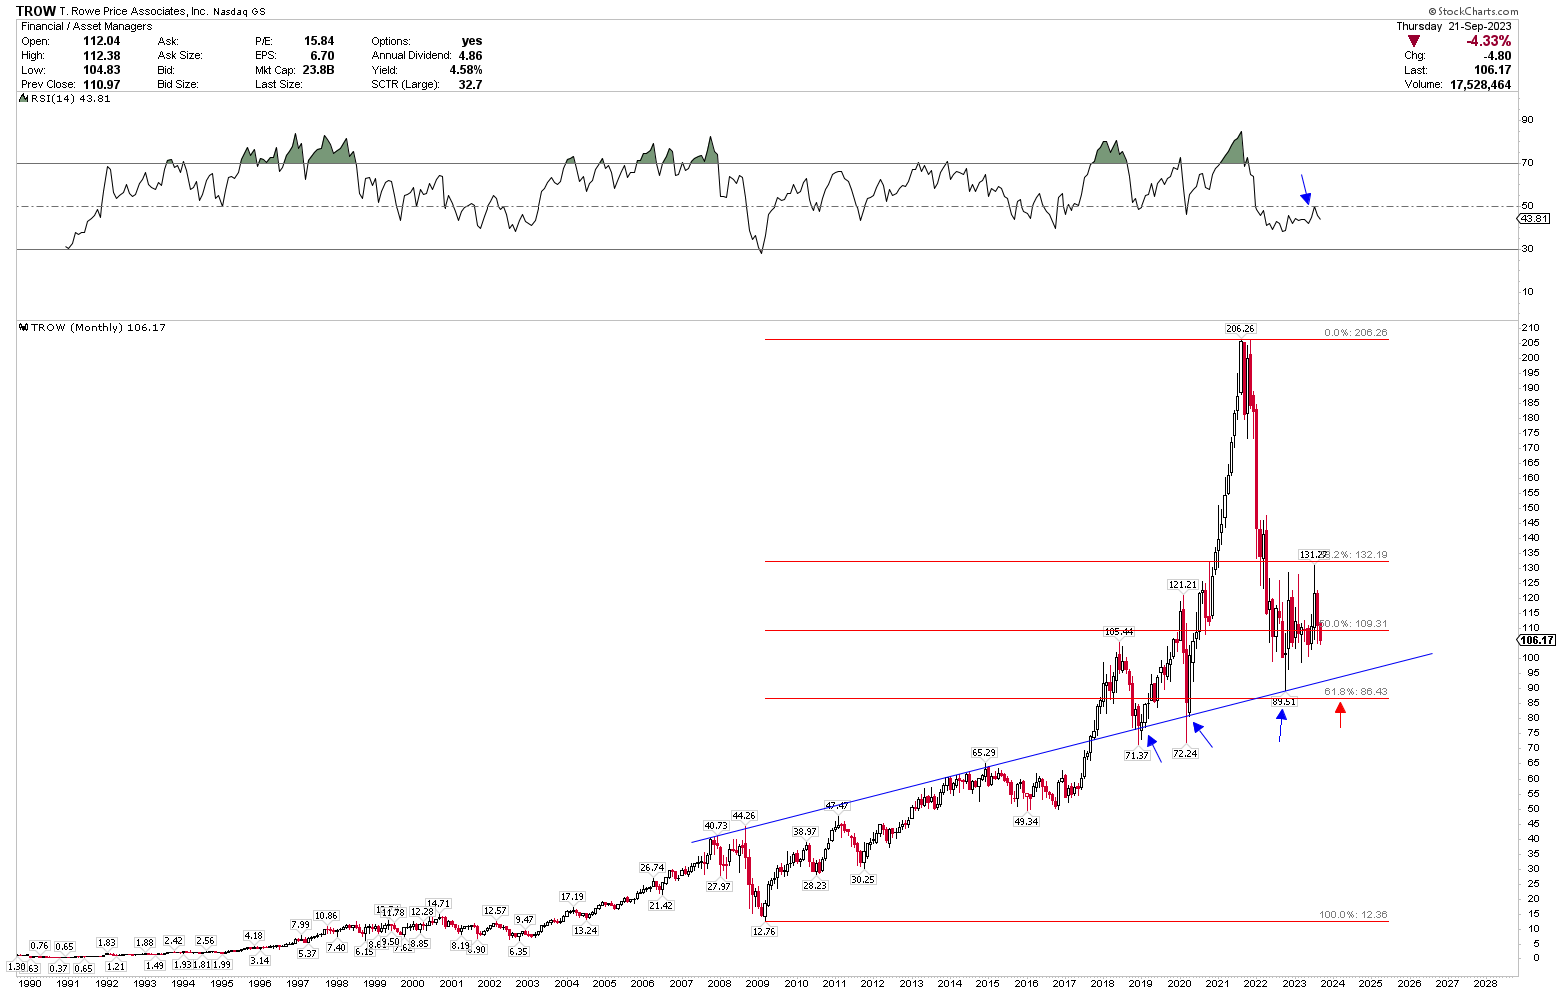
To gain a deeper insight into the uptrend in the stock price of TROW, a Fibonacci retracement from the 2009 low of $12.76 to the high of $206.26 indicates that the price is currently establishing robust support at the 61.8% retracement of this progression. This support has stabilized the market over the last few months. Notably, the blue trend line also corroborates the 61.8% retracement level, reinforcing this as a pivotal point for enduring support. Nevertheless, the resurgence in July 2023 capped at $131.27, encountering resistance at the mid-level of 50. A decline below $89.51 will disrupt the substantial support restricted by the ascending broadening wedge, the blue trend line, and the 61.8% Fibonacci level. Hence, investors might deem this level crucial for TROW's subsequent trajectory.
TROW Monthly Chart (stockcharts.com)
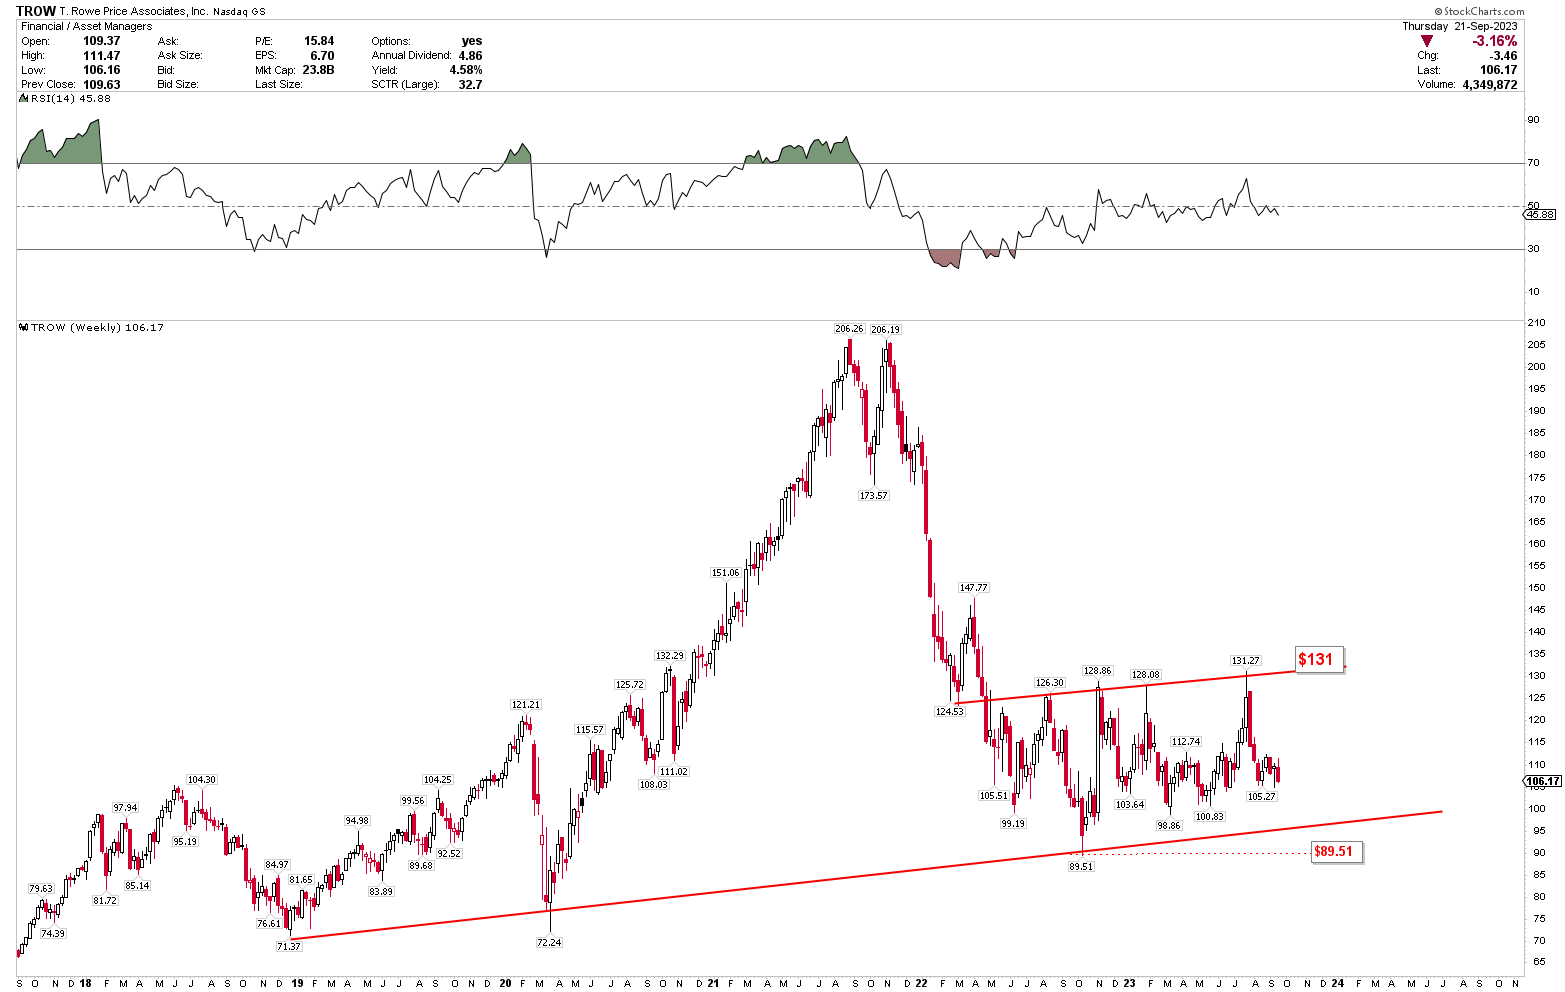
To further elucidate the potent bullish perspective for TROW, the weekly chart below illustrates the red trendline, indicating the breakout level of $89.51. This trendline safeguards TROW’s upward trajectory, and its parallel trend line at $131 preserves the upward momentum. A break above $131 will propel the bullish momentum, whereas falling below $89.51 will negate the bullish configuration and trigger a significant downward shift.
TROW Weekly Chart (stockcharts.com)
Investors may await more favorable conditions to acquire TROW at low values. Given the significance of the $89 level, investors may consider buying TROW at its current levels and increase positions should the price experience further decline as the long-term trend continues to exhibit an upward trajectory. The bullish momentum will only be confirmed with a break above $131.
Market Risk
The stock price volatility is a significant concern for TROW, with the stock experiencing a substantial correction, plunging from a peak of $206.26 to $89.51. This volatility and the prevailing bearish tendencies pose risks to investors and can tarnish the market perception of the company. The highly competitive nature of the asset management sector raises questions about TROW's ability to maintain and expand its AUM and market share, mainly if competitors provide more appealing investment options or fee structures. Any execution risk connected to the strategic initiatives undertaken by TROW’s management could also profoundly impact the operational and financial performance of the company, especially if the initiatives fail to produce the expected results.
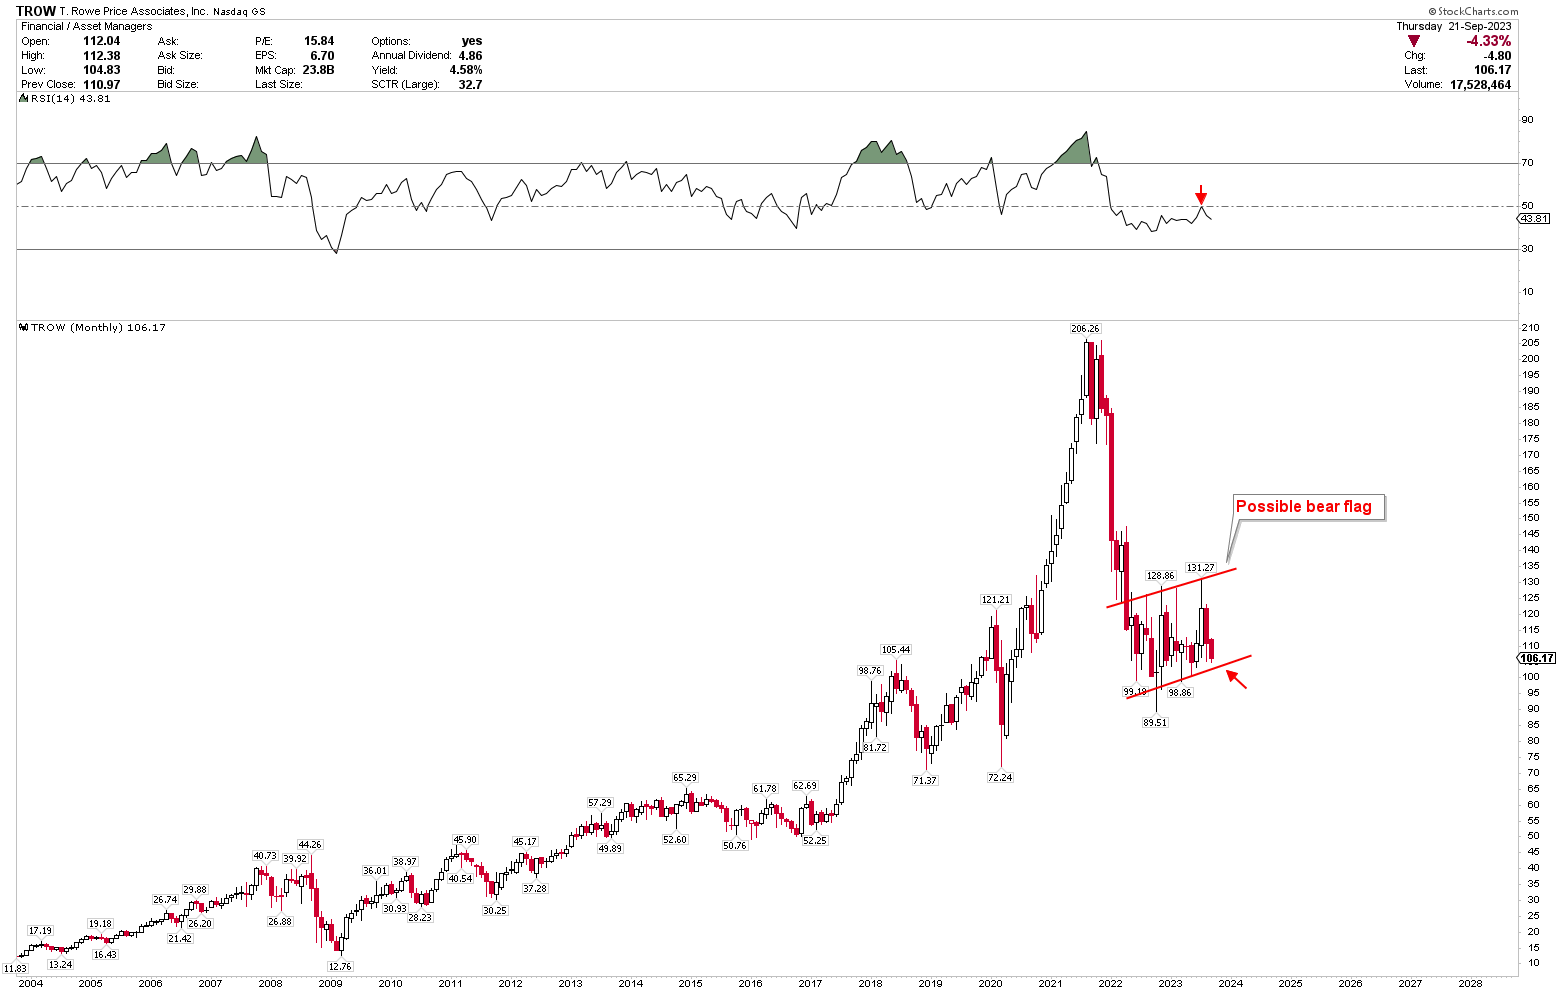
The monthly chart below illustrates the formation of a bear flag, which will be triggered if the stock price falls below $89. A breach of this level will also disrupt the ascending broadening wedge and compromise the support provided by the 61.8% Fibonacci retracement. Consequently, close monitoring of this level is crucial.
TROW Monthly Chart (stockcharts.com)
Bottom Line
In conclusion, this detailed examination of TROW has revealed intricate insights into the company’s significant financial progress and long-term technical trends. The company, through strategic maneuvers and resilient financial frameworks, has showcased admirable growth and robust financial health in Q2 2023 despite experiencing significant net outflows and stock price volatility. TROW's strategic initiatives, commitment to diversified service offerings, and enhanced performance in key investment strategies underscore its capability to navigate variable market conditions. The detailed exploration into the company’s incremental AUM, international investor engagement, and shareholder value enhancement reveals a balanced interplay of increased earnings and operating expenses, elucidating TROW’s consistent growth trajectory and fortified market presence.
However, the future beholds inherent risks and uncertainties; the company’s sustained performance and elevated market position can be compromised due to potential shifts in client preferences, intense competition in the asset management sector, and any missteps in strategic execution. The significant stock price corrections in 2022 and prevailing bearish tendencies bring forth concerns regarding market perception and investor risks. For prospective investors and stakeholders, meticulous attention and a sophisticated grasp of market trends and optimal investment points are crucial. This guarantees informed choices in fluctuating market situations and changing fiscal environments. Given that the price is presently at a robust pivot point of $89, there is a high likelihood of a significant rebound from this support level. Therefore, investors may consider buying the stock around this price level.
For further details see:
T. Rowe Approaches Crucial Turning Point Signaling Buy Prospect