TROW - T. Rowe Price: Hold This Stock For Solid Dividend Yield
2023-11-26 07:53:55 ET
Summary
- The company reported revenue of $1.67 billion in Q3FY23 which is a 5.2% rise compared to $1.59 billion in Q3FY22.
- Considering the high dividend yield of 4.98% and consistent dividend payment ability, I believe it is an attractive dividend-earning opportunity for risk-averse investors.
- The company's forward P/E ratio of 14.34x is higher than the sector median of 9.63x which indicates that TROW is overvalued at current share price.
Investment Thesis
T. Rowe Price ( TROW ) is an asset management company that specializes in retirement services. The company has recently announced its Q3FY23 result. I will be discussing Trow's financial results, the company’s ability to pay dividend yield, and its valuation at the current share price.
About TROW
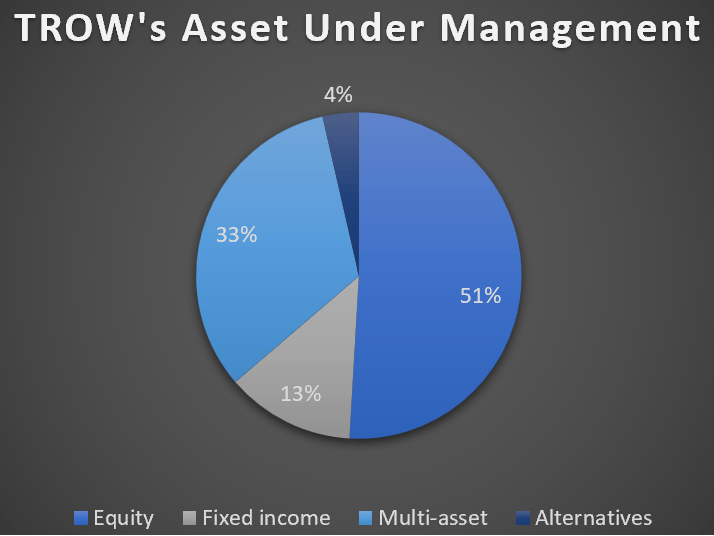
TROW is an asset management company that deals in offering global investment management and retirement services. It provides various services for individuals, advisors, institutions, and retirement plan sponsors, including commingled funds, sub-advisory services, separate account management, collective investment trusts, and retirement recordkeeping. The company has five distribution channels: Americas financial intermediaries, European and Asian financial intermediaries, U.S Investors on a direct basis and global institutions, and U.S retirement plan sponsors. Investors outside the United States accounted for 9% of total assets under management. The company manages $1.31 trillion of assets , including $668 billion of equity, and $168 billion of fixed income. It also manages $429 billion of multi-asset and $47 billion of alternative investment. The company generates its revenue through Investment advisory fees and Administrative, Distribution, and Servicing fees. The Investment advisory fees contribute 91.23% to the total net revenues and Administrative, Distribution, and Servicing fees generate 8.77% of the company’s total net revenue.
TROW's AUM Composition (Value Quest)
Financial
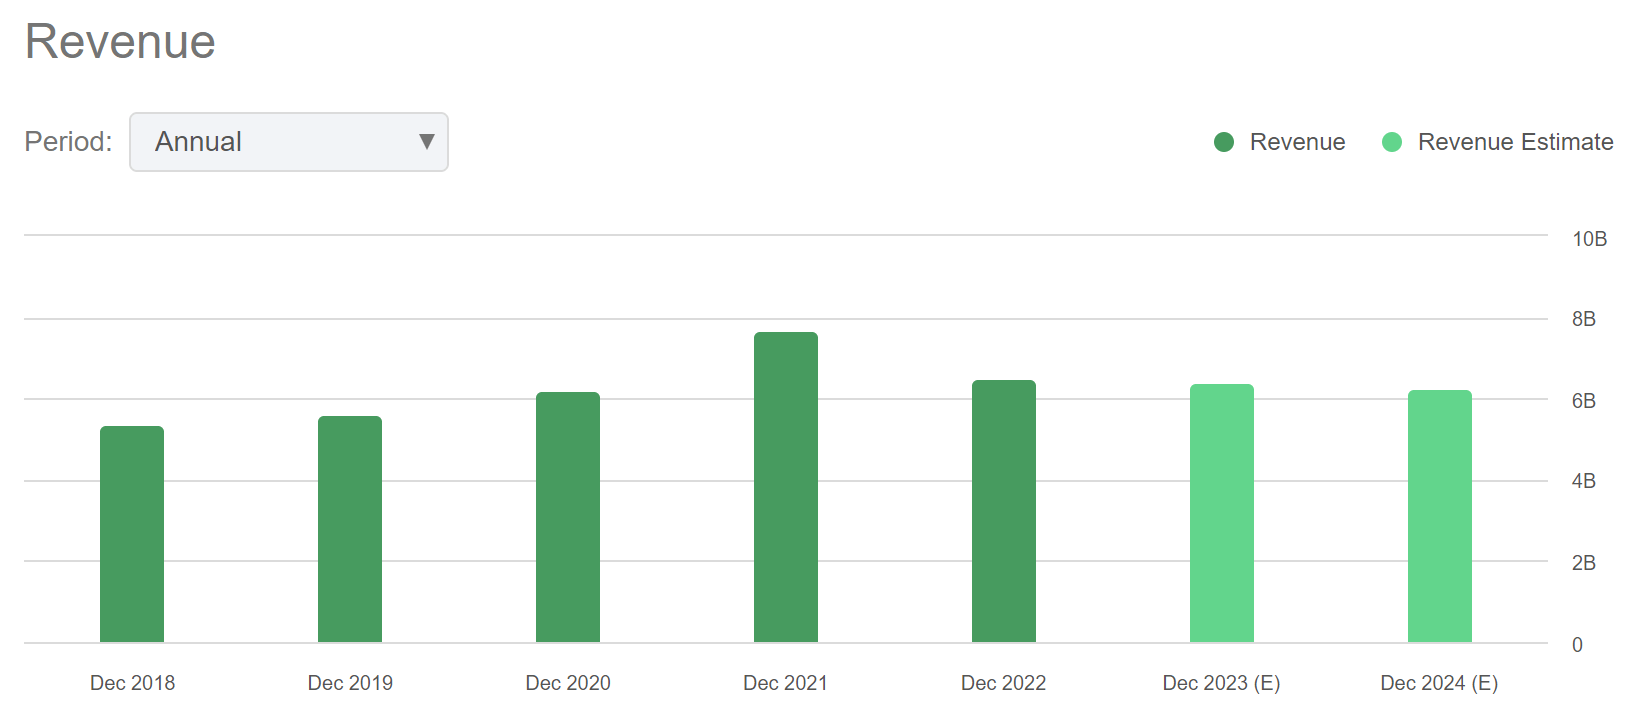
Revenue Trend of TROW (Seeking Alpha)
TROW has seen fluctuating revenue in the last 3 years. The company has earned a revenue of $7.67 billion in FY2021 which is a 23.5% growth compared to $6.21 billion in FY2020. This growth in FY2021 was fueled by market appreciation increasing the company’s average AUM. It ended FY2021 with $1.69 billion AUM. The growth in FY2021 was offset by new COVID variance, less accommodative monetary policy, and rising expenses due to increasing inflation. The company failed to maintain this revenue growth in FY2022. It reported a revenue of $6.49 billion which is a 15.38% decline compared to revenue of FY2021. US mutual and sub-advised fund’s equities & multi-asset segments were major contributors to revenue decline of FY2022. It ended FY2022 with $1.27 billion AUM.
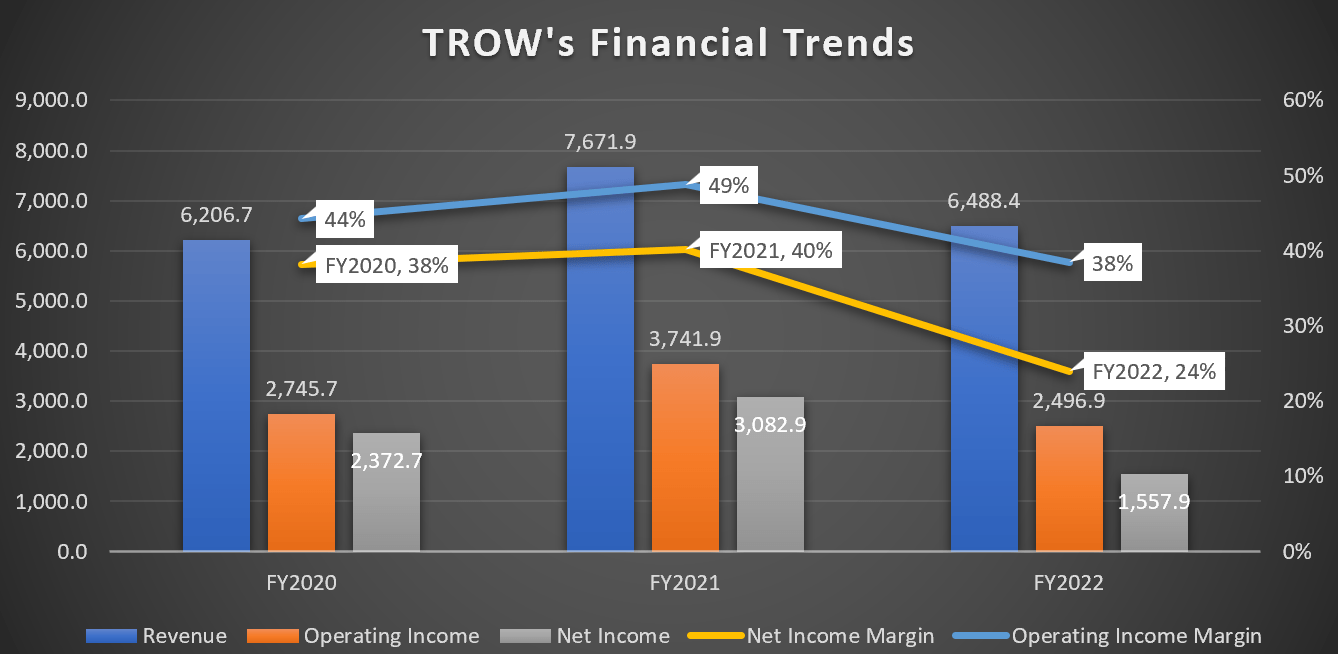
TROW's Financial Trends (Value Quest)
We can observe in the above chart the operational income margin (OIM) and net income margin ((NIM)) have experienced a fluctuating trend like revenue in last three years. TROW’s OIM expanded by 500 bps while its NIM increased by 200 bps in FY2021 compared to OIM (44%) and NIM (38%), respectively in FY2020. The increase in OIM and NIM of FY2021 was driven by the rise in revenue. The company experienced a significant decrease in OIM and NIM in FY2022 due to a decrease in revenue, a rise in SG&A expense, and rising inflation. In FY2022, its OIM and NIM were 38% and 24%, respectively. As compared to OIM and NIM of FY2021, the company experienced a contraction of 1100 bps and 1600 bps, respectively.
Recently, TROW reported its quarterly financial results . The company reported revenue of $1.67 billion in Q3FY23 which is a 5.2% rise compared to $1.59 billion in Q3FY22. This boost in revenue is result of rise in accrued carried interest and investment advisory fees. The average AUM of TROW has increased by 3.4% from $1.35 billion to $1.39 billion. The company’s operating income in Q3FY23 was $581.3 million which is 1.2% YoY growth compared to $574.6 million in the same period of last year. The operating income growth was fueled by lower S&GA costs partially offset by higher salaries, technology & facility costs and accrued carried interest-related compensation. It reported a net income of $453.2 million which is a 17.9% growth compared to $384.4 million in Q3FY22. The increased net income has resulted in EPS of $1.97. The company ended Q3FY23 with $2.58 billion and $2.53 billion in cash & cash equivalent and investments, respectively.
Seeking Alpha predicts that TROW’s revenue for FY2023 and FY2024 might be $6.45 billion and $6.40 billion, respectively. Inflation has slowed down with the help of rising interest rates. However, the inflation is significantly high compared to historical inflation data. According to Blerina Uruçi, Chief U.S. Economist , the market might experience a few interest rate cuts in coming time which I believe can lead to slight financial market appreciation compared to 2023. After considering the prediction of Chief U.S. Economist and Q3FY23 result, I believe the company can maintain its AUM in a similar range of FY2022 in FY2024 which can result in investment advisory fees in a similar range of FY2022. Therefore, I believe Seeking Alpha’s revenue forecast is accurate. The company’s net income margin in FY2022 was 24%. The market conditions such as inflation rate and interest rates are same as the FY2022 and might remain the same due to inflation is still quite high compared to historical inflation data. That is why, I am considering the net income margin of 24% for FY2024 which gives the EPS $6.83.
Dividend Yield
The company has an impressive and long track record of consistent dividend growth which signals its well-positioning in the market. In the previous fiscal year, it distributed a cash dividend of $1.22 in each of the four quarters, which makes the total annual dividend $4.88, representing a dividend yield of 4.98% compared current share price ($98). The company has paid a $269.99 million dividend to its investors last quarter. The company has managed to achieve significantly higher net income in the last eleven quarters compared to its last dividend payment ($269.99 million) which shows that it has the ability to pay dividends in the coming period even though it faces downward pressure due to market conditions. TROW’s dividend yield of 4.98% is 31.7% higher than the sector median dividend yield of 3.78%. The company's key competitors are State Street Corporation ( STT ), Blue Owl Capital ( OWL ), Northern Trust ( NTRS ), Franklin Resources ( BEN ), Carlyle Group ( CG ) as all of them has similar business and market capitalization. The company’s dividend yield is 13.4% higher than average dividend yield (4.27%) its key competitors ( STT , OWL , NTRS , BEN , CG ). Considering the high dividend yield of 4.98% and consistent dividend payment ability, I believe it is an attractive dividend-earning opportunity for yield-hungry and risk-averse investors.
What are the Main Risk Faced by TROW?
Risk of contracts with collective investment funds
Most of the company’s revenue comes from collective investment funds, which are contract-based and can be terminated on short notice without any cause. The Board of each T. Rowe Price U.S mutual fund must approve the investment management agreement every year. If T. Rowe Price's collective investments fund lowers the company’s fees or terminates its contract with the company, it would experience a reduction in the fees it receives from collective investment funds, which would adversely affect its revenue and net income.
Fluctuations in external factors
The company’s revenue highly depends on the market value and composition of its asset under management which can fluctuate by various factors outside the company’s control. These factors include Investment performance, general financial market declines, Investment concentration, Investor mobility, capacity constraints, investing trends, interest rate changes, and geopolitical exposure. If the value of assets under management decreases due to any of the above factors, it can reduce the company’s revenues by further contracting its profit margins.
Valuation
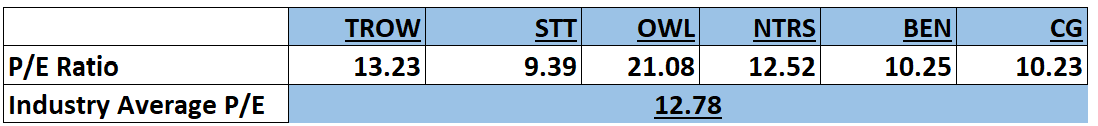
TROW has recently reported Q3FY23 financial result. The company has reported solid report however, market conditions such as uncertainty of interest rates and inflation can force AUM and investment advisory fees to remain stagnant. Considering all above factors and estimate calculation in the finance section of this report, I am estimating EPS of $6.83 for FY2023 which gives the forward P/E ratio of 14.34x, considering current share price of $98. The company's forward P/E ratio of 14.34x is higher than sector median of 9.63x which shows that TROW is overvalued at current share price. Even after comparing forward P/E ratio of TROW with its industry average P/E ratio of 12.78x, the company turned out to be overvalued at current share price.
Industry Average P/E ratio Calculation (Value Quest)
Conclusion
T. Rowe is an asset management company dealing in retirement services. The company has reported solid quarterly results. It is exposed to the risk of termination of contracts on short notice which can decline its revenues. The company’s AUM and investment advisory revenue might remain stagnant due to the uncertainty of inflation and interest rates. The stock is overvalued at current share price however the company’s ability to pay higher dividend than its key competitors, makes it attractive option for investors who are expecting a solid dividend yield. Considering all these factors I assign a hold rating to TROW.
For further details see:
T. Rowe Price: Hold This Stock For Solid Dividend Yield