TAN - TAN: Best Renewable Electricity ETF
2023-07-12 00:57:15 ET
Summary
- We conducted a comprehensive analysis and comparison of three ETFs (TAN, QCLN, and ICLN) to determine the best Renewable ETF.
- The assessment examined the catalysts driving the growth of Renewable Electricity and explored the applications within Clean Energy and Sustainability across different industries.
- We also evaluated their portfolio breakdowns and exposures to leading industries.
- Factors considered included percentage of application, valuations, margins, demand drivers, quantitative scores, AUM, and average spread.
In this analysis, we conducted a thorough analysis and comparison of three ETFs, namely TAN ( TAN ), QCLN ( QCLN ), and ICLN ( ICLN ), to ascertain the optimal Renewable ETF for investment, considering a minimum Asset Under Management ('AUM') of over $500 mln. Initially, we examined the catalysts propelling the expansion of Renewable Electricity. Furthermore, we delved into the various applications within Clean Energy and Sustainability, meticulously dissecting them across different industries. Lastly, we analyzed the top three ETFs, evaluating their appropriateness by assessing the alignment of their portfolio breakdowns and exposures with the leading industries. This assessment encompassed an amalgamation of factors, including the percentage of application, growth prospects, free cash flow ('FCF') margins, valuation, multifactor score model, demand drivers, and quantitative metrics such as quantitative scores, AUM, and average spread.
Growth Drivers of Renewables
In this section, we first identified and examined the growth drivers of Renewables Electricity below which include regulatory policies, government subsidies and incentives, increasing energy efficiency and decreasing costs.
Government-Imposed Regulatory Policies
Biofuels include ethanol and biodiesel which are biomass converted to liquid fuel for various applications including transportation fuel and electricity generation . In the US, the government has long implemented biofuel mandates for the transportation industry. The US Energy Policy Act of 2005 set the amount of biofuel that must be mixed with gasoline at 4 bln gallons by 2006 and was further increased to 36 bln gallons by 2022 at a CAGR of 14.7%. Furthermore, the EPA proposed to increase the biofuel mandate by 3.4% in 2023 and 13.7% in 2024 followed by a 12.2% increase by 2025 which is a 3-year average of 9.8%. Thus, we believe the increase in biofuel mandates could benefit the biofuel companies in the Oil, Gas & Consumable Fuels industry.
In terms of renewable energy targets , 165 countries have targets to increase renewable energy use while more than 600 cities worldwide have 100% renewable energy targets. According to the US EIA , “Renewable portfolio standards ((RPS)), also referred to as renewable electricity standards ((RES)), are policies designed to increase the use of renewable energy sources for electricity generation”. 24 US states have adopted RPS and state legislations with varying targets and deadlines for clean energy such as California, New York and Washington. For example, in New York , the “CLCPA codifies a number of ambitious electric sector targets” and specific targets include 70% of the state electricity “must come from renewable energy by 2030” as well additional offshore wind and solar energy projects to be installed by 2025. Therefore, we believe the renewable energy targets could directly benefit the Independent Power and Renewable Electricity Producers industries.
In the automotive market, according to Energy Intelligence , “ICE bans are gathering pace with recent announcements made in US states and many countries around the world”. For example, New York has implemented legislation to phase out ICE vehicles by 2035 as well as California. Additionally in Europe, "the EU will officially ban the sale of new passenger cars and vans using internal combustion engines ('ICE') from 2035" according to Energy Intelligence .
We expect these ICE bans could benefit EV producers in the Automobile industry. However, we believe there the net benefit to the automobile industry is neutral as it only represents a shift from ICE towards EVs. Also, global vehicle sales declined by 1.4% in 2022 despite EVs growing by 55%. According to the IEA, EV sales grew at a CAGR of 51.8% from 2015 to 10.2 mln units in 2022. Deloitte projected EV sales to grow at a 29% CAGR through 2030. Moreover, EVs are powered from various energy sources depending on how the local power is generated such as “natural gas, coal, nuclear energy, wind energy, hydropower, and solar energy” in the US , this is in comparison with ICE vehicles which are fueled with oil (gasoline or diesel) instead of electricity, thus we believe that although EVs will spur the electricity demand compared to ICE, it could benefit most of the electricity generation companies as a whole and is not limited to the Independent Power and Renewable Electricity Producers industries but also the Electric Utilities industry.
Government Subsidies and Incentives
According to the World Resources Institute , “renewable energy tax credits and subsidies, feed-in tariffs, and competitive auctions have all helped reduce costs and spur deployment”.
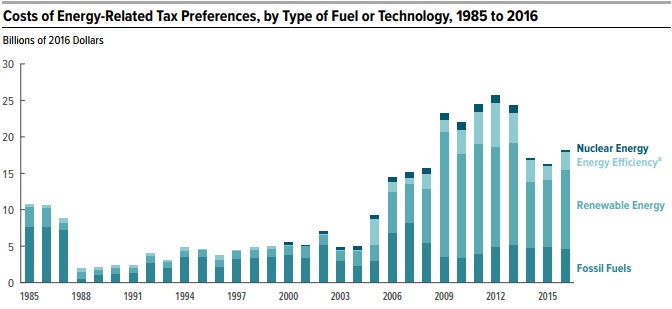
Congressional Budget Office
Based on the chart above from the Congressional Budget Office of the tax preferences for energy, the chart shows an increasing trend of incentives for renewable electricity since 1985 but had plateaued in the past decade since 2009 and the value of incentives in 2016 is around $11 bln compared to $5.6 bln in 2006 at a CAGR of 6.9%. In 2022, the Inflation Reduction Act was passed and contained several benefits for the renewables industry. Among the key points related to renewables is that the Act provides tax incentives worth a total of $259 bln for 9 years from 2023 through 2032 . Assuming a CAGR of 6.9% for tax incentives until 2022, we calculated an average forward growth of 7.2% to reach $32.7 bln by 2032 and a total amount of $259 in tax incentives during the period. Thus, we believe this highlights the growth in tax incentives for renewable energy which could bode well for the growth of the Renewable Electricity industry. Overall, we believe this could benefit the Independent Power and Renewable Electricity Producers industry in the US with the higher tax incentives from the Inflation Reduction Act.
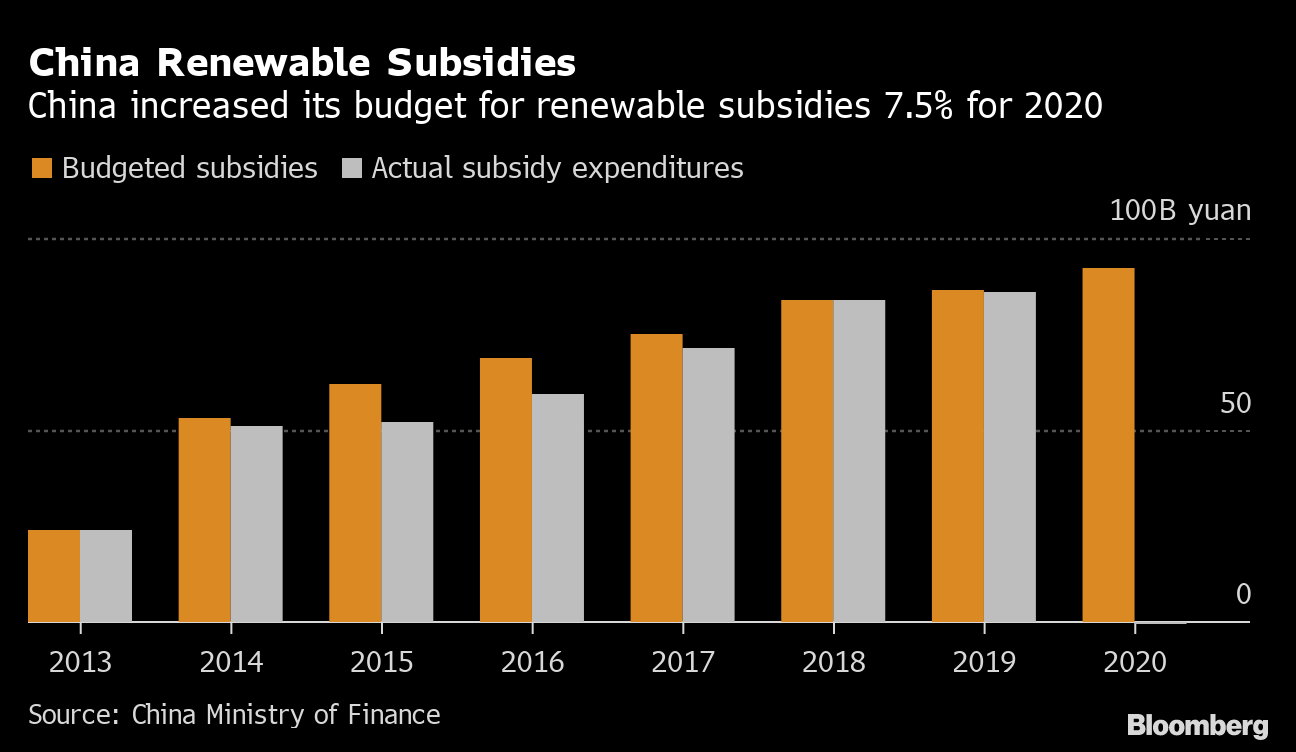
Bloomberg, China Ministry of Finance
| China Subsidies for Renewables (CNY bln) |
| 2013 |
| 2014 |
| 2015 |
| 2016 |
| 2017 |
| 2018 |
| 2019 |
| 2020 |
| Average |
| China Subsidies for Renewables |
| 24.26 |
| 50.85 |
| 52.13 |
| 59.36 |
| 71.06 |
| 83.86 |
| 85.77 |
| 92.36 |
| Growth % |
| 109.6% |
| 2.5% |
| 13.9% |
| 19.7% |
| 18.0% |
| 2.3% |
| 7.7% |
| 24.8% |
Source: Bloomberg , China Ministry of Finance, Khaveen Investments
According to the World Resources Institute, “China provides credit for solar manufacturers and implements nationwide solar feed-in tariffs and subsidies”. Based on the chart above from Bloomberg, China’s subsidy for renewable power subsidies had been on an increasing trend but its growth appears to have stagnated in 2019 based on our estimates at only 2.3% for its actual subsidies compared to an average of 27.7%. According to S&P Global, the Chinese government was halting subsidies for renewable electricity including solar and wind. Furthermore, “the subsidies have been halted because these projects have developed rapidly, become cheap and can compete head-on with coal-fired electricity”. Thus, we believe there will be minimal growth for Chinese subsidies for renewable energy going forward.
Furthermore, the introduction of a new tax credit for low-emission hydrogen production could be beneficial for decarbonizing sectors such as “shipping, aviation, trucking, fertilizer production, steelmaking, and chemical manufacturing”. This credit would immediately reduce the cost of producing low-carbon hydrogen, making it competitive with carbon-intensive methods like unabated natural gas production. According to RMI , “the tax credit can pay out as much as $3 per kilogram of clean hydrogen produced over ten years, awarding projects developed as late as January 1, 2033”. We believe this tax credit for low-emission hydrogen could benefit low-emission hydrogen companies in the Oil, Gas & Consumable Fuels and Energy Equipment & Services industries.
Increasing Efficiency
LaFayette
The chart above shows "the average PV system efficiency" which had been on an increasing trend over the past 25 years by LaFayette. Based on the chart, the average efficiency has increased from 10% to 18% from 1995 to 2020.
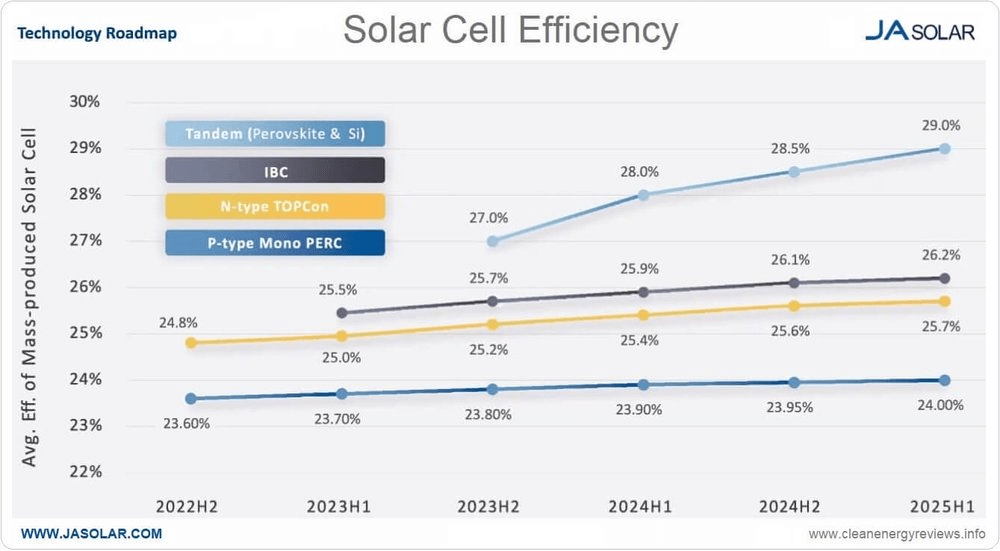
JA Solar, Clean Energy Reviews
According to Clean Energy Reviews , “solar panel efficiency is a measure of the amount of sunlight (irradiation) that falls on the surface of a solar panel and is converted into electricity”. Furthermore, there are two factors for solar panel efficiency which are “photovoltaic (PV) cell efficiency” and “total panel efficiency”. In relation, “increasing the panel size can also increase efficiency due to creating a larger surface area to capture sunlight”. Based on JA Solar, the efficiency of solar panels is projected to continue to rise through 2025. The average efficiency from JA Solar is forecasted to increase from 25.4% to 26.2% at a CAGR of 1.04%. We believe the increasing solar PV efficiency benefits the Renewable Electricity, Electrical Equipment and Semiconductor industries with the increasing efficiency of solar panels.
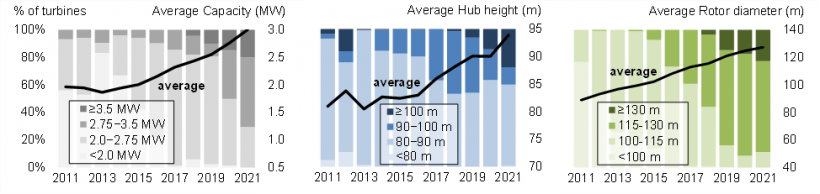
US Department of Energy
Furthermore, for wind energy, wind turbines have not only grown in size but have also witnessed a significant rise in their maximum power rating or capacity since the early 2000s. In 2021 , "the average capacity of newly installed wind turbines in the US reached 3.0 MW", marking a 9% increase from 2020 and a substantial 319% increase compared to the period of 1998-1999, thus a CAGR of 11.59% during the period. “Higher capacity turbines mean that fewer turbines are needed to generate the same amount of energy across a wind plant—ultimately leading to lower costs” according to the US Department of Energy. According to Berkey Lab, the average capacity of onshore wind turbines is projected to grow at a CAGR of 5.1% through 2035. Thus, we believe the increasing wind turbine capacities benefit the Independent Power and Renewable Electricity Producers, Electrical Equipment and Semiconductor industries with the increasing efficiency of wind turbines.
Decreasing Cost
LaFayette
The chart above shows the capital costs which had been decreasing over time based on LaFayette. According to International Renewable Agency (IRENA), solar PV costs have declined substantially.
Between 2000 and 2020, renewable power generation capacity worldwide increased 3.7?fold … as their costs have fallen sharply, driven by steadily improving technologies, economies of scale, competitive supply chains and improving developer experience. Costs for electricity from utility-scale solar photovoltaics (PV) fell 85% between 2010 and 2020 - International Renewable Energy Agency
This implies a CAGR of -28.5%. However, the chart above shows a plateauing decrease in the cost of PV from 2010 compared to the larger declines from 1995 to 2005.
According to the US Environmental Protection Agency , wind and solar in the US “represent many of the lowest-cost new power generation resources” and the construction of new plants “may even cost less than running an already-existing facility that generates power using other resources”. In relation, according to the World Research Institute , by 2015, solar PV costs had declined to a point where it is “well within the range of being cost competitive with certain fossil fuel power”. We believe this highlights the cost competitiveness of renewable energy sources compared to fossil fuels.
Moreover, IRENA forecasted solar PV costs to continue to decline by 41% from 2018 to $0.05 kWh by 2050. This implies a CAGR of -1.4% which is considerably lower than the historical decline but still a decrease for costs notwithstanding. Thus, we believe the decreasing solar costs could continue to benefit the Independent Power and Renewable Electricity Producers, Electrical Equipment and Semiconductor industries.
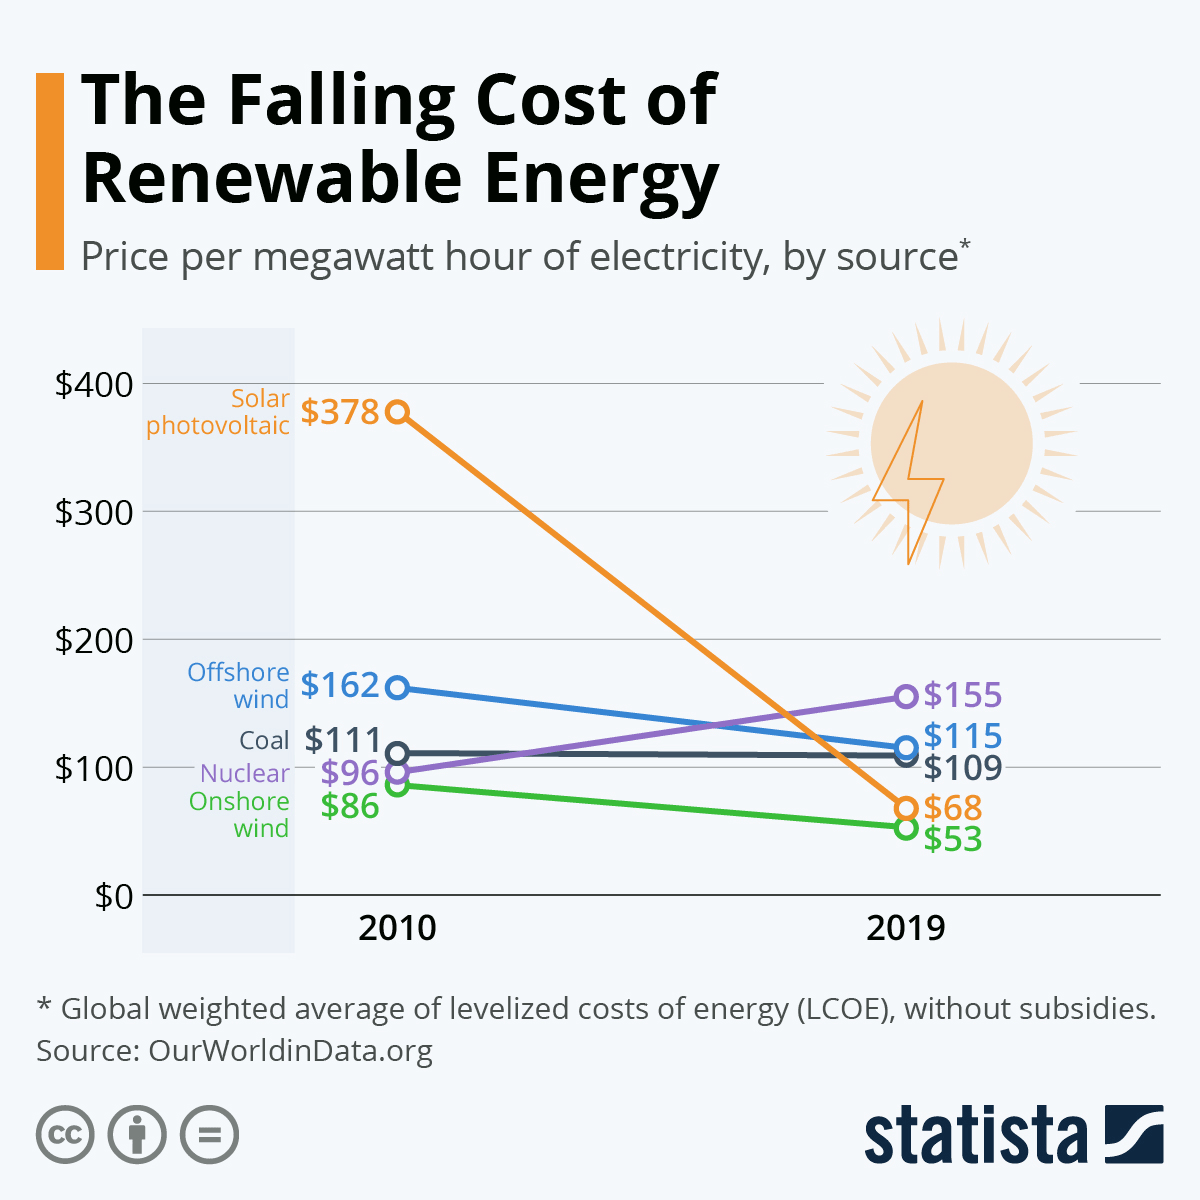
Statista, OurWorldinData.org, WEF
Besides solar, wind energy had also witnessed decreasing costs since 2010 based on the chart above to $53 per mWh and was the most cost-competitive energy source in 2019 followed by solar energy. From 2010 to 2019, onshore wind cost decreased from $86 kWh to $53 kWh which is an annual CAGR of -5.2%. According to the US Department of Energy, it is expected that “cost reductions of 17%–35% by 2035 and 37%–49% by 2050 under a median or best-guess scenario, driven by bigger and more efficient wind turbines, lower capital and operating costs, and other advancements”. Based on our calculations, this translates to an annual CAGR of -3.4% from 2021 to 2035 but is lower compared to the historical annual decline of -5.2%. Thus, we believe the decreasing cost of wind energy costs benefits the Independent Power and Renewable Electricity Producers, Electrical Equipment and Semiconductor industries.
According to McKinsey , EVs are expected to have a lower total cost of ownership compared to ICE in most regions by 2025 including Europe and the US. Additionally, the total cost of ownership of EVs is projected to decline by 22.3% in the US by 2025 by McKinsey.
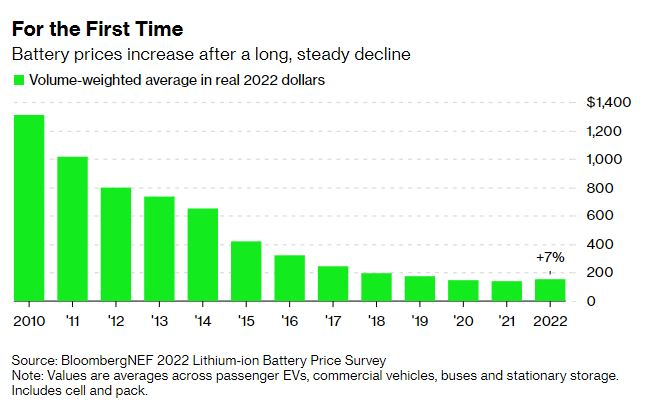
Bloomberg
From the chart, average EV battery prices had been on a decreasing trend at a CAGR of -16.9% from around $1,300 to $141 in 2022. Per kWh. However, battery prices had increased in 2022 by 7% which is in contrast to the declining trend of battery prices since 2010. Moreover, the decline in prices appears to be slowing compared to the earlier years. According to Bloomberg, “there are several factors driving the uptick, but the single most important one is rising costs for materials including cobalt, nickel and lithium”. Though, E Source forecasted the price of automotive batteries to decrease “as the scale of production increases” and the “price per kilowatt-hour (kWh) of an automotive cell is likely to fall from its 2021 high of about $160 to $80 by 2030”, translating to a CAGR of -7.4% during the period. Thus, we believe the decrease in EV costs benefits the Semiconductor industry as EVs have more semicon content compared to ICE as well as the Metals & Mining, Chemicals and Automobile Components industries for EV battery growth.
| Driver |
| Details |
| Past CAGR |
| Forward CAGR |
| Strength of Drivers (0 – Lowest, 4 – Highest) |
| Industries Impacted |
| Government-Imposed Regulatory Policies |
| Biofuel Mandates |
| 14.70% |
| 9.8% |
| 4 |
| Oil, Gas & Consumable Fuels |
| Renewable Energy Targets |
| - |
| New |
| 4 |
| Independent Power & Renewable Electricity Producers. |
| ICE Ban |
| 51.8% |
| 29% |
| 4 |
| Independent Power & Renewable Electricity Producers Electric Utilities |
| Government Subsidies and Incentives |
| US Tax Incentives |
| 6.90% |
| 7.20% |
| 3 |
| Independent Power & Renewable Electricity Producers. |
| China Subsidies for Renewables |
| 24.80% |
| 0% |
| 0 |
| Independent Power & Renewable Electricity Producers Electric Utilities |
| Low-Emission Hydrogen Production |
| - |
| New |
| 4 |
| Oil, Gas & Consumable Fuels Energy Equipment & Services |
| Increasing Efficiency |
| Solar PV Efficiency |
| 2.38% |
| 1.04% |
| 1 |
| Independent Power & Renewable Electricity Producers Electrical Equipment Semiconductor |
| Wind Turbine Capacities |
| 11.59% |
| 5.10% |
| 2 |
| Independent Power & Renewable Electricity Producers Electrical Equipment Semiconductor |
| Decreasing Costs |
| Solar Costs |
| -28.50% |
| -1.40% |
| 1 |
| Independent Power & Renewable Electricity Producers, Electrical Equipment Semiconductor |
| Wind Energy Costs |
| -5.20% |
| -3.40% |
| 2 |
| Independent Power & Renewable Electricity Producers Electrical Equipment Semiconductor |
| EV Batteries |
| -16.9% |
| -7.40% |
| 3 |
| Semiconductor Metals & Mining Chemicals Automobile Components |
Source: Khaveen Investments
Overall, we summarized the growth drivers of renewables in the table above which are government-imposed regulatory policies, government subsidies and incentives, increasing efficiency and decreasing costs. Out of all drivers, the only driver which has a higher forward CAGR is the US tax incentives for renewables following the implementation of the US Inflation Reduction Act. On the other hand, biofuel mandates, solar and wind energy efficiency and costs have a lower forward CAGR. The industry which we identified to benefit the most with the highest number of growth drivers is Independent Power and Renewable Electricity Producers at a total of 7. Furthermore, we ranked the growth drivers based on their strengths on a 0 to 4. We ranked Government-Imposed Regulatory Policies as the strongest driver with the ICE ban and renewable energy targets at 4 and biofuel mandates at 3. This is followed by Government Subsidies and Incentives with US tax incentives at 3 and low-emission hydrogen production at 4. As China Subsidies for Renewables have a strength of 0, we do not expect it to be a driver.
Use Cases of Clean Energy and Sustainability
In this section, we examine the various types of products and services as use cases in Clean Energy and Sustainability and categorized them based on their GICS breakdown by Industry and Subindustry below.
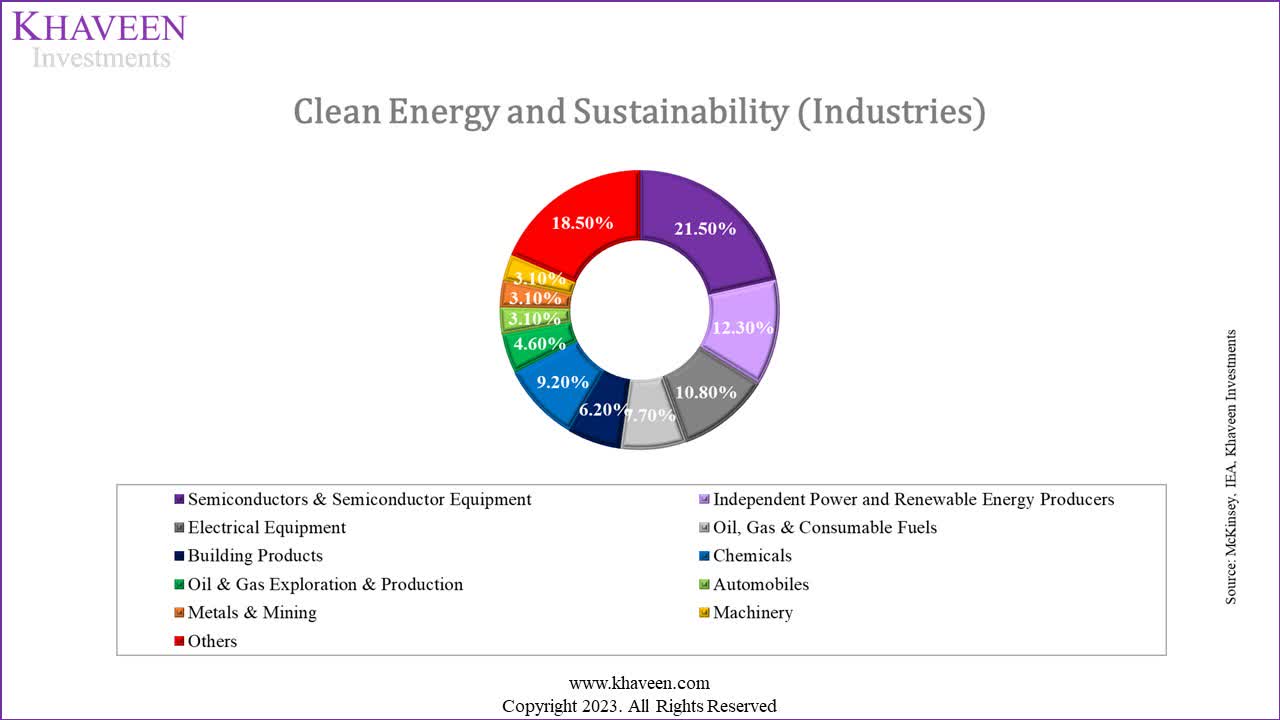
McKinsey, IEA, Khaveen Investments
Based on our analysis of various research reports from McKinsey and the International Energy Agency (IEA), we identified a total of 65 products and services that have applicable use cases from the decarbonization which we then broke down in the chart above. The largest breakdown is represented by the Semiconductor & Semiconductor Equipment Industry at 21.5% of the total. For example, this includes products related to solar energy such as solar panels, solar modules/PV modules, solar PV cells, solar wafers, solar inverters, solar microinverters, solar power optimizers, solar tracking systems, solar concentrators, solar installation, solar cell manufacturing equipment, solar panel production equipment, solar wafer manufacturing equipment and semiconductor process control equipment for solar applications.
Besides that, the Independent Power Producers and Renewable Energy Producers industry follow after Semiconductors at a share of 12.3%. This includes companies that operate power assets and grid infrastructure and are involved in renewable energy sources such as biomass electricity, geothermal electricity, hydroelectricity, wind, solar, hydrogen and biofuels power generation.
The third largest Industry with the most use cases is Electrical Components and Equipment with a share of 10.8%. This includes the companies involved in the sale of electric heat pumps, installation of battery systems, electric charging stations, charging infrastructure, batteries, solar panels and wind turbine systems.
Based on our analysis, our target is to obtain exposure to the Semiconductor, Renewable Energy and Electrical Components and Equipment industries as these industries represent the largest breakdown in terms of the use cases in Clean Energy and Sustainability.
Best ETF Selection
In the final section, we analyzed the top 3 ETFs and determined which is the best ETF based on the suitability of whether their holdings breakdown and exposures match the top industries based on a combination of factors such as application %, growth prospects, FCF margins, valuation, multifactor score model and demand drivers as well as quantitative metrics such as risk-adjusted returns, AUM and average spread.
| Industry |
| Application % |
| Revenue CAGR (3-year Average) |
| FCF Margins (5-year Average) |
| Valuation (Upside) |
| Multifactor Model Score (0 – lowest, 6-highest) |
| Demand Drivers |
| Semiconductors & Semiconductor Equipment |
| 21.5% |
| 25.3% |
| -3.0% |
| 37.3% |
| 4 |
| 4 |
| Electrical Equipment |
| 12.3% |
| 26.9% |
| -33.7% |
| 62.0% |
| 3 |
| 4 |
| Renewable Electricity |
| 10.8% |
| 10.5% |
| 3.7% |
| 42.1% |
| 2 |
| 7 |
| Oil, Gas & Consumable Fuels |
| 12.3% |
| 2.4% |
| 3.4% |
| 30.3% |
| 2 |
| 2 |
| Automobiles |
| 3.1% |
| 65.2% |
| 3.3% |
| 24.5% |
| 1 |
| 0 |
| Chemicals |
| 9.2% |
| 2.6% |
| 3.5% |
| 28.1% |
| 2 |
| 1 |
| Metals & Mining |
| 3.1% |
| 2.8% |
| 11.5% |
| 35.9% |
| 2 |
| 1 |
Source: Khaveen Investments
Based on the table above, we compiled the % application, revenue CAGR, FCF margins, valuations, multifactor model score and number of demand drivers for each of the industries based on a selected top 5 companies for each industry. For the application, we referred to our breakdown of the use cases in the previous point. For the revenue CAGR, we obtained this based on the forward 3-year average analyst revenue consensus of our selected companies. For the FCF margins, we obtained the average 5-year FCF margins of the top companies. Whereas the valuation is based on the average price target upside of the companies. For the multifactor model score, we based it on our proprietary statistical analysis model where the higher score is allocated for industries with higher returns. Lastly, the demand drivers are based on the first point.
| Industry Ranking |
| Application % |
| Revenue CAGR |
| FCF Margins |
| Valuation |
| Multifactor Model Score |
| Demand Drivers |
| Average |
| Semiconductors & Semiconductor Equipment |
| 1 |
| 3 |
| 6 |
| 3 |
| 1 |
| 2 |
| 2.67 |
| Electrical Equipment |
| 2 |
| 2 |
| 7 |
| 1 |
| 2 |
| 2 |
| 2.67 |
| Renewable Electricity |
| 4 |
| 4 |
| 2 |
| 2 |
| 3 |
| 1 |
| 2.67 |
| Oil, Gas & Consumable Fuels |
| 2 |
| 7 |
| 4 |
| 5 |
| 3 |
| 4 |
| 4.17 |
| Automobiles |
| 6 |
| 1 |
| 5 |
| 7 |
| 7 |
| 7 |
| 5.50 |
| Chemicals |
| 5 |
| 6 |
| 3 |
| 6 |
| 3 |
| 5 |
| 4.67 |
| Metals & Mining |
| 6 |
| 5 |
| 1 |
| 4 |
| 3 |
| 5 |
| 4.00 |
Source: Khaveen Investments
Based on our compilation of the factors in the table, we assigned a score ranking to each of the industries and calculated the average score. Overall, the top industries are Semiconductors & Semiconductor Equipment, Electrical Equipment, and Renewable Electricity which is tied for first place with an average score of 2.67. This is followed by Metals & Mining with a score of 4 and Oil, Gas & Consumable Fuels with a score of 4.17.
Holdings Breakdown of ETFs
As there are no pureplay ETFs for the Renewable Electricity industry, we examined the breakdown of the holdings of the ETFs and categorize them based on their industries below to determine which ETF is the best matched.
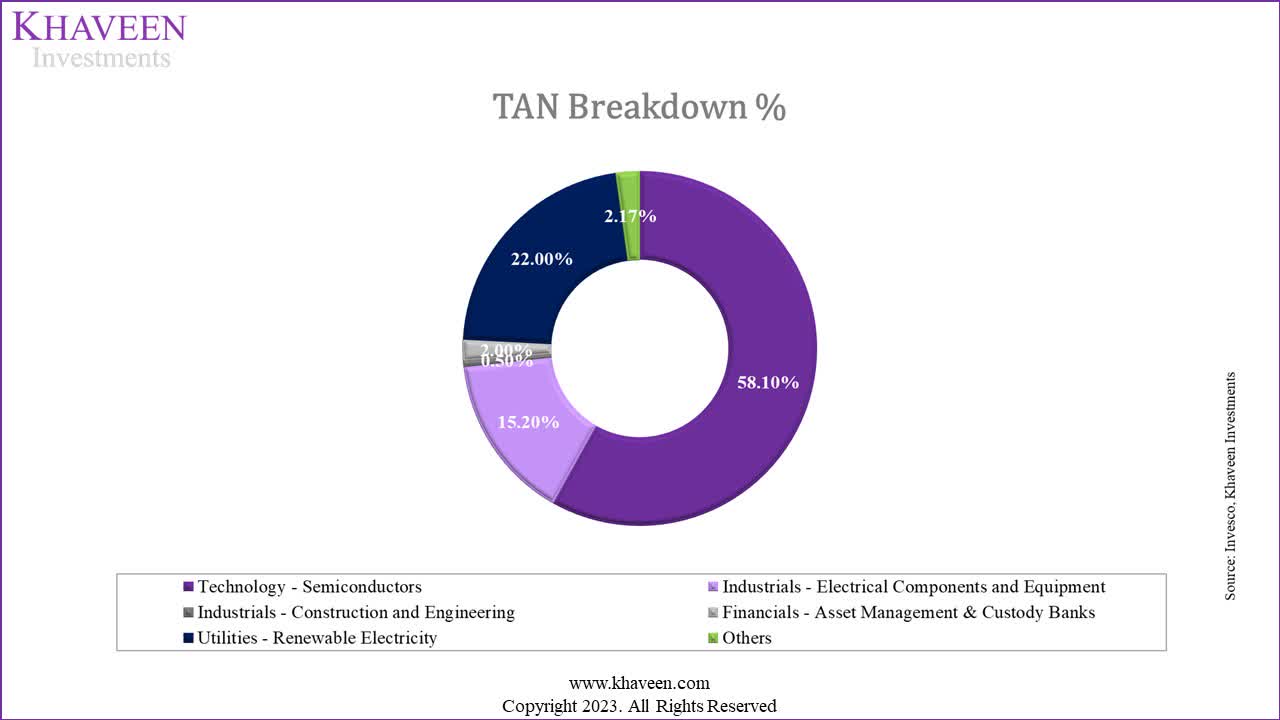
Invesco, Khaveen Investments
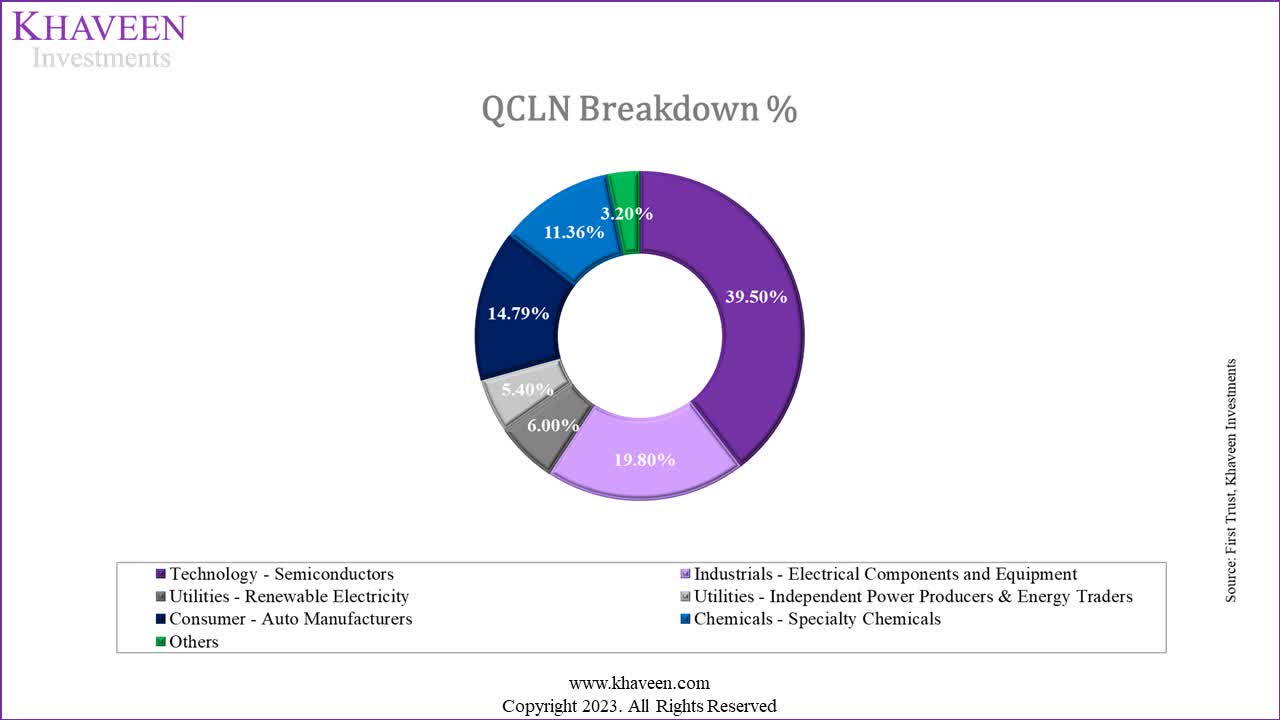
First Trust, Khaveen Investments
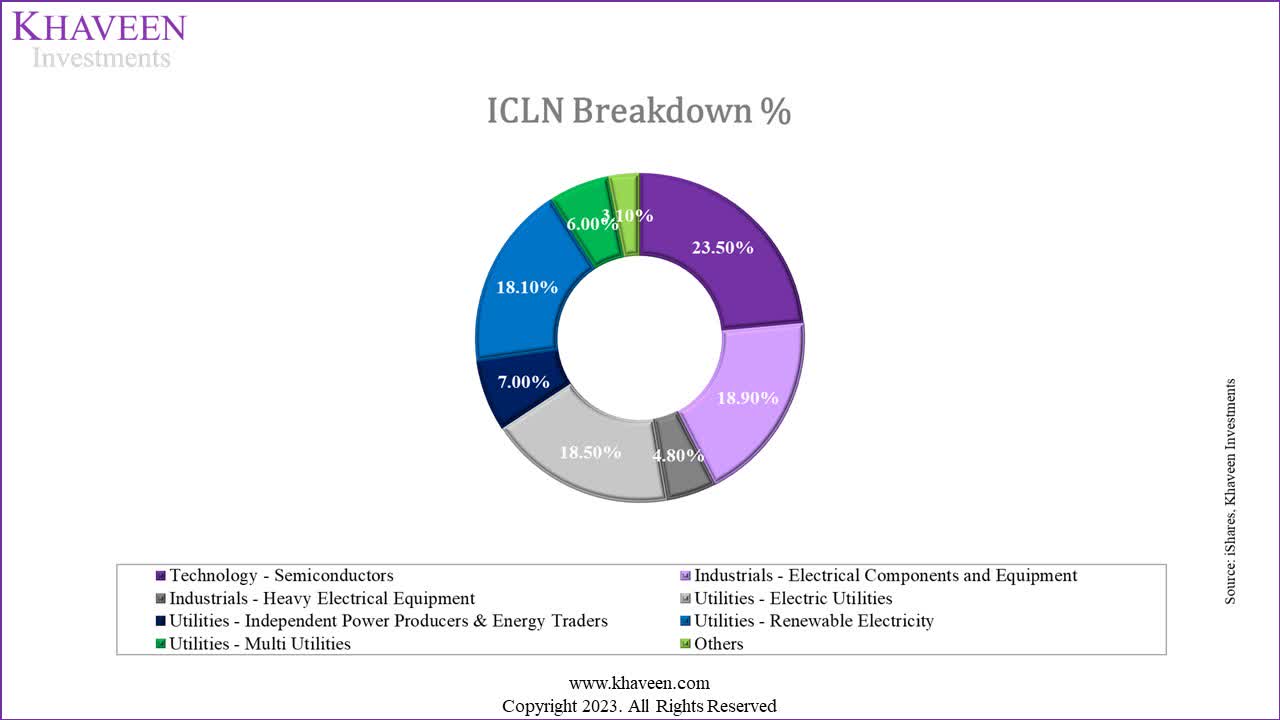
iShares, Khaveen Investments
Based on the breakdown, we believe the TAN ETF is the best-matched ETF as it has the highest exposure to the top 3 industries which are Semiconductors & Semiconductor Equipment, Electrical Equipment and Renewable Electricity with a total weightage of 95.3%. This is followed by ICLN with a total weightage of 66.9% for the top 3 industries while QCLN has the lowest among the 3 ETFs at a total of 64.7%.
Quantitative Analysis
| ETF |
| Quantitative Score* |
| AUM ($ bln) |
| Average Spread (%) |
| TAN |
| 0.62 |
| 2.34 |
| 0.10% |
| ICLN |
| 0.50 |
| 4.79 |
| 0.05% |
| QCLN |
| 0.53 |
| 1.62 |
| 0.09% |
*Based on a proprietary calculation of returns factoring in diversification, concentration risk and standard deviation of returns.
Source: ETF.com, Khaveen Investments
Furthermore, based on our statistical analysis model, TAN has the highest quantitative score followed by QCLN which further highlights the strength of TAN. Though, ICLN has a larger AUM and the lowest spread. Thus, we believe that the returns/risk is the key metric in this analysis where TAN is superior.
Overall, we believe that TAN is the best renewable ETF based on our analysis that it has the highest exposures to the top 3 industries which are Semiconductors & Semiconductor Equipment, Electrical Equipment and Renewable Electricity as well as having the highest Quantitative Score.
Risk: Rising Political Risks
We believe that one of the risks in the renewable energy industry is political risk. For example, we believe that the US-China trade war could impact the growth outlook of the renewables industry. In 2011, the US imposed tariffs on solar panels from China by 250%. In 2022, the US government intended to expand the restrictions on Chinese-made solar panels. Thus, we believe the expansion of trade restrictions and tariffs could affect the competitiveness of Chinese solar producers and impact their growth outlook.
Verdict
In summary, our analysis has identified several key factors driving growth in the renewables sector, such as government regulations, subsidies, improved efficiency, and cost reduction. We observed that most of these drivers have lower projected CAGRs compared to their historical CAGRs. However, we determined that government-imposed regulatory policies, including the ICE ban, renewable energy targets, and biofuel mandates, are the most influential drivers due to the high forward CAGR of biofuel mandates and EVs.
Based on our analysis, we believe the industries which provide the top exposure are the Semiconductor, Renewable Energy, and Electrical Components and Equipment industries, as they play a pivotal role in Clean Energy and Sustainability. Among the considered renewable ETFs, TAN emerges as the most favorable choice. TAN offers the highest level of exposure to the top three industries: Semiconductors & Semiconductor Equipment, Electrical Equipment, and Renewable Electricity. Furthermore, TAN exhibits a superior Quantitative Score with higher risk-adjusted returns compared to other renewable ETFs. Considering all these factors, we rate TAN as a Buy.
For further details see:
TAN: Best Renewable Electricity ETF