VOO - Tax Season And The Coming Liquidity Downturn
2023-04-09 12:21:11 ET
Summary
- With peak tax collection season set to begin next week, based on historical patterns, there is a high risk of a material downturn in dollar liquidity.
- That downturn should be an obstacle to the recent rally that has been fueled at least partially by a huge draw in the balance of the Treasury General Account.
- Based on historical patterns, I would try to show why this scenario is highly likely and will probably give opportunities for tactical positioning.
Since the start of the pandemic, the markets, especially the SPDR® S&P 500 ETF Trust ( SPY ) seem to be moving in sync with dollar liquidity characterized by the proxy for liquidity measured in its most popular form by the Total size of the Federal Reserve balance sheet minus the amounts “trapped” in the Treasury General account and the Reverse Repo facility of the Federal Reserve.
I won’t go into the details of why dollar liquidity is so important for the evolution of asset inflation or deflation as this article would be excessively long but here you can find an excellent thread by Andy Constan explaining the underlying dynamics.
In this article I would use a slightly different definition that seems to track the behavior of the market more accurately by using total Securities held outright by the Federal Reserve instead of the Total size of the federal reserve. I would also add the liquidity provided by the FED since it started losing money around September last year because the yield on their balance sheet holdings is today much lower than the yield it is paying on their liabilities. And that gap in practice its paid with newly created dollars.
So, the definition that I would use is as follows: Assets Held Outright – Treasury General Account – Reverse Repo Facility - Remittances Due to US Treasury
A couple of caveats, the first one is that directly subtracting remittances to the formula is a simplification as in normal times (when the fed is making money) that variable works as a flow of money that periodically leaves the fed and partially finances the US Treasury. But when the FED starts losing money it starts working as a balance of the total accumulated losses as the FED cannot ask for that money from the US Treasury. It simply prints that money and register the accumulated losses as an accounting entry. When the numbers where positive they stayed at very low levels that made them immaterial to the full addition of terms, that is why I simply used the whole data series to simplify the calculations, so technically an error but an immaterial one.
The second one is that some would argue that the full size of the balance sheet of the FED is a better proxy than Assets Held Outright, and that measure has been heavily affected by the emergency loans observed during the last couple of weeks. That is certainly debatable but at least from my perspective an emergency loan is a temporary expansion of liquidity with a defined maturity date for the counterpart who is unlikely to use that liquidity to expand risk taking and probably wants to quickly repay that loan as its usage is seen as a sign of fragility. All the components of the definition that I use are indefinite expansions or contractions of liquidity, that do not impose any commitment on the counterpart receiving the liquidity, something that could be called unencumbered liquidity.
And the relation to SPY looks like this since the start of the pandemic.
Chart 1 (Fred St Louis Fed & Alphavantage)
Into the Details
The focus of this article is on the implications of tax season on the expected build-up of the Treasury General Account and the effects for this proxy of liquidity assuming the Federal Reserve continues with its quantitative tightening plans and a stable level of the amount "trapped" in the Reverse Repo Facility.
To do this I would be using basically two additional datasets provided by the U.S. Treasury. The first one is the table called Deposits and Withdrawals of Operating Cash from the Daily Treasury Statement (DTS) Repor t and the second is the U.S. Government Revenue Collections Report.
The first one shows the daily deposits and withdrawals to the Treasury General Account with significant detail rounded to the nearest million. And I will focus almost exclusively on two items affecting the Treasury General Account; the deposits denominated Public Debt Cash Issues (Table IIIB) and the withdrawals denominated Public Debt Cash Redemp. (Table IIIB) to isolate the impact of net debt issuance on the Treasury General Account Balance.
The second dataset shows the daily Government Revenue Collections and classify each of those collections as either Non-Tax, IRS Non-Tax and IRS-Tax and I would focus exclusively on the ones classified as IRS-Tax to isolate the impact of taxes on the Treasury General Account Balance. Those revenues are by far the most important of the three categories representing between 79% and 87% percent of the total revenues of the US Treasury depending on the economic reality of each year, with good years on the high side of that range and bad years on the low side. So, for 2023 tax season that reflects the economic environment of 2022 I expect Tax Revenue to be on the high side of that range.
For most of all the coming analysis I would focus on years 2011 to 2019 and 2022 to leave out years heavily affected by the Great Financial Crisis and the years 2020 and 2021 as in those years the tax season calendars were altered to accommodate the difficulties arising from the pandemic.
On the following chart we can see that the cadence of tax revenue collection shows a very clear annual seasonality during those years, so going forward I would use the average of those years as it is a fair representation of the years under analysis.
Chart 2 (Fiscal Data - Treasury.gov)
For the TGA the pattern is undeniably messier, but you can clearly see the bumps during the periods in which tax revenue collection is concentrated.
Chart 3 (Fred Stlouisfed)
And when you use the average seasonality of both series, the influence of tax collections on the amount of liquidity trapped in the TGA becomes much clearer.
Chart 4 (Fred St Louis FED & Fiscal Data - Treasury.gov)
And we are basically one week away from the start of the peak tax collection period, the 4-weeks that concentrate the biggest increase in the treasury general account of the year. Estimating the amount of tax collections for this year is much harder, but even after certain adjustments like the ones that happened to tax brackets to reflect inflation, taxing occurs over an economy that in practice works in nominal dollars so I would assume that something like 2022 is reasonable and for the first 12 weeks of the year that has been the case.
Chart 5 (Fiscal Data - Treasury.gov)
The previous chart concentrates in the first 24 weeks of the calendar year to give a closer look at the period under analysis. During the first 12 weeks of this year, tax collections have amounted to 1,048 billion and during the same period of 2022 tax collections amounted to 1,043 billion. Looking forward to the critical 4-week period under discussion (weeks 15 to 18) tax collections amounted to 920 billion in 2022 and that same period saw an increase in the TGA from 547 to 945 billion, so a net increase in trapped liquidity of $398 billion.
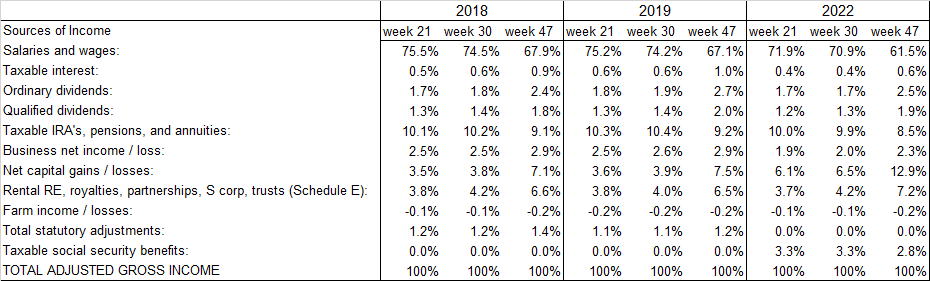
But to double-check if that assumption is reasonable, I used the statistics provided by the IRS to understand the composition of the individual taxable income for years 2022, 2019 and 2018. It's useful that the statistics for those tax seasons are separated into 3 time periods: tax collections up to week 21, up to week 30 and up to week 47 of the calendar year.
Right away you can see that the components are not exactly the same and because of that the comparisons are not perfect between years, but those components are relatively immaterial (statutory adjustment & Taxable social security benefits). Apart from that. it's clear that Salaries and Wages are by far the most important component and the component with the biggest jump in 2022 vs 2018-19 its Net Capital Gain / Losses.
Using conservative assumptions (trying not to overestimate total gross income) for the current year I would assume that Salaries and Wages increased 5%, Taxable interest doubles, Capital Gains halves and all other components stay at the same level. With that, I get to a gross adjusted income level for the first 21 weeks of the year that is 0.9% higher than 2022.
After that comes all the credits and deductions but honestly, I won't get into those as I clearly do not have the expertise to make assumptions for those components.
There are also two other relevant accounts in those reports: Taxes due at time of filing and Total refunded overpayments . And for 2018-19 those added to net tax refunds of between $180 and $188 million dollars but for 2022 it amounted to only $101 million net refunds. I do not have a clear understanding of the source of that divergence but to be extra conservative I would assume a return to the something closer to 2018-2019, and I will impute the full difference in cash inflow to the US TREASURY to the 4 weeks under analysis, so $830 billion for this year instead of the $920 billion collected in 2022. Reducing the build-up in the TGA from $398 in 2022 to $308 billion this year.
And finally, it's important to recognize that those individual taxes made up between 82% and 75% of total IRS-TAX revenue received by the US treasury for the first 21 weeks of 2018 and 2019, and only 63% for the year 2022, so clearly there is significant influence of other taxes affecting total tax revenue collections, but I could not find clear statistics for other sources like corporations.
With all of that, please keep in mind that the estimation of $830 billion in tax collections and consequently for the build-up in TGA balances for this year has a significant underlying level of uncertainty.
Influence of net new debt issuance
But there is another factor to consider and those are the deposits related to net new debt issuance coming into the TGA, that requires getting into the weeds of the DTS report mentioned previously. This database is more difficult to fully understand as there have been many changes during the years in terms of reporting, but the changes are not reflected on the older set of datapoints. So, I focused only on the data from 2013 to the present day.
During that period, I added up all deposits except for gross new debt issuance ( Public Debt Cash Issues (Table IIIB) ) as most of those deposits go out to pay for debt that is maturing all through the year ( Public Debt Cash Redemp. (Table IIIB) ).
To that amount I added only the amount of debt that was not used to payback maturing debt (Net New debt Issuance). That is total Treasury Revenue plus the financing of the fiscal deficit, so basically a proxy of fiscal spending.
And in the following table you can still see that tax collections continue to be the most important driver, but net new debt issuance also has a material influence depending on the dynamics of the fiscal deficit.
Table 1 (Fiscal Data - Treasury.gov)
The Debt Ceiling
According to the Congressional Budget Office (CBO) the fiscal deficit should amount to $1.4 trillion in 2023, that would imply a weekly cadence of new debt issuance of roughly $27 billion if it was done uniformly along the calendar year. That would mean that during the 4-week period under analysis the US government should be getting an additional inflow related to net new debt at a pace of $108 billion, but they are prohibited from doing so after hitting the debt ceiling weeks ago.
So, if the pattern of net new debt issuance has historically been done evenly during the year that would mean that this year limitation should blunt the impact of tax collection from $308 to $208 billion. But has the pattern of net new debt collection happened steadily across the calendar year?
Apparently not.
The following chart shows the seasonality of net new debt issuance and again there seems to be a pattern.
Chart 7 (Fiscal Data - Treasury.gov)
When you look at the average of those years against the average of the pattern for tax collections you can clearly see that the US Treasury consciously seeks to blunt the effects of the tax collection peaks on liquidity by decreasing net new debt collection during those periods.
Chart 8 (Fiscal Data - Treasury.gov)
That shows that the historical increases in the TGA balance that are seen in chart 4 occurring in parallel with tax collection peaks are the result of those tax collections and NOT of net new debt issuance. So, the inability to issue net new debt during the 4-week period under analysis is irrelevant because that has always been the case during that period.
With that out of the way let's get to the implications for the market under a certain set assumption.
The Assumptions
- Total Tax collections of $830 billion for the period of week 15 (ending April 16) to 18 (ending May 5) of 2023.
- A build-up on the TGA of $308 billion from week 15 to week 19 (ending May 14).
- A continuation of the FED QT program.
- A stable amount trapped in the Reverse Repo Facility.
- A creation of new dollars at a pace of roughly $2 billion by the FED to pay for the gap between the yield of its assets and its liabilities.
- The limit by counterpart to use the reverse repo facility stays unchanged.
The Market Implications
From around April 5 to 10, 2023, to some point between May 5, 2023 and May 14, 2023 the market should experience a significant decrease in dollar liquidity of roughly $416 billion. That is composed of a 308 billion increase in the TGA, $118 billion reduction in Assets Held Outright in the FED balance sheet and roughly $10 billion increase in liquidity coming from the new dollars required to pay the negative gap between the yield on assets in the portfolio of the FED and the cost of their liabilities. And that is a lot!
As of the last report (April 5) the liquidity proxy (Assets Held Outright – Treasury General Account – Reverse Repo Facility - Remittances Due to US Treasury) stood at $5,183 billion. And as you can see in chart 1 it has acted as the gravity for the market. It is also interesting to see that the liquidity proxy stopped falling by early October 2022 coinciding with the lows for the market reached around mid-October.
And by looking at the most significant components of the proxy for liquidity in the next chart you can see that the reason for that stability can be found mainly in the reduction of the TGA balance that has completely nullified the effects on liquidity of the QT program of the FED and because the amount of liquidity trapped on the reverse repo facility stopped growing around the same time.
Chart 9 (Fred St Louis Fed)
I expect the TGA to keep draining for one more week, how much it's hard to say but for arguments sake let’s say that by a $30 billion for the next week. So, lets project the following weeks under the assumptions previously described and see how chart 1 looks with that projection.
Table 2 (Author Projections) Chart 10 (Fred St Louis Fed, Alphavantage & Author Projections)
Risks
The most important risk for the thesis is that the amount trapped in Reverse Repo Facility could move in a dramatic way that might counteract the whole pattern that I am projecting. I think that is unlikely as it has shown stability for almost a year as you can see on chart 9, but it’s possible. A thing to track is the possibility of the fed reducing the limit by counterpart, if that were to happen it could sharply reduce the amount trapped in the reverse repo facility at least temporarily.
Apart from that it’s the possibility of tax season collections coming in much lower than my estimation. That is a risk, but in any case, the pattern should still be there but could be somewhat blunted.
And finally, if the fed ends QT or more importantly starts QE again all the conclusions of this article would be void.
Conclusion
With the coming tax collection peak a week away, under assumptions based on historical patterns, it is highly probable that the proxy for liquidity should have a very significant reduction to levels not seen since late 2020. And if the influence of liquidity in the markets stays as significant as has been during the past 3 years there is also a very a clear risk for a significant correction for the markets.
To be clear, I expect that correction to be short lived because after tax season with the inability to issue net new debt the TGA should be drained relatively quickly adding back that trapped liquidity into the economy. After that, the biggest event in terms of liquidity (assuming QT stays in place) should come from the eventual lifting of the debt ceiling as new debt issuance would be concentrated in a relatively small period generating a new potential big hiccup for the market in terms of liquidity.
I am open to any constructive criticism as my objective is to continue deepening my own understanding of the whole liquidity subject. Thanks for reading!
For further details see:
Tax Season And The Coming Liquidity Downturn