XLK - TDIV: A Dividend ETF Overweight In Semiconductors
2023-06-05 06:29:19 ET
Summary
- First Trust NASDAQ Technology Dividend Index Fund holds 93 dividend stocks in technology and communication.
- It is overweight in semiconductors and in the top holdings.
- Valuation, quality and dividend growth metrics look good.
- However, performance since inception is underwhelming.
This article series aims at evaluating ETFs (exchange-traded funds) regarding the relative past performance of their strategies and metrics of their current portfolios. Reviews with updated data are posted from time to time.
TDIV strategy and portfolio
First Trust NASDAQ Technology Dividend Index Fund ( TDIV ) started investing operations on 8/13/2012 and tracks the NASDAQ Technology Dividend Index. As of writing, it has 93 holdings, a 12-month distribution yield of 2.19% and a total expense ratio of 0.50%. Distributions are paid quarterly.
As described on NASDAQ website , the index "includes up to 100 Technology and Telecommunications companies that pay a regular or common dividend".
To be eligible, stocks must be listed on a US stock exchange, be classified in Technology or Telecommunications by the Industry Classification Benchmark, and have at least:
- $500 million in market capitalization
- $1 million in 3-month average daily traded value
- 0.5% in dividend yield
Companies are excluded if they have decreased the dividend per share in the past 12 months, entered into a definitive M/A agreement or filed for bankruptcy or similar protection. A maximum of 100 companies passing these rules are included in the index among those with the highest dividend per share over the last 12 months. The index is reconstituted twice a year and rebalanced quarterly based on a modified dividend value-weighted methodology with weight limits (80% in technology, 20% in telecommunications). Securities may be removed at any time if they don't meet eligibility criteria. In this case, they are not replaced until the next reconstitution.
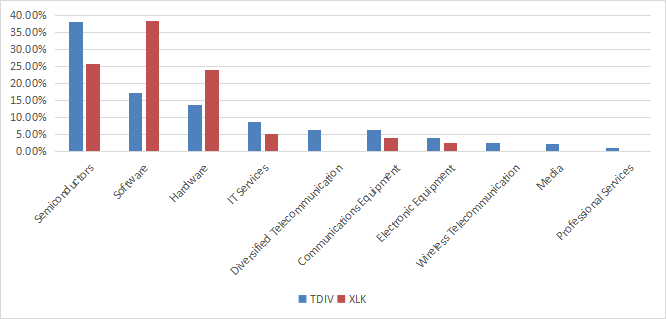
The fund invest mostly in U.S. companies (about 88% of asset value) and in large caps (85%). It is overweight in semiconductors and semiconductor equipment (38.2%). The next heaviest industries are software (17.1%) and hardware (13.7%). Compared to the sector benchmark Technology Select Sector SPDR Fund ( XLK ), TDIV overweights semiconductors and underweights software and hardware.
TDIV industry breakdown (chart: author; data: First Trust, SSGA)
The fund is very concentrated: the top 10 holdings, listed below, weigh 60% of asset value. Exposure to each of the top 5 names is between 7% and 10%. Other constituents are below 5%.
| Ticker |
| Name |
| Weight |
| EPS growth %TTM |
| P/E TTM |
| P/E fwd |
| Yield% |
| Broadcom Inc. |
| 9.83% |
| 56.84 |
| 25.66 |
| 19.33 |
| 2.27 |
| Microsoft Corp. |
| 9.67% |
| -3.75 |
| 36.36 |
| 34.85 |
| 0.81 |
| Intel Corp. |
| 9.03% |
| -111.45 |
| N/A |
| 77.14 |
| 1.60 |
| Apple, Inc. |
| 8.83% |
| -4.33 |
| 30.74 |
| 30.20 |
| 0.53 |
| International Business Machines Corp. |
| 7.37% |
| -67.77 |
| 67.45 |
| 14.05 |
| 5.01 |
| Oracle Corp. |
| 4.36% |
| 16.69 |
| 34.79 |
| 21.03 |
| 1.51 |
| Texas Instruments Incorporated |
| 3.68% |
| 1.93 |
| 19.66 |
| 23.72 |
| 2.83 |
| QUALCOMM, Inc. |
| 3.37% |
| -4.58 |
| 12.41 |
| 13.92 |
| 2.77 |
| Analog Devices, Inc. |
| 2.16% |
| 100.17 |
| 25.48 |
| 17.06 |
| 1.91 |
| Motorola Solutions, Inc. |
| 1.93% |
| 9.55 |
| 35.35 |
| 25.08 |
| 1.25 |
Regarding valuation ratios reported in the next table, TDIV is significantly cheaper than the sector benchmark ( XLK ), and close to the S&P 500 ( SPY ).
| TDIV |
| XLK |
| SPY |
| Price/Earnings TTM |
| 21.49 |
| 28.6 |
| 21.21 |
| Price/Book |
| 3.51 |
| 7.68 |
| 3.77 |
| Price/Sales |
| 2.46 |
| 5.62 |
| 2.4 |
| Price/Cash Flow |
| 12.33 |
| 21.24 |
| 15.29 |
Data: Fidelity
TDIV past performance
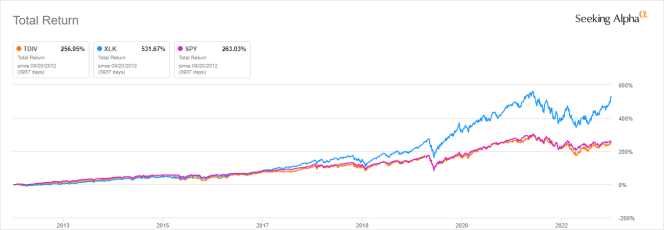
TDIV is almost on par with the S&P 500 in total return since inception. Nonetheless, it has underperformed the sector benchmark by far.
TDIV vs. XLK, SPY since August 2012 (Seeking Alpha)
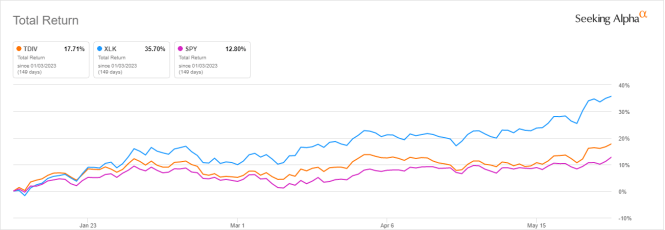
In 2023 to date, it beats the broad index, but still lags XLK.
TDIV vs. XLK, SPY, year-to-date (Seeking Alpha)
Comparing TDIV with a reference strategy based on dividend and quality
In previous articles, I have shown how three factors may help cut the risk in a dividend portfolio: Return on Assets , Piotroski F-score , and Altman Z-score .
The next table compares TDIV since 9/1/2012 with a subset of the S&P 500: stocks with a dividend yield above the average of their respective indexes, an above-average ROA, a good Altman Z-score, a good Piotroski F-score and a sustainable payout ratio. It is rebalanced annually to make it comparable with a passive index.
| since 9/1/2012 |
| Total Return |
| Annual Return |
| Drawdown |
| Sharpe ratio |
| Volatility |
| TDIV |
| 266.75% |
| 12.85% |
| -33.68% |
| 0.77 |
| 16.08% |
| Dividend quality subset |
| 303.48% |
| 13.85% |
| -37.34% |
| 0.86 |
| 15.01% |
Past performance is not a guarantee of future returns. Data Source: Portfolio123
TDIV underperforms the dividend quality subset by 36% in total return. However, TDIV performance is real, whereas the subset is a simulation. My core portfolio holds 14 stocks selected in this subset (more info at the end of this post).
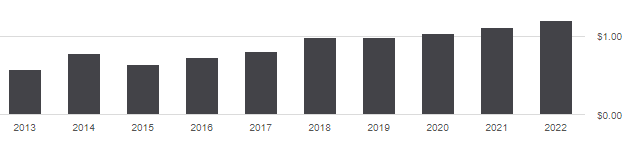
The annual sum of distributions went up from $0.57 per share in 2013 to $1.20 in 2022. This is a 110% growth, whereas the cumulative inflation has been 27% in the same time (based on CPI). Except a pullback in 2015, distributions have increased quite steadily. Although TDIV is not a dividend growth fund, it looks quite attractive in this regard.
TDIV distribution history (Seeking Alpha)
Scanning TDIV with quality metrics
Among the 93 stocks held by the fund, 19 are risky regarding my metrics. In my ETF reviews, risky stocks are companies with at least 2 red flags: bad Piotroski score, negative ROA, unsustainable payout ratio, bad or dubious Altman Z-score, excluding financials and real estate where these metrics are less relevant. Here, risky stocks weigh 17% of asset value, which is rather a bad point.
However, according to my calculations reported below, the ROA is much better than for the S&P 500, and the Altman Z-score is good too. Despite the weight of risky stocks, portfolio quality looks significantly better than the benchmark.
| TDIV |
| SPY |
| Altman Z-score |
| 4.92 |
| 3.45 |
| Piotroski F-score |
| 5.28 |
| 5.7 |
| ROA% TTM |
| 12.27 |
| 7.45 |
Takeaway
First Trust NASDAQ Technology Dividend Index Fund holds 93 dividend stocks in technology and communication. The fund is overweight in semiconductors (38%) and in the top 5 holdings. TDIV looks more attractive than the sector benchmark regarding valuation ratios. It is also superior to the S&P 500 in quality metrics. Furthermore, the dividend growth rate since inception has beaten inflation by a wide margin. However, total return since inception is underwhelming relative to the sector and the broad market.
For further details see:
TDIV: A Dividend ETF Overweight In Semiconductors