XLK - TDV: In Technology Dividend Aristocrats Are Less Overvalued Than The Rest
2023-11-01 17:13:04 ET
Summary
- ProShares S&P Technology Dividend Aristocrats ETF is invested in dividend-growth stocks in technology and related industries.
- The TDV ETF is well-diversified across holdings, and sub-industries as well.
- Valuation is attractive relative to the sector benchmark, but growth, quality, historical performance and liquidity are not.
This article series aims at evaluating ETFs (exchange-traded funds) regarding the relative past performance of their strategies and quality metrics of their current portfolios. As holdings change over time, updated reviews are posted when necessary.
TDV strategy and portfolio
ProShares S&P Technology Dividend Aristocrats ETF ( TDV ) started investing operations on 11/05/2019 and tracks the S&P Technology Dividend Aristocrats Index. It has 37 holdings, a 12-month distribution yield of 1.43% and a total expense ratio of 0.45%. Distributions are paid quarterly. TDV is suitable as a long-term investment, but not for short-term trading: the average trading volume is only about 20k shares/day.
As described by S&P Dow Jones Indices, eligible companies must in the GICS Information Technology sector or in one of the following sub-industries: Interactive Home Entertainment, Interactive Media & Services, Data Processing & Outsourced Services, Transaction & Payment Processing Services.
They must have at least:
- $1 million of median daily volume in the last 6 months,
- 7 consecutive years of increasing total dividend per share every year.
If fewer than 25 stocks are eligible, the index relaxes the dividend growth rule to reach 25 constituents. The index is reconstituted annually and rebalanced quarterly with constituents in equal weight. In the most recent fiscal year, the portfolio turnover rate was 32%.
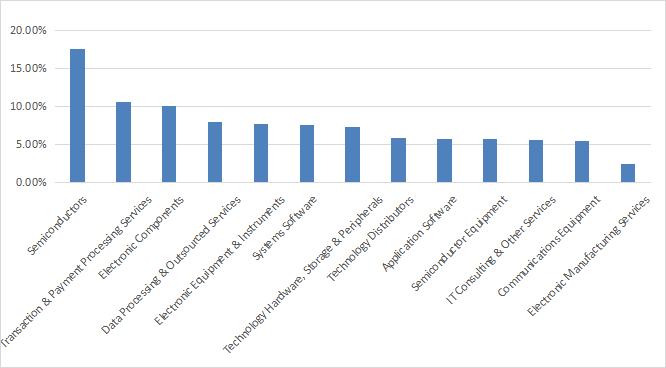
The fund invests exclusively in U.S. companies. All sizes are represented: about 51% of asset value is in large and mega-cap companies, 29% in mid-caps and 20% in small and micro-caps. The heaviest sub-industry is semiconductors with 17.6% of asset value. Other sub-industries are below 11%. The next chart details the composition at GICS level 3.
TDV breakdown at GICS level 3 (chart: author; data: ProShares)
Positions are reset in equal weight on every rebalancing date, but they drift with price action. The current top 10 holdings are listed in the next table with fundamental ratios. These are the constituents with the highest momentum since the last rebalancing. They represent 27.9% of asset value and the largest one is below 3%, so risks related to individual stocks are low.
| Ticker |
| Name |
| Weight% |
| EPS growth %TTM |
| P/E TTM |
| P/E fwd |
| Yield% |
| International Business Machines Corporation |
| 2.88% |
| 449.42 |
| 19.19 |
| 15.23 |
| 4.59 |
| Cass Information Systems, Inc. |
| 2.83% |
| -6.80 |
| 16.87 |
| 17.67 |
| 3.17 |
| Microsoft Corporation |
| 2.83% |
| 11.28 |
| 32.74 |
| 30.16 |
| 0.89 |
| Dolby Laboratories, Inc. |
| 2.77% |
| 15.95 |
| 35.95 |
| 36.94 |
| 1.33 |
| KLA Corporation |
| 2.77% |
| 0.76 |
| 21.05 |
| 20.06 |
| 1.11 |
| Oracle Corporation |
| 2.77% |
| 59.63 |
| 30.76 |
| 18.65 |
| 1.55 |
| Roper Technologies, Inc. |
| 2.77% |
| 10.56 |
| 41.36 |
| 29.33 |
| 0.56 |
| Badger Meter, Inc. |
| 2.76% |
| 28.62 |
| 47.76 |
| 44.41 |
| 0.78 |
| HP Inc. |
| 2.76% |
| -60.75 |
| 11.72 |
| 7.98 |
| 3.99 |
| Amphenol Corporation |
| 2.75% |
| 3.81 |
| 25.99 |
| 27.28 |
| 1.09 |
Historical performance
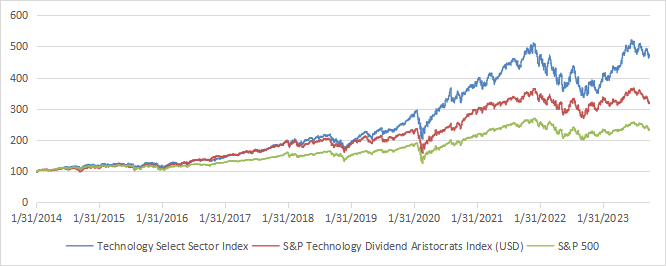
Data history is short: the underlying index was launched in October 2019 and the ETF about one month later. S&P Dow Jones Indices provides simulated historical data from 1/31/2014. The next chart compares TDV underlying index (in red) with those of the sector benchmark XLK (in blue) and SPY (in green).
TDV, SPY and XLK underlying indexes from 1/31/2014 (chart: author; data: S&P Dow Jones Indices)
Based on underlying indexes performance, TDV strategy has underperformed the sector benchmark and outperformed the broad index.
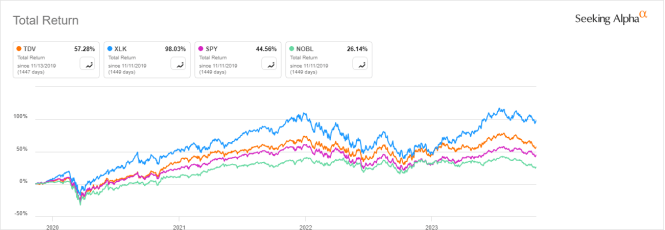
The next chart compares the total return since inception of TDV to XLK, SPY and a broad dividend aristocrat fund: the ProShares S&P 500 Dividend Aristocrats ETF ( NOBL ). TDV beats the two multi-sector funds, but still lags the sector benchmark.
TDV vs XLK, SPY, NOBL (Seeking Alpha)
TDV annual distributions have increased from $0.58 to $0.92 per share between 2020 and 2022. This is an increase of 58.6% in two years, whereas the dividend growth rate of NOBL has been 1.8% and the cumulative inflation has been about 14% (based on CPI) in the same time. It looks amazing, but it is unlikely to represent the fund's long term dividend growth. Based on the latest distributions, unless we see an exceptional one in December, the annual distribution will decrease this year.
TDV distribution history (Seeking Alpha)
Scanning the portfolio
TDV is much cheaper than the sector benchmark regarding the aggregate valuation metrics reported in the next table. The difference in price/sales ratio is especially impressive. This is appreciable in the most overvalued sector, according to my S&P 500 monthly dashboard .
However, aggregate earnings growth and cash flow growth are underwhelming.
| TDV |
| XLK |
| Price / Earnings TTM |
| 23.19 |
| 29.79 |
| Price / Book |
| 4.9 |
| 8.2 |
| Price / Sales |
| 2.08 |
| 6.06 |
| Price / Cash Flow |
| 17.26 |
| 22.03 |
| Earnings growth % |
| 16.58% |
| 21.71% |
| Sales growth % |
| 13.66% |
| 12.11% |
| Cash Flow growth % |
| -1.46% |
| 4.78% |
I have scanned TDV holdings with my preferred quality metrics. In my ETF reviews, risky stocks are companies with at least 2 red flags among: bad Piotroski score, negative ROA, unsustainable payout ratio, bad or dubious Altman Z-score. With these assumptions, there is no risky stock in the portfolio.
Based on my calculation of aggregate metrics (reported in the next table), TDV is inferior to XLK regarding the return on assets. The difference in Altman Z-score and Piotroski F-score is not significant. In conclusion, portfolio quality is slightly inferior to the sector benchmark.
| XLK |
| TDV |
| Altman Z-score |
| 7.29 |
| 6.15 |
| Piotroski F-score |
| 6.13 |
| 6.1 |
| ROA % TTM |
| 15.42 |
| 11.58 |
Takeaway
ProShares S&P Technology Dividend Aristocrats ETF is invested in 37 dividend-growth stocks of the technology sector and related industries. The fund is well-diversified across holdings and sub-industries as well. Semiconductors have the heaviest share. Valuation is attractive, but growth, quality, historical performance and liquidity metrics are inferior relative to the sector benchmark.
For further details see:
TDV: In Technology, Dividend Aristocrats Are Less Overvalued Than The Rest