XLK - TDV: Tech Dividend Aristocrats Now On Hold
Summary
- TDV tracks 40 Technology Dividend Aristocrats that have raised dividends for at least seven consecutive years. It's a lower-risk Technology ETF that comes with a higher 0.45% expense ratio.
- In July, I recommend TDV as a way for dividend investors to take some risk off the table while still capturing a solid level of growth that Technology stocks offered.
- However, earnings expectations for the entire sector have plummeted in the last six months. TDV's 10.48% expected earnings growth rate is lower than what most large-cap value ETFs feature.
- Furthermore, TDV's adjusted EPS Revision Score now sits below the RYT, an equal-weight S&P 500 Technology ETF, and its five-year beta increased from 1.01 to 1.06.
- These fundamental changes are in the wrong direction, and are why I've decided to downgrade my rating on TDV to a hold.
Investment Thesis
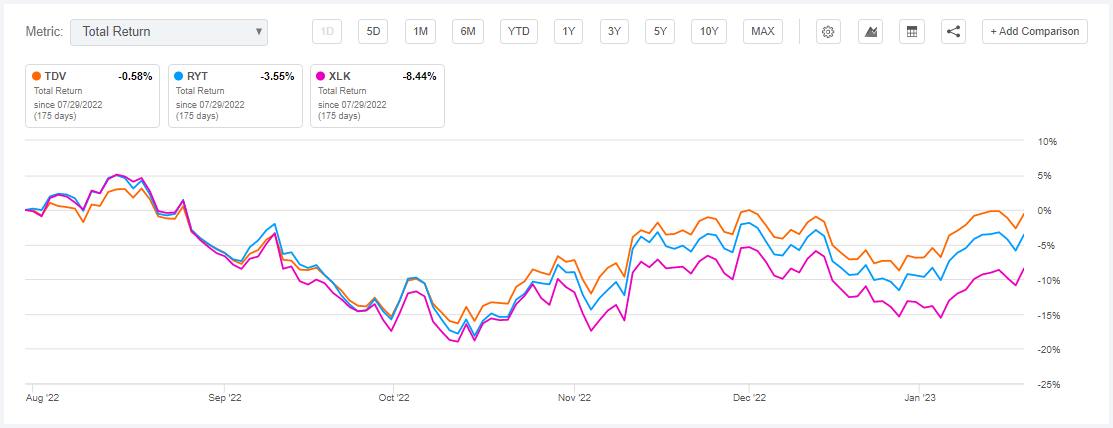
In July 2022, I provided a buy rating for the relatively new ProShares S&P Technology Dividend Aristocrats ETF ( TDV ), expressing interest in how this exclusive group would handle an uncertain market. Six months later, TDV nearly broke even compared to 3.55% and 8.44% declines for the Invesco S&P 500 Equal Weight Technology ETF ( RYT ) and the Technology Select Sector SPDR ETF ( XLK ).
Seeking Alpha
Indeed, this group of 40 Technology companies that have raised dividends for seven years held up better than the broader sector. However, the reason was not dividend consistency. TDV traded at a 4.54-point discount on forward earnings at the time with similar expected earnings growth. Combined with a relatively low 1.01 five-year beta, it was the safest pick in the sector.
Nevertheless, fundamentals change constantly, and the bull case for TDV isn't as strong today. TDV maintains a similar 4.68-point discount on forward earnings compared to RYT but now lags by 3.15% and 2.29% on estimated sales and earnings growth. In addition, Wall Street earnings expectations are weaker than in July. These are the key reasons why I've decided to downgrade TDV to a hold, and I look forward to taking you through the latest numbers.
TDV Overview
Strategy and Key Exposures
TDV tracks the S&P Technology Dividend Aristocrats Index, selecting at least 25 equally-weighted stocks from specific tech-related industries that have increased regular dividends for seven consecutive years. Global Industry Classification Standards don't apply, as two companies from other sectors qualify: Activision Blizzard (ATVI) and PetMed Express ( PETS ), from the Communication Services and Consumer Discretionary sectors.
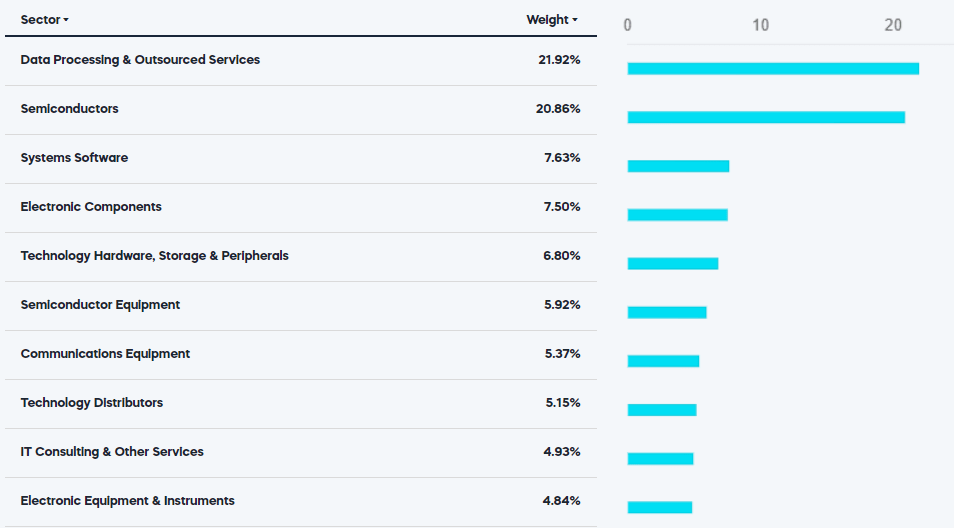
TDV holds nine Data Processing & Outsourced Services companies, including Mastercard ( MA ) and Visa ( V ), that total 22%. In addition, there are 10 Semiconductor and Semiconductor Equipment stocks like KLA Corp ( KLAC ) , Broadcom ( AVGO ), and Intel ( INTC ), totaling 27%. There are 14 unique industries, with the following ten representing 91% of the portfolio.
ProShares
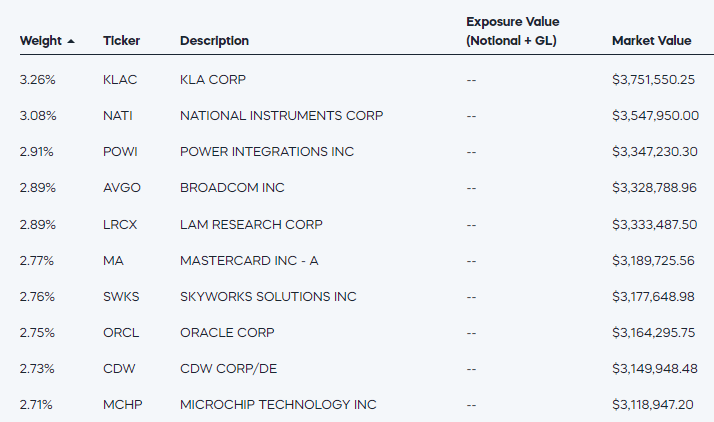
TDV's top ten holdings are below, but since it's an equal-weight ETF, they are merely the best performers since the last quarterly rebalance. You'll notice that TDV includes representatives from all size segments because the Index selects from the S&P Total Market Index.
ProShares
Broadcom and Mastercard fit squarely in the large-cap segment, while Power Integrations ( POWI ) and National Instruments ( NATI ) represent the small- and mid-cap segments. Lately, the composition has been beneficial. Using S&P's $13.6 billion breakpoint for large-cap stocks, TDV's 11 holdings under this threshold gained an average of 4.50% over the last year, not including dividends. In addition to National Instruments, Cass Information Systems ( CASS ) and Badger Meter ( BMI ) gained over 20% and trade close to their 52-week high prices.
Finally, annual reconstitutions occur at the end of January in addition to the quarterly rebalancings. I expect few changes, but TTEC Holdings ( TTEC ) is a likely addition. This Customer Experience "CX" Technology pure play has increased its semi-annual distributions for seven consecutive years. Meanwhile, Activision Blizzard will likely be deleted as its $0.47 per share annual distribution remained the same as in 2021. Western Union ( WU ) has also paid the same $0.235 per share dividend for eight straight quarters. Other than these three, today's composition should remain the same this year.
Performance History
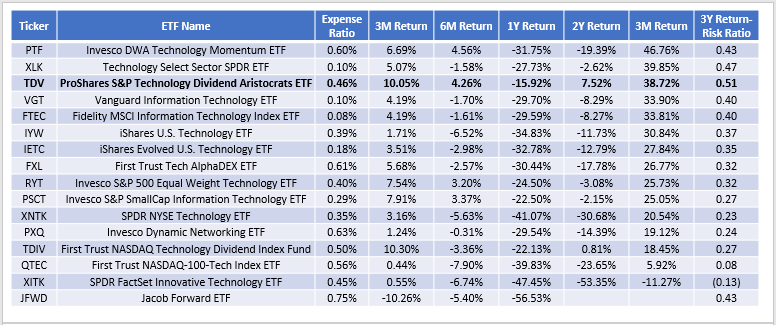
There are 16 broad-based U.S. Technology ETFs, summarized by their historical returns in the table below and sorted by their three-year returns. TDV's 38.72% gain through December 2022 was third-best behind XLK and the Invesco DWA Technology Momentum ETF ( PTF ). The Vanguard Information Technology ETF ( VGT ), the largest by AUM, was fourth-best at 33.90%.
The Sunday Investor
TDV's three-year return-to-risk ratio, calculated by dividing its annualized return by its annualized standard deviation, was the strongest at 0.51. That's a key selling point, too, as dividend investors want the growth Technology stocks offer but aren't willing or able to accept high volatility.
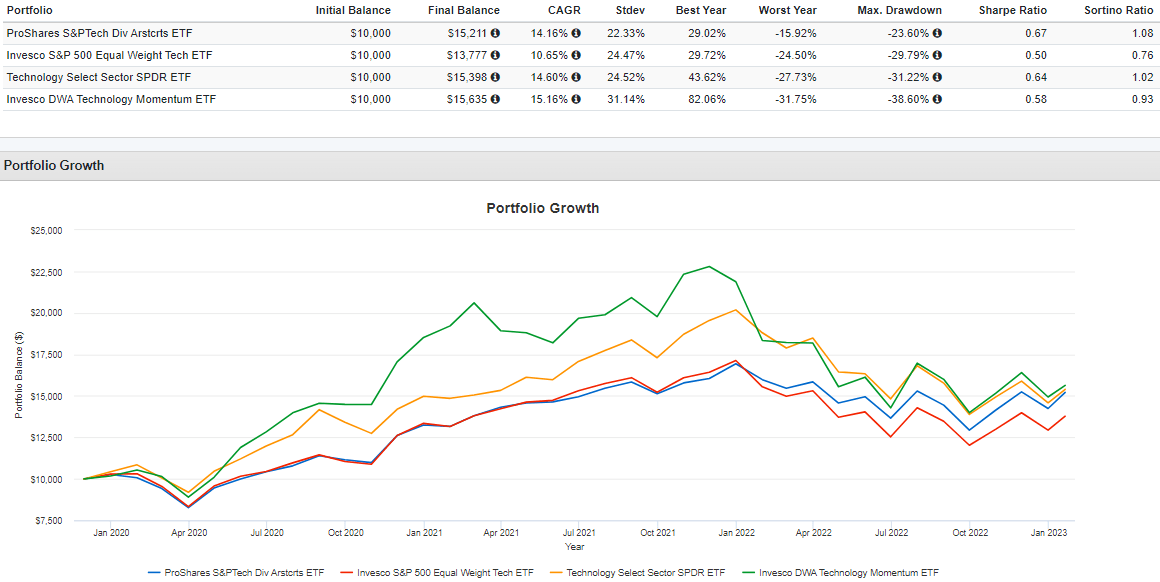
Since its inception, TDV gained an annualized 14.16% compared to 10.65% and 14.60% for RYT and XLK. As discussed, PTF was the best performer at 15.16%, but it came with significantly higher volatility. Its 31.14% annualized standard deviation is about 50% higher than TDV's.
Portfolio Visualizer
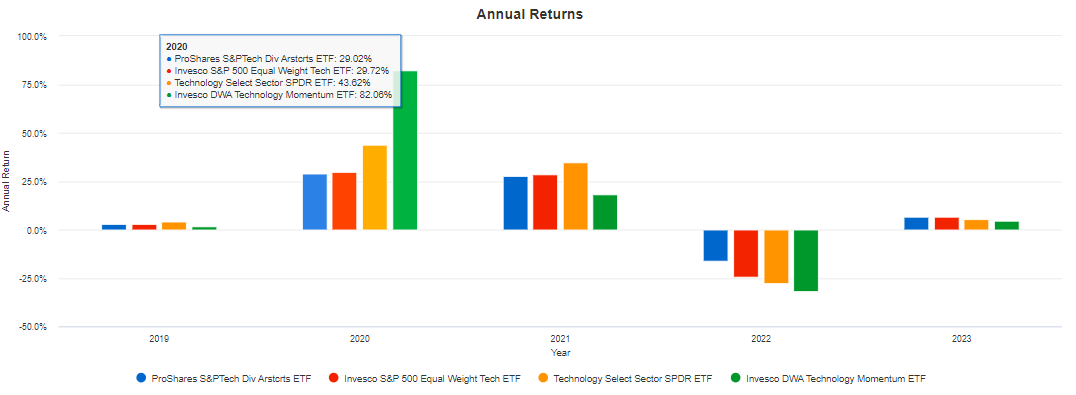
Besides, most gains occurred in 2020, when PTF gained 82.06%. TDV has been closing the gap each year and is surprisingly the best performer of the four this year, up 6.73%.
Portfolio Visualizer
Dividends
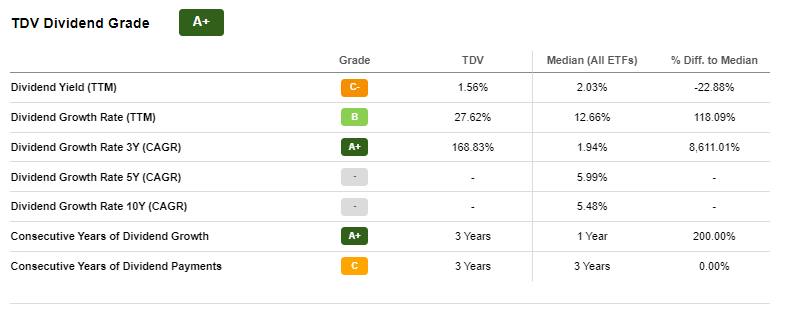
TDV, like most ProShares ETFs, has a high expense ratio. The 0.45% significantly reduces net distributions, and even though its constituents currently yield 2.06%, TDV's trailing dividend yield is only 1.56%. Relative to the Technology sector, it's high but hardly a selling point for income investors.
Seeking Alpha
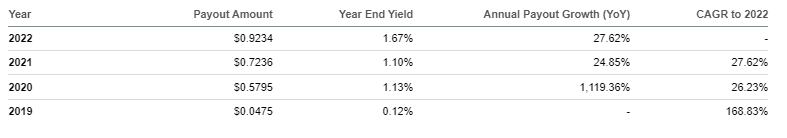
The 168.83% three-year dividend growth rate quoted above is technically correct since TDV only pays an annual dividend. However, the 26.23% two-year growth rate is more accurate, and even that is too generous considering how current constituents have raised by 12.59% over the last five years. It's easier for a dividend ETF to achieve 20%+ growth consistently if it frequently rebalances into the highest-yielding stocks. However, since TDV doesn't do that, investors should expect much lower growth going forward.
Seeking Alpha
Fundamental Analysis
In July, TDV traded 4.55 points cheaper on a forward earnings basis than RYT (20.75x vs. 25.30x) and had slightly lower estimated earnings growth (17.54% vs. 18.84%). Also, I viewed its 1.01 five-year beta as attractive, given the uncertain environment. Now, consider how TDV's fundamentals have changed by comparing these selected statistics for its top holdings.
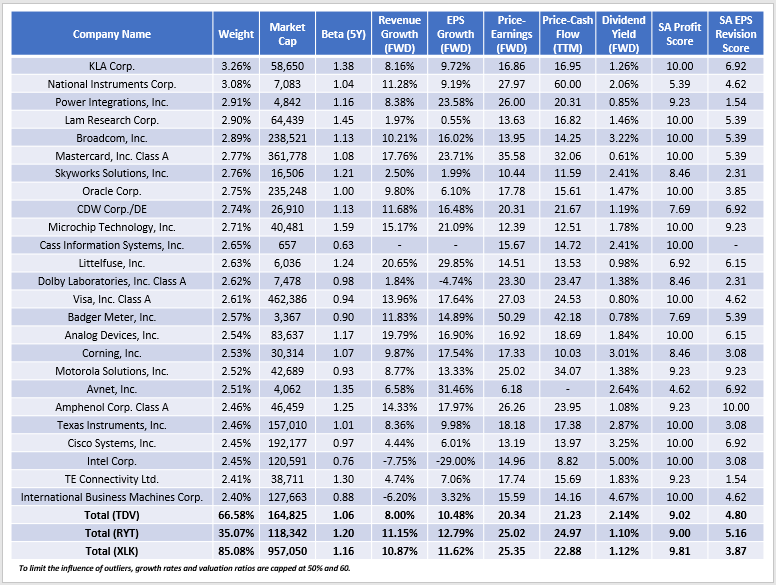
The Sunday Investor
I want to make the following observations:
1. TDV's five-year beta has increased from 1.01 to 1.06. It's an unfortunate change because a low beta was one of the ways TDV differentiated itself from every other Technology ETF. Now, that award goes to the First Trust NASDAQ Technology Dividend Fund ( TDIV ), which has a 1.01 beta.
2. Expected earnings growth has deteriorated for all U.S. Technology ETFs. TDV decreased from 17.54% to 10.48%, a 7.06% drop. Meanwhile, RYT fell from 18.84% to 12.79%, a 6.05% decline. It's not much different, but investors can also achieve better earnings growth by investing in low-cost value ETFs like the Vanguard S&P 500 Value ETF ( VOOV ). Arguably, the growth of the whole sector is so low that the risk-reward isn't worth it anymore.
3. TDV's forward earnings valuation discount relative to RYT and XLK is 4.68 and 5.01 points, about where it was in July. Its Profitability Score, derived using individual Seeking Alpha Profitability Grades, remains about the same as RYT (9.02/10 vs. 9.00/10).
4. Wall Street earnings expectations, as measured by Seeking Alpha's EPS Revision Grades, substantially declined. TDV's normalized EPS Revision Score fell from 6.14/10 to 4.80/10, a 1.34-point drop. RYT's fell from 5.91 to 5.16, a 0.75-point decrease. Wall Street may be too pessimistic, but I treat this as a leading indicator and a reason to take some risk off the table.
Investment Recommendation
In July, I recommended buying because it was a good way for dividend investors to include low-volatility Technology stocks in their portfolios for a fair price. TDV held up reasonably well since, almost breaking even compared to an 8.44% decline for XLK, a popular market-cap-weighted Technology ETF.
However, in the last six months, there has been a remarkable shift in earnings growth expectations affecting all U.S. Technology ETFs. TDV's is barely double-digit, while cheaper, broad-based value funds like VOOV offer superior growth potential for a more reasonable valuation. Furthermore, I'm concerned that TDV's poor EPS Revision score will lead to a substantial price decline should this earnings season disappoint. For me, it's not worth the risk; therefore, I've decided to downgrade my rating on TDV to a hold. Thank you for reading, and I look forward to answering any questions in the comments section below.
For further details see:
TDV: Tech Dividend Aristocrats Now On Hold