DIOD - TDV: Technology Dashboard For August
2023-08-20 04:41:10 ET
Summary
- Electronic equipment is the most attractive industry in an overvalued sector.
- Fast facts on TDV, a technology ETF mitigating risks.
- 8 tech stocks cheaper than their peers in August.
This monthly article series shows a dashboard with aggregate industry metrics in information technology. It may also serve as a top-down analysis of sector ETFs like Technology Select Sector SPDR ETF ( XLK ) and ProShares S&P Technology Dividend Aristocrats ETF (TDV), whose holdings are used to calculate these metrics.
Shortcut
The next two paragraphs in italic describe the dashboard methodology. They are necessary for new readers to understand the metrics. If you are used to this series or if you are short of time, you can skip them and go to the charts.
Base Metrics
I calculate the median value of five fundamental ratios for each industry: Earnings Yield ("EY"), Sales Yield ("SY"), Free Cash Flow Yield ("FY"), Return on Equity ("ROE"), Gross Margin ("GM"). The reference universe includes large companies in the U.S. stock market. The five base metrics are calculated on trailing 12 months. For all of them, higher is better. EY, SY and FY are medians of the inverse of Price/Earnings, Price/Sales and Price/Free Cash Flow. They are better for statistical studies than price-to-something ratios, which are unusable or non-available when the "something" is close to zero or negative (for example, companies with negative earnings). I also look at two momentum metrics for each group: the median monthly return (RetM) and the median annual return (RetY).
I prefer medians to averages because a median splits a set in a good half and a bad half. A capital-weighted average is skewed by extreme values and the largest companies. My metrics are designed for stock-picking rather than index investing.
Value and Quality Scores
I calculate historical baselines for all metrics. They are noted respectively EYh, SYh, FYh, ROEh, GMh, and they are calculated as the averages on a look-back period of 11 years. For example, the value of EYh for hardware in the table below is the 11-year average of the median Earnings Yield in hardware companies.
The Value Score ("VS") is defined as the average difference in % between the three valuation ratios (EY, SY, FY) and their baselines (EYh, SYh, FYh). The same way, the Quality Score ("QS") is the average difference between the two quality ratios (ROE, GM) and their baselines (ROEh, GMh).
The scores are in percentage points. VS may be interpreted as the percentage of undervaluation or overvaluation relative to the baseline (positive is good, negative is bad). This interpretation must be taken with caution: the baseline is an arbitrary reference, not a supposed fair value. The formula assumes that the three valuation metrics are of equal importance.
Current Data
The next table shows the metrics and scores as of last week's closing. Columns stand for all the data named and defined above.
| VS |
| QS |
| EY |
| SY |
| FY |
| ROE |
| GM |
| EYh |
| SYh |
| FYh |
| ROEh |
| GMh |
| RetM |
| RetY |
| Hardware |
| 2.02 |
| -41.61 |
| 0.0439 |
| 0.9163 |
| 0.0324 |
| 2.11 |
| 35.25 |
| 0.0353 |
| 0.9638 |
| 0.0374 |
| 6.65 |
| 41.44 |
| -2.26% |
| 17.60% |
| Comm. Equip. |
| -13.24 |
| -0.61 |
| 0.0309 |
| 0.2772 |
| 0.0235 |
| 16.59 |
| 60.11 |
| 0.0312 |
| 0.2741 |
| 0.0391 |
| 16.02 |
| 63.13 |
| -10.54% |
| -15.66% |
| Electronic Equip. |
| -4.42 |
| 0.33 |
| 0.0495 |
| 0.7704 |
| 0.0262 |
| 18.22 |
| 22.07 |
| 0.0412 |
| 0.7736 |
| 0.0391 |
| 13.14 |
| 35.60 |
| -6.36% |
| 0.60% |
| Software |
| -28.71 |
| 4.61 |
| 0.0206 |
| 0.1101 |
| 0.0235 |
| 20.26 |
| 81.94 |
| 0.0258 |
| 0.1646 |
| 0.0350 |
| 17.81 |
| 85.85 |
| -6.57% |
| -8.02% |
| Semiconductors |
| -11.05 |
| 5.63 |
| 0.0461 |
| 0.1968 |
| 0.0274 |
| 27.76 |
| 59.73 |
| 0.0450 |
| 0.2361 |
| 0.0338 |
| 24.04 |
| 62.34 |
| -8.75% |
| -0.24% |
| IT Services |
| -30.46 |
| 5.21 |
| 0.0298 |
| 0.1896 |
| 0.0221 |
| 28.98 |
| 55.72 |
| 0.0375 |
| 0.3155 |
| 0.0320 |
| 26.52 |
| 55.09 |
| -4.49% |
| -1.69% |
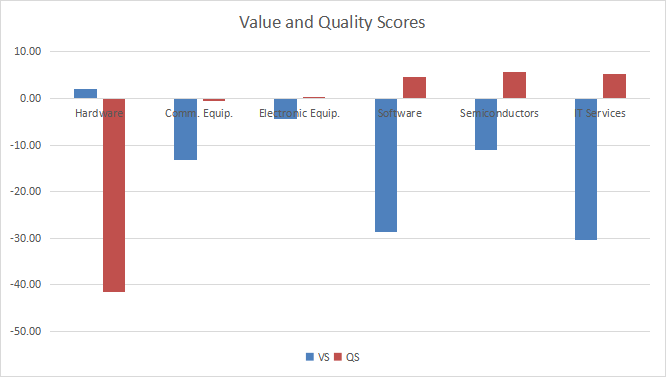
Value And Quality Chart
The next chart plots the Value and Quality Scores by industry (higher is better).
Value and Quality in technology (chart: author; data: Portfolio123)
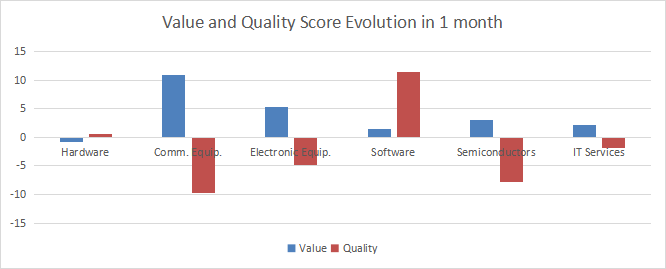
Evolution Since Last Month
Communication equipment has improved in value score, but deteriorated in quality. Other notable moves are a quality score improvement in software, and a deterioration in semiconductors.
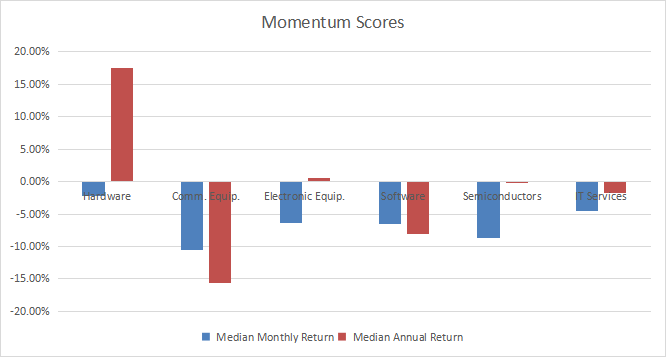
Momentum
The next chart plots momentum scores based on median returns.
Interpretation
Technology is the second most overvalued sector according to my S&P 500 monthly dashboard . However, the hardware and electronic equipment industries are close to their historical baseline in valuation. Hardware has an issue with quality, though: its score is far below the baseline. Communication equipment and semiconductors are moderately overvalued, by less than 15% relative to 11-year averages. Software and IT services are the most overvalued subsectors. Their quality scores are good, but not high enough to justify such overvaluation
Fast Facts on TDV
ProShares S&P Technology Dividend Aristocrats ETF ( TDV ) started investing operations on 11/05/2019 and tracks the S&P Technology Dividend Aristocrats Index. It has 38 holdings, a 12-month distribution yield of 1.36% and a total expense ratio of 0.45%. Distributions are paid quarterly.
As described by S&P Dow Jones Indices, eligible companies must be in the GICS Information Technology sector or in one of three internet industries classified in the Communication Services sector. They must have increased dividends every year for at least seven consecutive years and have a 6-month median daily volume above $1 million. The number of years of dividend increase may be reduced if less than 25 companies are eligible. The index is reconstituted annually and rebalanced quarterly with constituents in equal weight.
Positions are in equal weight just after every rebalancing, but they may drift with price action. The next table shows the top 10 holdings now with their current weights and fundamental ratios. These are the constituents with the best momentum since the last rebalancing. Together, they represent 28.3% of asset value, and the heaviest one weighs about 3%. Risks related to top holdings are much lower than for capital weighted ETFs like XLK, where Apple Inc. ( AAPL ) and Microsoft Corp. ( MSFT ) represent almost 45% of asset value together.
| Ticker |
| Name |
| Weight |
| EPS growth %TTM |
| P/E TTM |
| P/E fwd |
| Yield% |
| CDW Corp. |
| 2.89% |
| 7.07 |
| 25.46 |
| 20.54 |
| 1.18 |
| KLA Corp. |
| 2.89% |
| 10.00 |
| 19.83 |
| 21.34 |
| 1.09 |
| Lam Research Corp. |
| 2.89% |
| 1.21 |
| 19.70 |
| 23.77 |
| 1.06 |
| Broadridge Financial Solutions, Inc. |
| 2.88% |
| 16.42 |
| 33.80 |
| 23.38 |
| 1.79 |
| Cisco Systems, Inc. |
| 2.86% |
| 9.02 |
| 17.91 |
| 13.56 |
| 2.83 |
| National Instruments Corp. |
| 2.86% |
| 71.11 |
| 43.61 |
| 25.15 |
| 1.90 |
| International Business Machines Corp. |
| 2.78% |
| -64.96 |
| 65.57 |
| 14.77 |
| 4.70 |
| CSG Systems International, Inc. |
| 2.77% |
| 56.07 |
| 24.37 |
| 15.30 |
| 2.10 |
| Avnet, Inc. |
| 2.76% |
| 18.72 |
| 5.88 |
| 8.47 |
| 2.39 |
| Badger Meter, Inc. |
| 2.76% |
| 20.36 |
| 60.63 |
| 52.94 |
| 0.68 |
Data calculated with Portfolio123
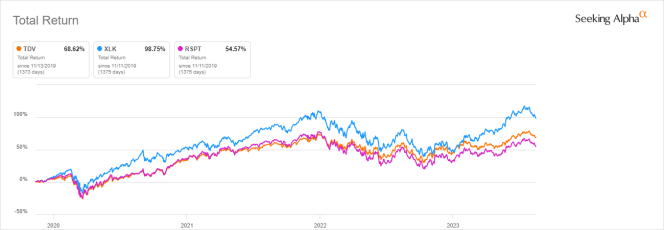
Since inception in November 2019, TDV has underperformed XLK, but it beats another equal-weight technology ETF: Invesco S&P 500 Equal Weight Technology ETF ( RSPT ).
In summary, TDV is a good fund for investors seeking exposure to the information technology sector while limiting volatility. It mitigates risks with an equal-weight methodology and a quality-focused strategy.
Dashboard List
I use the first table to calculate value and quality scores. It may also be used in a stock-picking process to check how companies stand among their peers. For example, the EY column tells us that a hardware company with an earnings yield above 0.0439 (or price/earnings below 22.78) is in the better half of the industry regarding this metric. A Dashboard List is sent every month to Quantitative Risk & Value subscribers, with the most profitable companies standing in the better half among their peers regarding the three valuation metrics at the same time. The list below was sent to subscribers several weeks ago based on data available at this time.
| Belden, Inc. |
| Jabil Inc. |
| CarGurus, Inc. |
| Veeco Instruments Inc. |
| Vishay Intertechnology, Inc. |
| Diodes Inc. |
| Gen Digital Inc. |
| InterDigital, Inc. |
It is a rotational model with a statistical bias toward excess returns on the long-term, not the result of an analysis of each stock.
For further details see:
TDV: Technology Dashboard For August