OMRNY - TE Connectivity: Connecting The World One Step At A Time
2023-06-21 05:16:18 ET
Summary
- TE Connectivity Ltd. is well-positioned for growth due to the move towards electrification, AI, and renewable energy, as well as its global presence in high growth markets like China.
- The company's diverse business segments and strong geographical exposure provide stability and potential for capturing market share from smaller regional players.
- TE Connectivity's stock offers an attractive annualized return using my model of around 10%, including dividends, making it a solid long-term investment.
- As a narrow moat market share leader, TE is poised to benefit from the widespread adoption of EV and AI.
Intro and Investment Thesis
Founded in Schaffhausen, Switzerland, TE Connectivity Ltd. ( TEL ) is a corporation that designs and manufactures connectivity and sensor solutions worldwide. TE operates in three business segments with their own respective end markets, including: Transportation Solutions, Industrial Solutions, and Communications Solutions. Within Transportation Solutions, TE offers products applied in the automotive, commercial transportation, and sensors markets. Moreover, in the Industrial Solutions segment, there is factory automation, aerospace & defense, energy infrastructure, and medical. In Communications Solutions, TE supplies electronic components for the data and devices, and appliances markets. At just over a market capitalization of $40 billion and a share price of roughly $135, TEL captures a healthy portion of the connector market share.
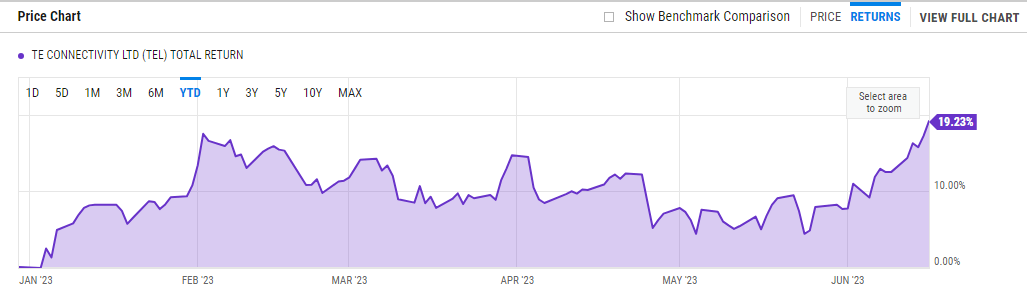
TEL YTD Return (YCharts)
Up around 19% year-to-date, TEL has had a really solid six months. The stock has been able to run up with the general market, which on technical terms just started a new bull market and is near all-time-highs. Some important points to why I think TE is an attractive stock at the moment include the move towards electrification, AI, and renewable energy. TE’s global presence in markets like China warrants the stock to be a great buy moving forward due to the fast tech adaption in the automotive and AI businesses.
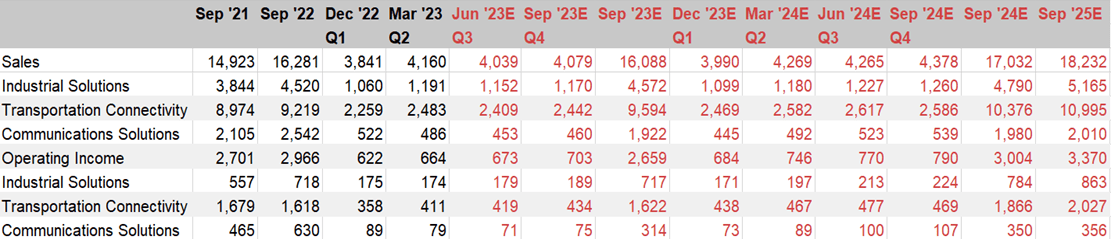
Company Snapshot (Data From FactSet)
Due to the slowing of car production to roughly 80-85 million cars in the past couple of years, TE has had to adapt to combat this consolidation. TE estimates they make $140 per EV and only $60 from ICE vehicles, which will compensate for the plateauing production. Next, The expected $250 million in restructuring for the year will go towards optimizing manufacturing and improving the company’s cost structure by shifting manufacturing plants to optimal locations. EPS and operating margins have already been depressed due to these restructuring headwinds as well as recent F/X troubles and are priced in the stock. Moreover, TE continues to pay an industry-competitive dividend of 1.8% and plans to keep buying back shares sequentially.
Segment Breakdown and Geographical Exposure
Transportation Solutions (60% of sales)
This segment comprises three primary end markets: Automotive, Commercial Transportation, and Sensors. Terminals, sensors, antennas, application tooling, and connector systems are most of the products sold in the Transportation Solutions segment.
Industrial Solutions (28% of sales)
This segment contains four broad sub-segments: Industrial Equipment, Aerospace, defense & marine, Energy, and Medical. The products primarily sold in this segment are terminals, connector systems, interventional medical components, and wire and cable.
Communications Solutions (12% of sales)
The Communications Solutions segment supplies electronic components for the D&D and appliance markets. Some products sold in this space are terminals, connectors, relays, antennas, and heat shrink tubing. The end markets in this segment are Data and Devices (D&D), and Appliances.
TE Connectivity is a company that is well positioned and balanced geographically, with around an even 1/3 split across the Americas, APAC, and EMEA regions. More specifically, about 35% of sales come from Asia/Pacific, 35% from Europe/Middle East/Africa, and 30% from the Americas. Below is a better look of this breakdown:
TEL Revenue Exposure by Region (Data From FactSet)
Moving forward, TE will be honing in on the APAC region to tap into the EV adaption because this region is expected to produce the highest percentage of electric cars in the near future. TE's main competitor, Amphenol (NYSE: APH ), has about 80% of its total sales from the America sand APAC region, with much less European exposure. This geographical exposure will benefit TE in the future because it will shield the company from any headwinds occurring in certain regions around the world and allow for the company to capture market share from smaller, regional players.
One of my favorite parts about TE Connectivity is its business segment diversity. Across the Transportation, Industrial, and Communications Solutions segments, TE maintains a strong position by offering a wide range of products to a substantial customer-base. Below is a look at the sales and operating profit/margins breakdown by segment.
Sales by Business Segment (Data From FactSet)
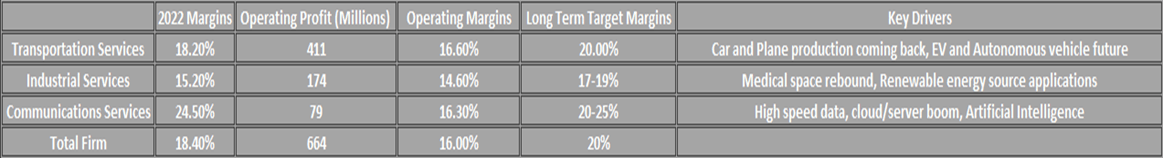
Operating Profits/Margins by Business Segment (FactSet and Company 10q)
As you could see, roughly 60% of company sales come from its transportation solutions segment, most from its automotive end market (~70%), and the rest from commercial transportation and sensors. The next largest segment would be the industrial solutions which contributes about 28% of TE's top line through the industrial equipment, aerospace & defense/marine, energy, and medical sub-segments. The smallest segment for TE is the communications solutions segment which has underperformed in the last couple of quarters, compressing its share to only 12% of the company's sales. This segment is made up of data and devices, and appliances.
Margins across all three business segments compressed from Y/Y comps. Margins in communications services were hit the most because of tough year-over-year comps to covid numbers in the D&D and home appliance spaces. On top of an 8% margin compression, there was also a 20% organic sales decline Y/Y. Management noted on a call at the Alliance Bernstein strategic decisions conference that transportation is seeing headwinds from weak car production (well below pre-covid levels), and non-dynamic real time pricing. Pricing is adjusted real time in industrials and communications. Price hikes will come into effect in the next few quarters. Pricing power will bring back margins to 18% very soon. Raw material price increases as well as freight and logistics inflation hindered operating margins in the automotive sub-segment the most. Overall, TE has a lot of exciting catalysts coming its way over the next couple of years that can bolster its top line and adjusted operating margin growth. Pricing power coming into full effect, electrification, renewable energy applications, and AI are only a few of TE’s key drivers.
TE Connectivity's Position for the Electrification Boom
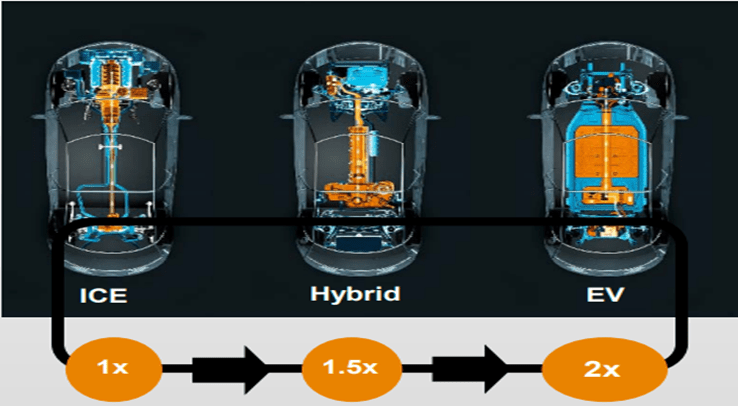
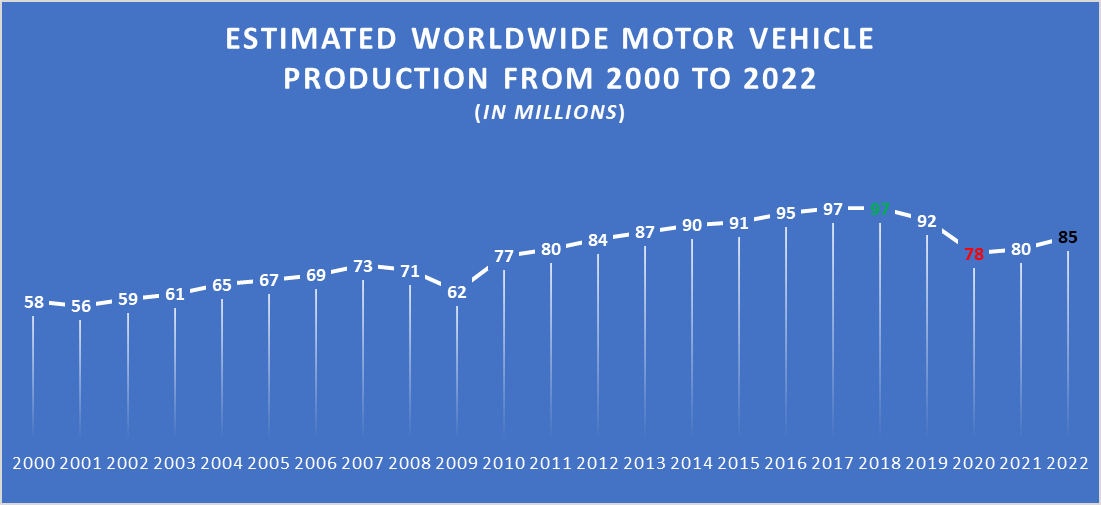
With Europe targeting for 100% of car sales and production to be EVs by 2040, TE's leading market share is poised to outperform. Goldman put out a research report that 100% of Europe's car sales ratio will be EV, while 85% will be in the US, and 80% in Japan. They target global sales to be 61% EV by 2040. At the current pace of adoption, this 61% number would be attainable and would be huge for both the top and bottom line for TE. The company makes an average of $60 for its ICE vehicle (internal combustion engine) content, $110-120 for its hybrid content, and $140-160 for its EV content. CEO, Terrence Curtin, stated that the company makes about $80 right now per vehicle, which is a combination of all types of vehicles spanning from ICE to EV. Moreover, with car production peaking at 97 million vehicles produced pre-covid (2017-2018), and hitting a trough of 78 million in 2020, and plateauing off at about 80-85 million in present day.
TE Content Per Vehicle (Company Investor Presentation)
Below is a look at this trend in global car production since 2000.
Worldwide Car Production 2000-2022 (Statista, Excel)
TE Relative Valuation and Group Comps
TEL continues to trade at a discount relative to the market in terms of EV/EBITDA, P/E, and P/FCF . TEL also pays out an attractive dividend, which is higher than the market average. I am referring to the S&P 500 index (NYSE: SPX ) when speaking about the "market."
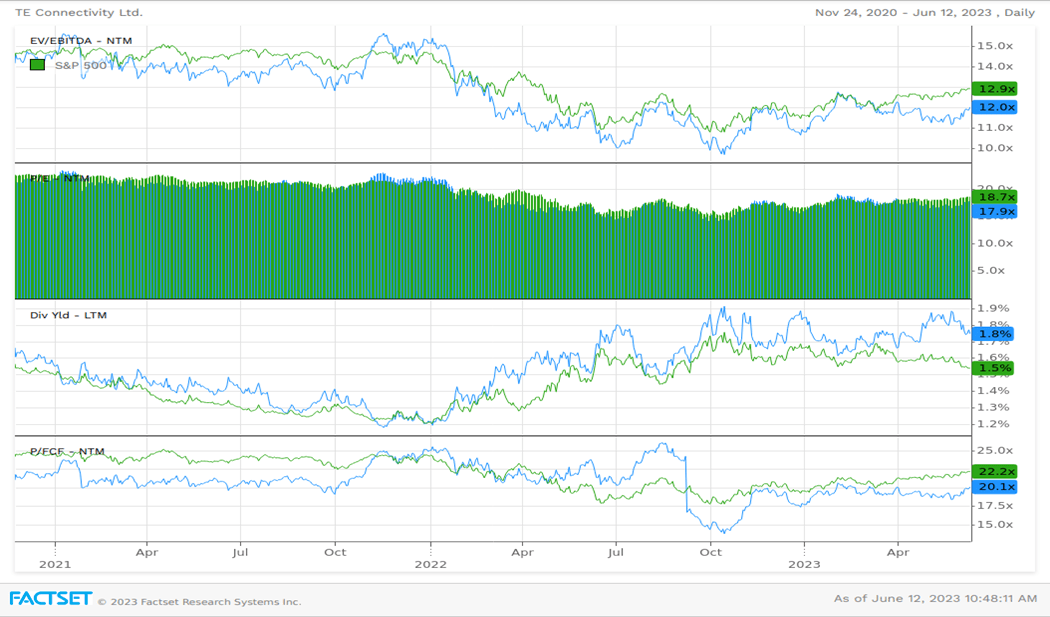
TEL Valuations (Blue) Relative to the S&P 500 (Green) from 11/2020-6/2023 (Data From FactSet)
When looking at the chart above, you see that TEL is currently trading at a discount to the S&P's next-twelve-month EV/EBITDA ratio of 12.9x. TEL's fwd EV/EBITDA sits right around 12.0x. Moreover, on a fwd P/E perspective, TE also trades at a discount at around 17.9x compared to the market multiple of 18.7x. TE also pays an attractive 1.8% dividend that has grown steadily over time and has kept pace with share price increases.
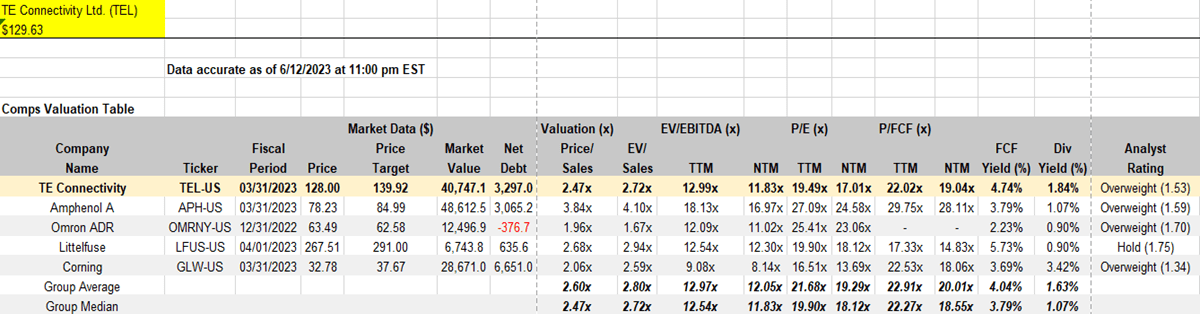
TE Connectivity Comparable Table (Data From Seeking Alpha, and FactSet)
Looking above, TE trades relatively in line with its significant peers. Some of its peers include: OMRON ( OTCPK:OMRNY ), Littelfuse (NYSE: LFUS ), Amphenol, and Corning (NYSE: GLW ). The stock trades at a slight discount compared to group means and medians for P/E ratio, but conforms with group averages in P/S, EV/Sales, EV/EBITDA, and P/FCF metrics. Its impressive 4.74% FCF yield and 1.84% dividend yield stand out to me as an owner of the name. It is relevant to note that most analysts on the street are either bullish/overweight, or neutral/equal weight with price targets averaging at around $142/share.
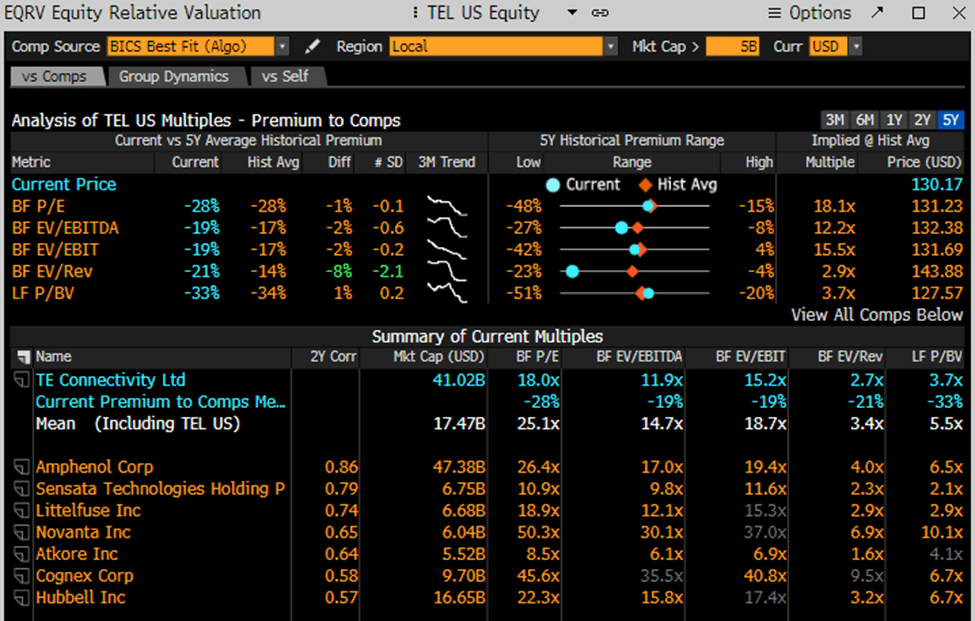
TE Relative Valuation 5yr Historical Premium to Comps (Bloomberg)
Using the equity relative valuation function in Bloomberg, you could see that TEL has traded at a discount across multiple relevant metrics in the last 5 years compared to its best fit comps. Bloomberg sources its comps using BICS Best Fit Algorithm. On a 5 year basis, TEL historically trades at a 28% discount for a blended forward P/E (a weighted average of the most recent actual reported earnings plus the closest quarterly forecast earnings), 17% bf EV/EBITDA, 17% bf EV/EBIT, 14% EV/Revenues, and 34% bf P/BV. Currently, the stock is trading just above these historical discounts, with the biggest discrepancy coming from EV/Revenues. The implied multiples shown on the right use the group mean times the amount of discount (ie: 25.1x times 1-0.28 = 18.1x). This Bloomberg snapshot makes TEL a hold and shows that the stock usually trades at a relative discount to its peers.
My Price Targets and Annualized Returns Till 2030
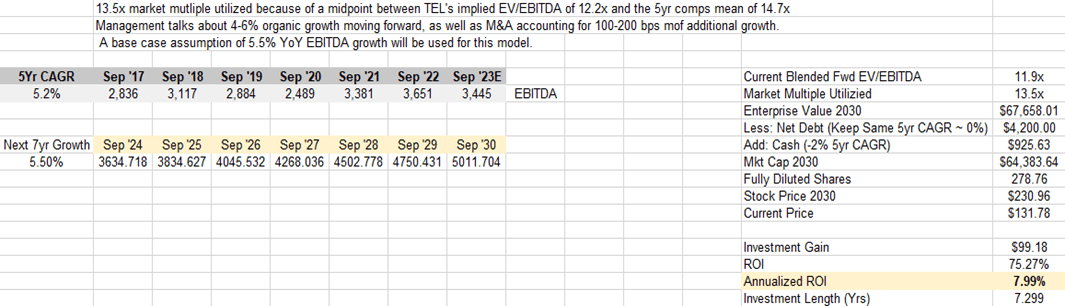
In this section, I will show screenshots of my excel file where I use an EV/EBITDA valuation and P/E valuation to value TE's stock out to 2030. Below conveys the EV/EBITDA valuation and expected annualized ROI. The multiples used are base case scenarios.
EV/EBITDA Valuation (FactSet, Excel)
A reasonable 13.5x EV/EBITDA multiple was used to price out the stock to 2030. I used 5.50% as a compounded annualized growth rate till 2030, which combines both the last 5yr CAGR of 5.2% and the expected 4-6% organic growth rate moving forward+ M&A accounting for an additional 100-200 bps to this number. Using these inputs, I get an EBITDA just north of $5 billion and a future share price of $230.96. Using the share price at the time of $131.78 and this future share price, this gets a total ROI of 75.37% and an Annualized ROI of 7.99% for an investment length of 7.299 years.
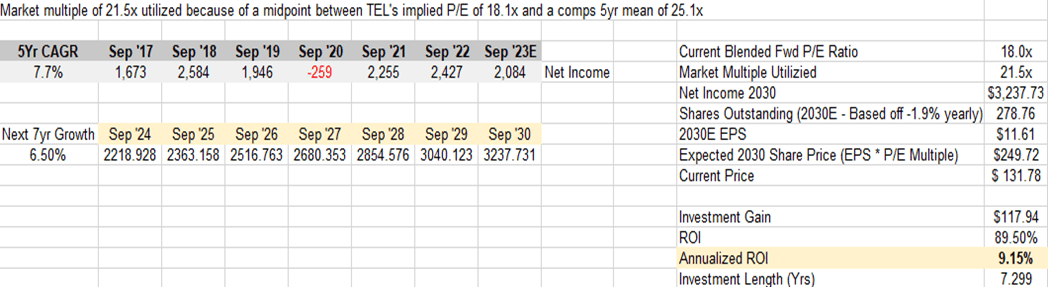
For my P/E valuation model, I used a modest 21.5x multiple, considering TE will have its EV automotive business ramping up by 2030 and will have a more attractive growth trajectory in my opinion.
P/E Valuation (FactSet)
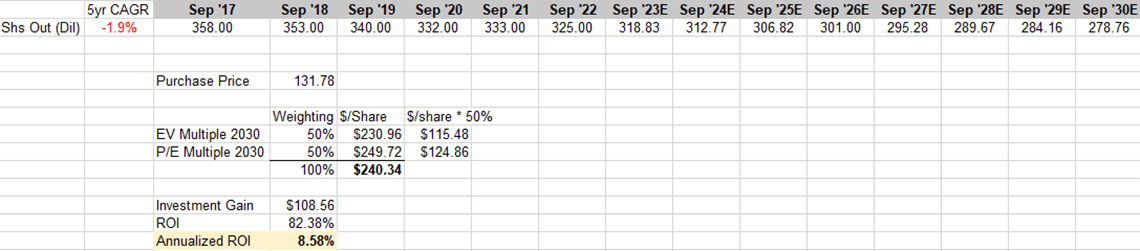
The P/E model comes out with a more attractive 9.15% annualized ROI, and a return on investment of 89.50%, excluding dividends. For net income growth, I used 6.50% next 7yr growth because of expanding operating margins, and attractive market share standing in several growth areas moving forward. Below is an equal weighting model of both valuation methods, which comes to a share price of $240.34 and a respectable annualized ROI of 8.58%.
Combined Equal Weighting Annualized ROI (FactSet)
On an annualized return basis, TE’s stock would return the investor a respectable 8.58% using base case assumptions for EV/EBITDA and P/E growth numbers and market multiples from the present day to the fiscal year-end 2030. Using an equal 50% weight for both models, the annualized ROI comes out to 9.15% (P/E) and 7.99% (EV/EBITDA) and an equal weight of 8.58%. This return excludes dividends, which can be expected to be in the range of 1.6%-1.8%, given the expected share price appreciation and the 5yr CAGR of 6.6% for dividends per share. This above-industry average dividend would add additional support to the already solid return projections and bring the annualized return to around 10%.
Concluding Remarks
Overall, I think it is a great time to get in TE Connectivity Ltd.'s stock. While it has run up nicely in 2023 and its relative valuation seems fairly valued, I believe investors are not pricing in how huge this EV and AI play will be. Not only is the company strategically acquiring bolt-on companies and restructuring to better its operations, it also pays out a solid dividend, and is a market share leader. Characterized as a "narrow moat" company, TE will likely be capable to maintain its competitive advantage over the market for the next decade, which will be the most important time for the company's development in my opinion. It is a great time to purchase shares for the long run catalysts and avoid mistiming a potential run-up.
For further details see:
TE Connectivity: Connecting The World One Step At A Time