TEL - TE Connectivity: Impact Of Electrification Boom A Way Off
2023-05-06 07:21:09 ET
Summary
- TE Connectivity is well placed to benefit from increasing electrification of transport and industry.
- In the short term, auto production well below pre COVID levels, and exchange rate headwinds are among factors limiting earnings growth.
- The longer term future for TE Connectivity remains bright, but short to medium term issues are likely to weigh on the share price for a while yet.
Investment Thesis
Background
In an article back on Sep.30, 2021, " TE Connectivity Stock: A Bright Future ", I referred to an observation I made in August 2020, in relation to corporations likely to benefit from decarbonisation and electrification of transport and industry generally. Here is what I said about TE Connectivity Ltd. ( TEL ),
TE Connectivity's Core Automotive Business Is Sure To Benefit
Looking ahead to 2030, where I see outstanding opportunity is in the paradigm shift,
- from fossil fuel powered transport to the electrification of all modes of transportation; and
- to increasing automation of transportation of people and goods, facilitated by electrification.
The internal combustion engine may be today's "buggy whip", and the shares of suppliers of components to ICE powered vehicle manufacturers are presently out of favor. But I can perceive at least one component supplier will only see improvement in its business, with the automation and electrification of transportation in all its forms. That company is TE Connectivity Ltd ((TEL)), a supplier of sensors and electronics to a range of industries, including automotive, its core market. It supplies to manufacturers of ICE, BEV and hybrid vehicles. TE Connectivity, in its earnings call on July 29 , estimated the value of its inputs supplied for BEVs is twice the value of its inputs for ICE vehicles, and one and one-half times for hybrids. And yet, the title of the most recent article on this company on SA reads, " TE Connectivity: Collapse Of Core Market Spells Trouble Ahead ".
The TEL share price was $92.42 at the time of my observation in August 2020 and had risen to $139.31 at the time of my Sep. 30, 2021 article. The TEL share price subsequently reached a high of $166.44 on Nov. 16, 2021, before progressively declining to a low of $107.12 by Jul. 5, 2022. Since then the share price has shown a fair degree of volatility trading mostly in the $120s to $130s. In 2023 the share price has been fluctuating above and below the current price of $122.94 at May 5, 2023.
The August 2020 underlying thesis remains intact, but based on TEL share price performance the company is not benefitting, at least not yet -
Few would argue with the view a paradigm shift is taking place with production of BEVs destined to substantially replace production of ICE vehicles by 2030 or soon after. I dig a little deeper to see if TEL share price underperformance is a temporary phenomenon or might be due to issues affecting the longer term outlook for the company.
March quarter 2023 earnings call -
Excerpts from TEL's March 2023 earnings call transcript published by SA Premium,
Terrence Curtin CEO
We are expecting our third fiscal quarter sales to be approximately $4 billion and adjusted earnings per share to be around $1.65. Our guidance represents a sequential decline in sales, a flat earnings per share... we’re continuing to see stability in Transportation, overall strength in the Industrial market and continued weakness in Communications.. order patent (patterns) are indicating moderation in certain industrial equipment end markets. In segment, orders reflect a continued weakness in the data and devices that we’ve talked about for a few quarters now as well as the expected moderation of the appliances market... automotive is still well below the 90 million plus or minus units have been back in 2019 and we’ve sort of been now for three years in a row around 80 million units... as EVs get adopted, whether it’s in China or elsewhere in the world, it’s going to be something that drives content growth... we don’t see any change in our content momentum related to any OEM change. And what’s important for TE is we’re always agnostic to OEM. We’re trying to win and scale what we do for to make sure that the auto industry has further adoption of electric vehicles out to the consumer.
Heath Mitts CFO
Sales of nearly $4.2 billion were up 4% reported and up 8% on an organic basis year-over-year... Year-to-date, we have taken $166 million of restructuring charges and would expect full year restructuring charges to now be approximately $250 million as we continue to optimize our manufacturing footprint and improve the cost structure of the organization... Currency exchange rates negatively impacted sales by $155 million and adjusted EPS by $0.15 versus the prior year. We expect FX to have a modest negative impact for both sales and EPS again in our third quarter on a year-over-year basis... I think the single biggest impact we look at the TE margins on a year-over-year basis is the pretty significant decline in the Communications segment... and then if you add in the impact of FX, those together are over 200 basis points of impact year-over-year to the company margins... the industrial equipment business, which is feeling the pressure on the order front and certainly as it translates into the revenue side of things. And that is our highest margin business within the segment.
The tone of the earnings call was overall quite upbeat, and I have been selective with the above excerpts. I have been selective because I wished to highlight factors that are causing bottom line earnings growth to lag behind pre COVID levels. While I believe the longer term outlook for TEL remains bright, the next year or two will likely remain challenging. I am also concerned at the continuing significant expenditures on restructuring since 2016 which are claimed to have a 2 to 3 year payback period, the evidence for which is not readily apparent in bottom line results. Of course, these expenditures are added back to arrive at the reported non-GAAP results, and if benefits are a multiple of those expenditures I would expect to see clear evidence in results by now. Taking into account the foregoing I continue to rate TEL a hold for the present, while keeping an eye on progress of this interesting corporation. A more detailed financial analysis follows below.
A More Detailed Financial Analysis
Just because the operations of a listed business perform well does not mean buying shares in that business at any given point in time will result in that investment performing well. My main aim in this more detailed financial analysis is to analyze financial data with regard to -
Total Return, Dividends, and Share Price
The only way an investor can achieve a positive return on an investment in shares is through receipt of dividends and/or an increase in the share price above the buy price. It follows what really matters in share value assessment is the expected price at which a buyer will be able to exit shares, and expected cash flow from dividends.
Changes in Share Price
From a purely mathematical/statistical point of view, changes in share price are driven by increases or decreases in EPS and changes in P/E ratio. Changes in P/E ratio are driven by investor sentiment toward the stock. Investor sentiment can be influenced by many factors, not necessarily stock-specific.
"Equity Bucket"
Earnings are tipped into the "Equity Bucket" for the benefit of shareholders. It's prudent to check whether distributions out of and other reductions in the "Equity Bucket" balance are benefiting shareholders.
Summarized in Tables 1, 2, and 3 below are the results of compiling and analyzing financial data with the foregoing in mind.
Table 1 - Detailed Financial History And Projections
Table 1 analyses historical data from 2016 to 2022, including share prices, P/E ratios, EPS and DPS, and EPS and DPS growth rates. For the six years 2016 to 2022, TEL has grown EPS at an average yearly rate of 8.25%. Average yearly share price growth of 8.78% is greater than the EPS growth rate of 8.25% due to P/E multiple expansion from 15.75 at end of 2016 to 16.21 at end of 2022.
The table also includes estimates out to 2025 for share prices, P/E ratios, EPS and DPS, and EPS and DPS growth rates (note - while estimates are shown for analysts' EPS estimates out to 2023 through 2026 where available, estimates do tend to become less reliable the further out the estimates go. These estimates are generally only considered sufficiently reliable if there are at least three analysts' contributing estimates for the year in question).
Table 1 allows modeling for target total rates of return. In the case shown above, the target set for total rate of return is 7.5% per year through the end of 2024 (see line 12), based on buying at the May 5, 2023, closing share price level. As noted above, estimates become less reliable in the later years. In the case of TEL, I have decided to input a target return based on 2024 year, which has EPS estimates from fourteen analysts. I could have based on 2025, but as analysts' estimates only extended to Sep. quarter 2025 I included a December quarter based on my own extrapolation. The table shows that to achieve the 7.5% return, the required average yearly share price growth rate from May 5, 2023, through December 31, 2024, is 5.49% (line 51). Dividends, including estimated dividend increases, account for the balance of the target 7.5% total return.
TEL's Projected Returns Based On Selected Historical P/E Ratios Through End Of 2024
Table 2 below provides scenarios projecting potential returns based on select historical P/E ratios and analysts' consensus, low, and high EPS estimates per Seeking Alpha Premium through the end of 2024.
Table 2 - Summary of relevant projections TEL
Table 2 provides comparative data for buying at the closing share price on May 5, 2023, and holding through the end of 2024. There's a total of twelve valuation scenarios for the year, comprised of three EPS estimates (SA Premium analysts' consensus, low, and high - with Q4 2025 extrapolation as discussed further above) across four different P/E ratio estimates, based on historical data. TEL's P/E ratio is presently 17.77, based on TTM Q1 2023 non-GAAP EPS. For TEL, the present P/E ratio is almost the same as the modified average of historical P/E ratios over the last six years of 17.78. Table 2 shows potential returns from an investment in shares of the company at a range of historical level P/E ratios. This analysis, from hereon, assumes an investor buying TEL shares today would be prepared to hold through end of 2024, if necessary, to achieve their return objectives. Comments on contents of Table 2, for the period to 2024 column follow.
Consensus, low, and high EPS estimates
All EPS estimates are based on analysts' consensus, low, and high estimates per SA Premium. This is designed to provide a range of valuation estimates ranging from low to most likely to high based on analysts' assessments. I could generate my own estimates, but these would likely fall within the same range and would not add to the value of the exercise. This is particularly so in respect of well-established businesses such as TEL. I believe the "low" estimates should be considered important. It's prudent to manage risk by knowing the potential worst-case scenarios from whatever cause.
Alternative P/E ratios utilized in scenarios
- The current P/E ratio . This scenario provides a range of potential returns if the P/E ratio remained at the current level through end of 2024.
- A modified average P/E ratio based on 26 quarter-end P/E ratios from Q4 2016 to Q1 2023 plus the current P/E ratio in Q2 2023. The average of these P/E ratios has been modified to exclude the three highest and three lowest P/E ratios to remove outliers that might otherwise distort the result. The present P/E ratio is close to the average so in this instance, this scenario shows indicative returns similar to if the multiple stayed around current levels through the end of 2024.
- A modified historical low P/E ratio calculated using the same data set used for calculating the modified average P/E ratio, with the three highest and lowest P/E ratios excluded.
- A selected P/E ratio to provide an alternative P/E scenario to take into account other factors that might be relevant to assessing potential returns. For example, if analysts' forward estimates reflected EPS growth rates significantly higher or lower than historical EPS growth rates. In such cases the forward P/E ratio might be expected to trend higher or lower than the historical average. In the case of TEL, EPS estimates through end of December 2023 show a decline before growth resumes in 2024 and 2025. The selected P/E ratio of 18.50 is designed to provide an idea of the effect on returns of an increase in the P/E ratio at end of 2024 in anticipation of higher EPS growth rate in 2025.
Reliability of EPS estimates (line 18)
Line 18 shows the range between high and low EPS estimates. The wider the range, the greater disagreement there is between the most optimistic and the most pessimistic analysts, which tends to suggest greater uncertainty in the estimates. There are fourteen analysts covering TEL through the end of 2024. In my experience, a range of 3.5 percentage points difference in EPS growth estimates among 14 analysts is not overly high, suggesting a degree of certainty, and thus reliability.
Projected returns per Table 2 above (lines 20 to 45)
Lines 25, 35 and 45 show if TEL's P/E multiple were to fall to the modified historical low of 15.10, returns of negative (2.2)% to positive 1.6% could be expected through end of 2024, based on the range of analysts' EPS estimates. The negative (2.2)% is based on analysts' low estimates and the 1.6% on their high estimates, with consensus negative (0.4)%. If the multiple increased to the historical average of 17.78, similar to the current level of 17.77, returns of 7.2% to 11.3% are indicated, with consensus 9.2%. If the P/E ratio should increase further to the level of the selected P/E ratio of 18.50, returns of 9.6% to 13.8% are indicated, with consensus 11.7%.
Checking TE Connectivity's "Equity Bucket"
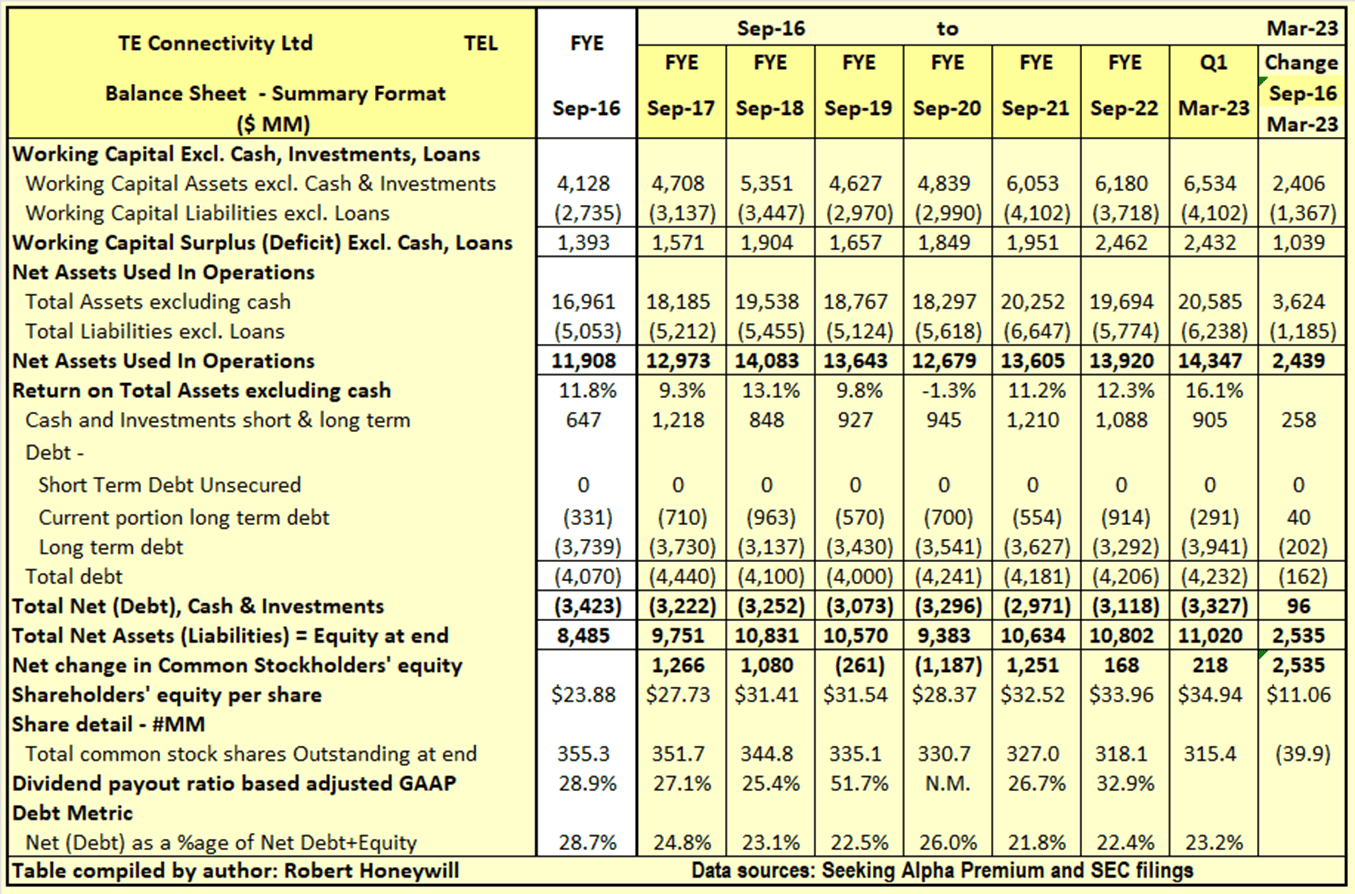
Table 3.1 TE Connectivity Balance Sheet - Summary Format
Over the 6.5 years end of Sep. 2016 to end of Mar. 2023, TE Connectivity has increased shareholders' funds by $2,535 million. This $2,535 million was used to increase net assets used in operations by $2,439 million and reduce debt net of cash by $96 million. Net debt as a percentage of net debt plus equity decreased from 28.7% at end of Sep. 2016 to 23.2% at end of Mar. 2023. Outstanding shares decreased by 39.9 million from 355.3 million to 315.4 million, over the period, due to share repurchases offset in part by shares issued for stock compensation. The $2,535 million increase in shareholders' equity over the last 6.5 years is analyzed in Table 3.2 below.
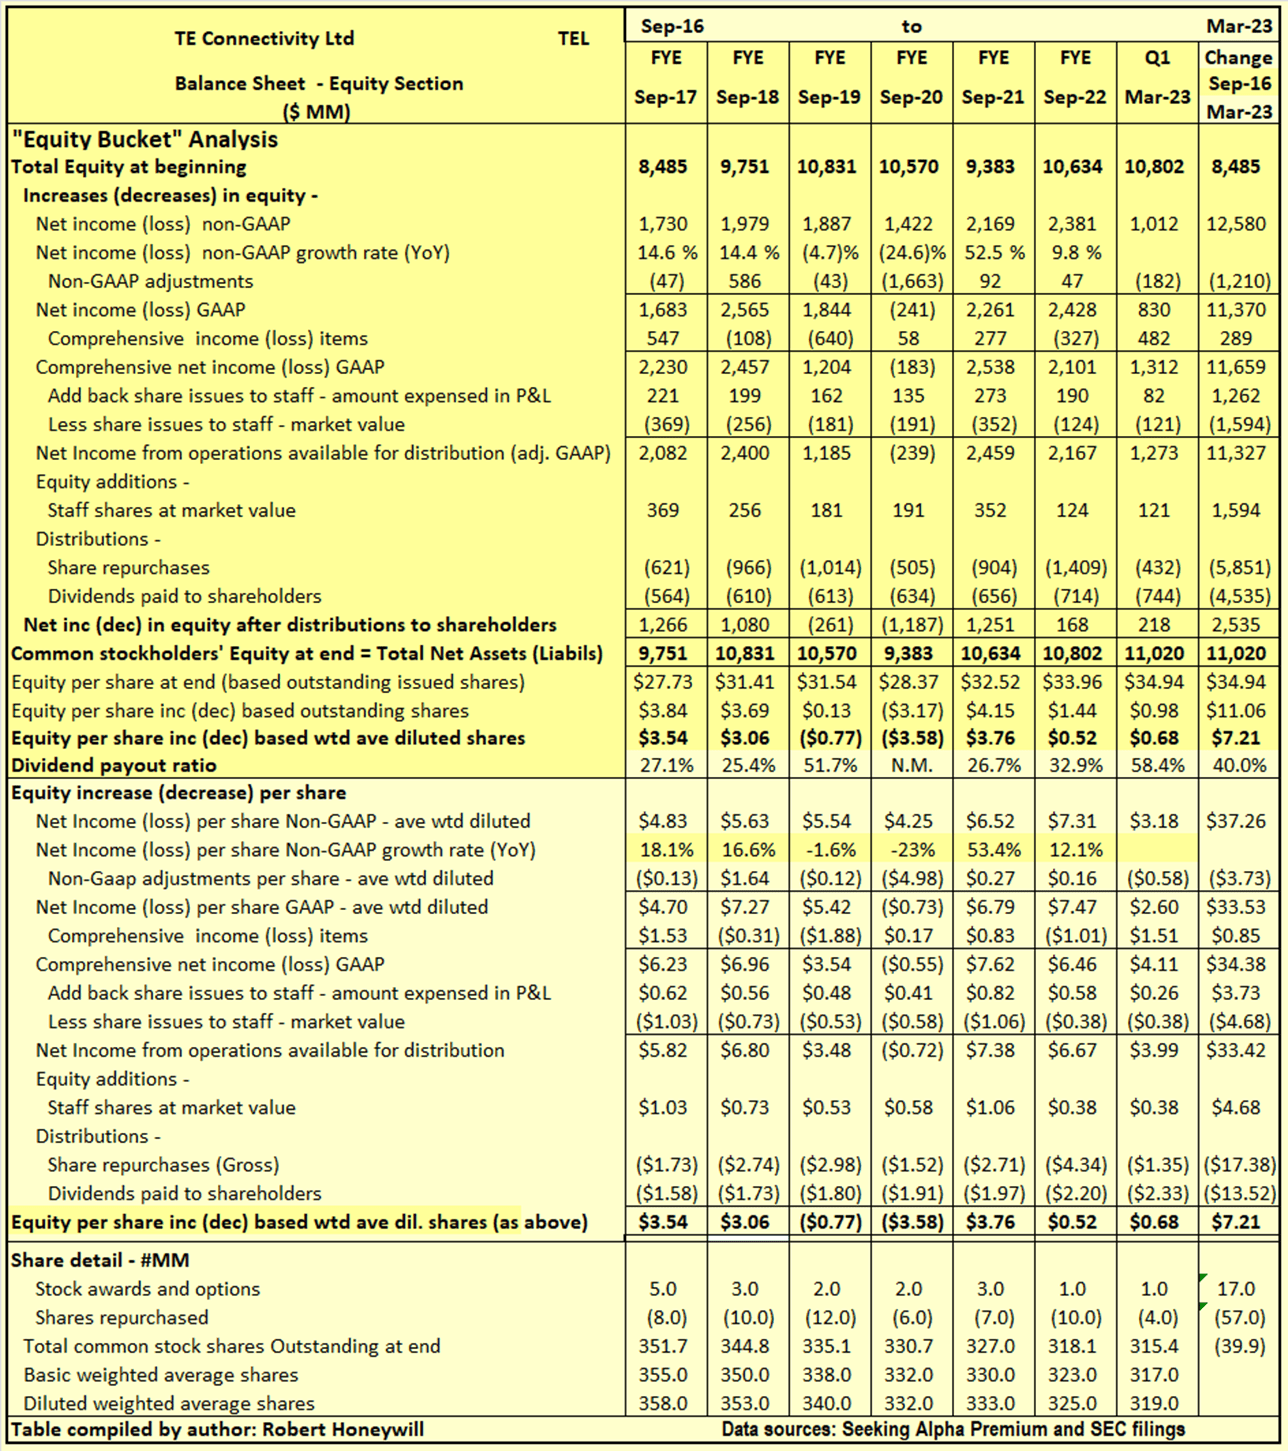
Table 3.2 TE Connectivity Balance Sheet - Equity Section
I often find companies report earnings that should flow into and increase shareholders' equity. But often the increase in shareholders' equity does not materialize. Also, there can be distributions out of equity that do not benefit shareholders. Hence, the term "leaky equity bucket." I look for evidence of this in my analysis of changes in shareholders' equity.
Explanatory comments on Table 3.2 for the period end FY-2016 to end Q1-2022
- Reported net income (non-GAAP) over the 6.5-year period totals to $12,580 million, equivalent to diluted net income per share of $37.26.
- Over the 6.5-year period, the non-GAAP net income excludes a significant $1,210million (EPS effect $3.73) of items regarded as unusual or of a non-recurring nature in order to better show the underlying profitability of TE Connectivity. In the case of TE Connectivity, a large part of the net total adjustment is due to exclusion of a goodwill impairment charge of $896 million booked in FY 2020. But please see discussion further above in regard to other large adjustments for tax and restructuring that have mostly offset each other.
- Other comprehensive income includes such things as foreign exchange translation adjustments in respect to buildings, plant, and other facilities located overseas and changes in valuation of assets in the pension fund - these are not passed through net income as they fluctuate without affecting operations and can easily reverse in a following period. Nevertheless, they do impact on the value of shareholders' equity at any point in time. For TE Connectivity, these items were $289 million (EPS effect $0.85) positive over the 6.5-year period.
- The company has a stock compensation scheme. Amounts recorded in the income statement for stock compensation are less than the market value of shares used to settle equity awards. The effect is a reduction of $332 million (EPS effect $0.95) compared to reported income. This is not considered material in the context of total net income over the 6.5-year period.
- By the time we take the above-mentioned items into account, we find, over the 6.5-year period, the reported non-GAAP EPS of $37.26 ($12,580 million) has decreased to $33.42 ($11,327 million), added to funds from operations available for distribution to shareholders.
- Dividends of $4,535 million, and share repurchases of $5,851 million were covered by the $11,327 million generated from operations, leaving a $941 million net increase in equity from operations
- This net $941 million increase from operations, after dividends and share repurchases, and the $1,594 million from equity issues to staff, are the source of the $2,535 million increase in shareholders' funds per Table 3.1 above.
Summary And Conclusions
TE Connectivity's business is positioned to grow strongly with the move to hybrid and battery electric and fuel cell electric vehicles. It is a no-lose situation for the company, as its products are used in ICE vehicles and even more so in the new generation vehicles. Net debt to debt plus equity ratio is low at 23.2%. Current P/E multiple is slightly below historical average but SA analysts' estimates reflect anticipated EPS growth rates well below past EPS growth rates. This is consistent with TE Connectivity management's warning of a high US dollar weighing on earnings. I am not overly concerned about the exchange rate as this could correct itself without any action by the management. The effect of swings in exchange rate are also not cumulative so a change with an adverse impact in one year does not mean an additional adverse impact in following years, unless the US dollar continues to move in the same direction indefinitely. Persistent cost inflation would be of more concern because that does have a cumulative effect. It is encouraging management indicate they expect to be able to maintain margins (before any exchange rate effect) by passing on cost increases in prices to customers. The total level of auto production remains well below pre COVID levels and this will be contributing to depressed earnings, while this situation continues. I still see a bright long term future for TE Connectivity and its businesses. My one concern would be the potential for adverse short term share price movements brought on by concerns about earnings not growing sufficiently, flattening out or falling compared to prior periods.
For further details see:
TE Connectivity: Impact Of Electrification Boom A Way Off