TEL - TE Connectivity: May Be Fully Priced At Present (Rating Downgrade)
Summary
- TE Connectivity continues to benefit from the increasing electrification of trucks, automobiles, trains and other forms of transport and machinery.
- These changes have the potential to provide TE Connectivity with a long and profitable growth path.
- TE Connectivity appears to be successfully passing on inflationary cost increases to customers, but not so the impact of a higher US dollar.
- This exchange rate issue might be transitory, and not a longer term issue, but it does raise concerns for the share price in the period ahead.
Investment Thesis
On Jun. 29, 2022, with the share price at $115.25, I published the article, " TE Connectivity Stock Remains A Strong Buy" . Since then, the share price of TE Connectivity Ltd ( TEL ) decreased to a low of $104.76 on Oct. 13, 2022, before reaching a high of $128.00 on Dec. 1, 2022. The share price has since shown continuing volatility, falling to $111.94 on Dec. 28, 2022 and has since rebounded to close at $123.29 on Jan. 18, 2023. Movements of the stock in comparison to the S&P 500 are shown in Fig. 1 below.
Figure 1
Figure 1 shows a close correlation between price movements of TE Connectivity stock and the S&P 500 index ( SP500 ). It can be concluded the volatility in TE Connectivity share price over the last 7 months appears to be related to general market sentiment rather than factors specific to the company.
I remain bullish on the prospects for this stock due to the growth opportunities associated with increasing electrification of transport and industry as described in detail in Jun. 29, 2022 article linked above, and in previous articles. But from an earnings point of view TE Connectivity is facing some headwinds in 2023 as explained by CEO Terrence Curtin per these excerpts from the 4th quarter earnings call on Nov. 2, 2022 (Sep 30 yearend),
...2023, we do expect sales of approximately $3.75 billion and this sales in the first quarter of 2023, up 9% organically and down slightly on a reported basis year-over-year, despite approximately $400 million of FX headwinds... Adjusted earnings per share is expected to be approximately $1.50, which includes year-over-year headwinds of approximately $0.25 from currency exchange, and a higher tax rate of 21%, which will be up from a year ago...
This has implications for the share price over the next twelve months. TE Connectivity has achieved earnings beats for every one of the last 20 quarters at least back to Dec 2017, which is as far back as SA Premium shows. Apart from the 2020 COVID year, earnings have shown strong yearly growth going back to 2016 at least. Both fundamentals and sentiment affect stock prices and sentiment could easily start to turn against TE Connectivity as 2023 quarterly earnings are released showing significant falls from 2022 levels. As shown in Figure 2 below Seeking Alpha QUANT sentiment could easily turn from the present "Hold" to a "Sell" if Profitability falls, as is expected in the December 2022 quarterly earnings call, due out pre-market on Jan. 25, 2023.
Figure 2 Seeking Alpha Premium TE Connectivity Rating
SA Premium
Following release of TE Connectivity Dec. 2022 quarterly earnings, SA QUANT "Profitability" factor grade could likely be downgraded, with a major impact on the overall rating. The lower earnings could also trigger a share price slide which would adversely impact "Momentum" factor grade. While these possibilities could already be factored into the current share price, that appears unlikely given the share price has been closely tracking the S&P 500 index, as discussed above.
I remain positive towards this company and its business, but some caution should likely be exercised in relation to the current share price. This will likely be of less concern for holders with a long term time horizon.
Additional analysis and comment follow.
Looking for share market mispricing of stocks
What I'm primarily looking for here are instances of share market mispricing of stocks due to distortions to many of the usual statistics used for screening stocks for buy/hold/sell decisions. The usual metrics do not work when the "E" in P/E is distorted by the impact of COVID-19. And, if the P/E ratio is suspect, so too, then, is the PEG ratio similarly affected.
I believe the answer is to start with data at the end of 2019, early 2020, pre-COVID-19, and compare projections out to the end of 2022 or later, when hopefully the impacts of COVID-19 will have largely dissipated. Summarized in Tables 1 and 2 below are the results of compiling and analyzing the data on this basis.
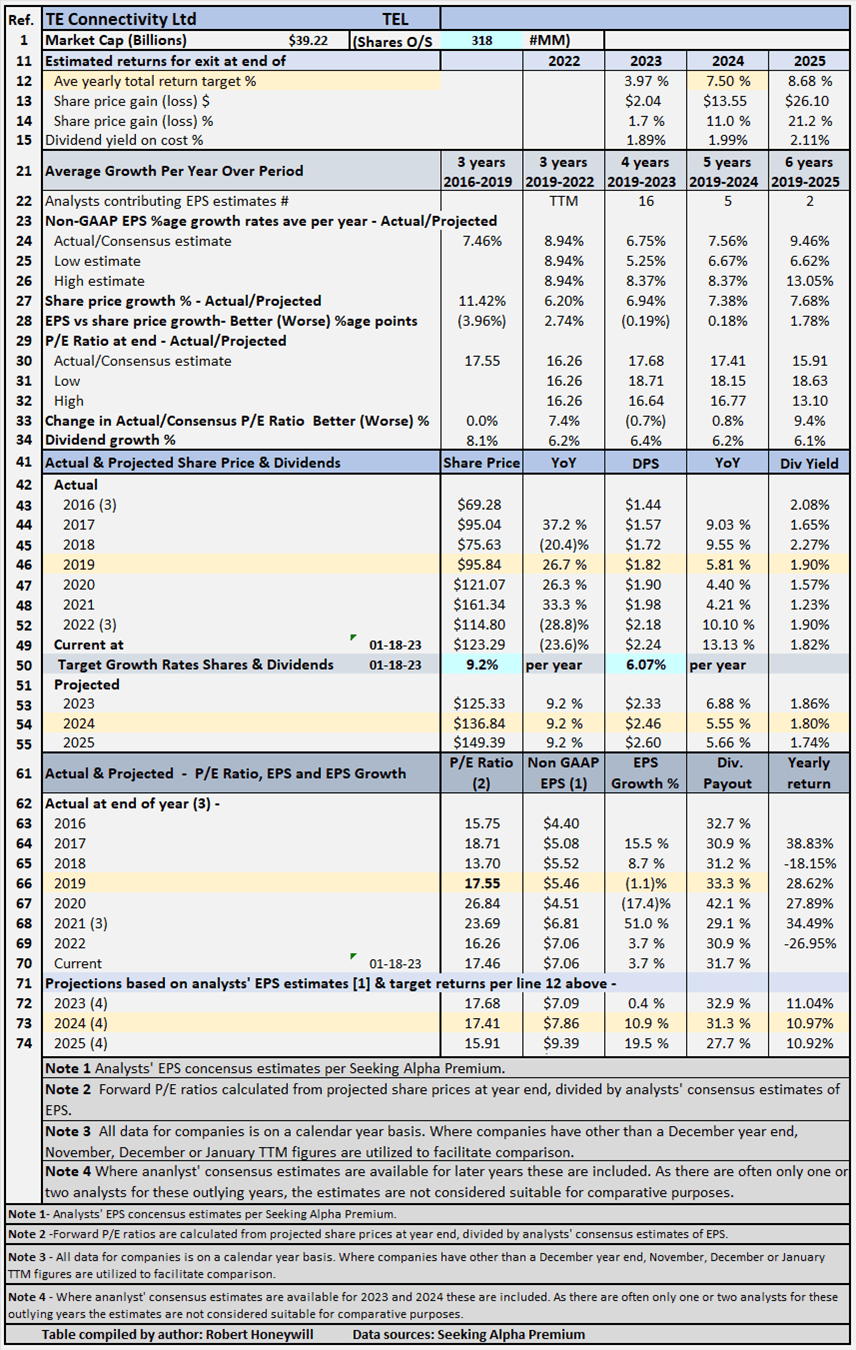
Table 1 - Detailed Financial History And Projections
Table 1 shows TEL Group projected EPS for 2023 is $7.09, barely above EPS of $7.06 forecast for 2022. This compares to strong yearly EPS growth for the previous 6 years except for COVID impacted 2020. This levelling off in growth is attributed mainly to a stronger US dollar. According to management cost inflation is also an issue but is being recovered through price increases to customers.
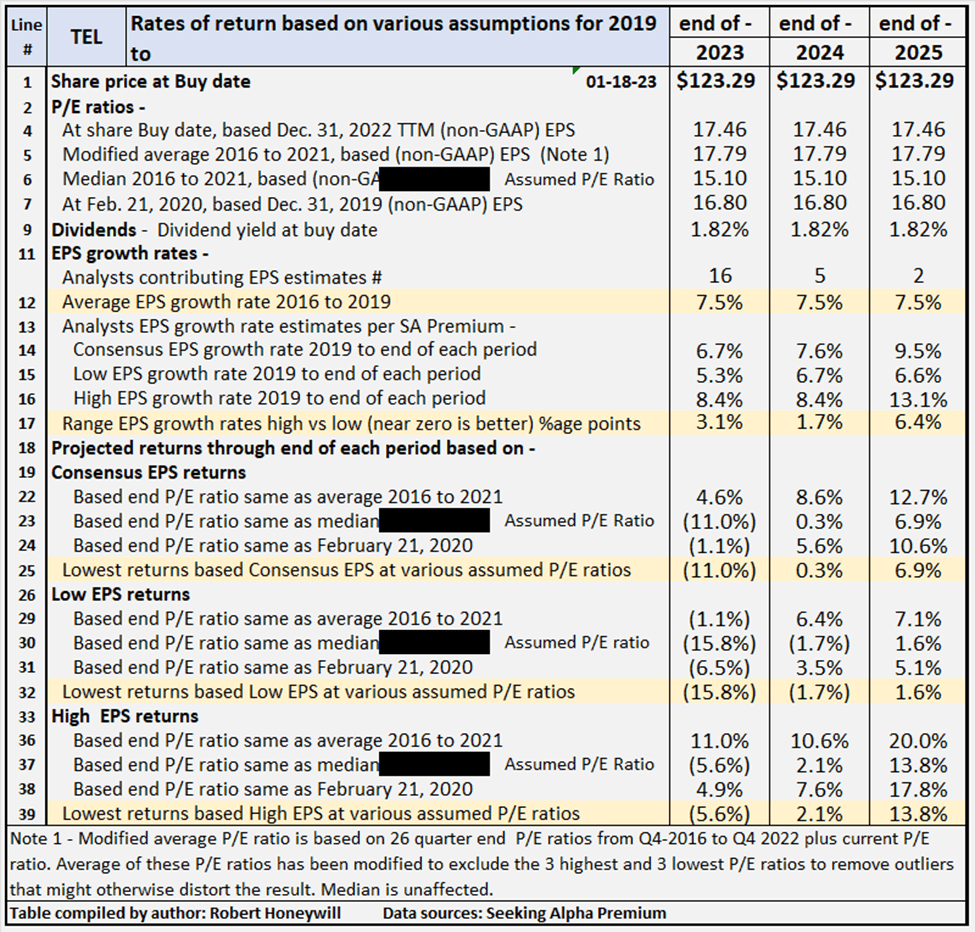
Table 2 below provides scenarios projecting potential returns based on select historical P/E ratios and analysts' consensus, low, and high EPS estimates per Seeking Alpha Premium through end of 2024.
Table 2 - Summary of relevant projections TE Connectivity
Table 2 provides comparative data for buying at closing share price on Jan. 18, 2023 and holding through the end of years 2023 through 2025. There's a total of nine valuation scenarios for each year, comprised of three EPS estimates (SA Premium analysts' consensus, low and high) across three different P/E ratio estimates, based on historical data. Table 2 shows potential returns from an investment in shares of the company at a range of historical and assumed P/E ratio levels. This analysis, from hereon, assumes an investor buying TE Connectivity shares today would be prepared to hold through the end of 2024, if necessary, to achieve their return objectives. Comments on contents of Table 2, for the period to 2024 column follow.
Consensus, low, and high EPS estimates
All EPS estimates are based on analysts' consensus, low and high estimates per SA Premium. This is designed to provide a range of valuation estimates ranging from low to most likely, to high based on analysts' assessments. I could generate my own estimates, but these would likely fall within the same range and would not add to the value of the exercise. This is particularly so in respect of well-established businesses such as TE Connectivity. I believe the "low" estimates should be considered important. It's prudent to manage risk by knowing the potential worst-case scenarios from whatever cause.
Alternative P/E ratios utilized in scenarios
- The actual P/E ratio at share buy date based on estimated non-GAAP EPS for FY-2022.
- A modified average P/E ratio of 17.79 based on 26 quarter-end P/E ratios from Q4 2016 to Q4 2022 plus current P/E ratio in Q1 2023. The average of these P/E ratios has been modified to exclude the three highest and three lowest P/E ratios to remove outliers that might otherwise distort the result.
- A median P/E ratio is calculated using the same data set used for calculating the modified average P/E ratio. Of course, the median is the same whether or not the three highest and lowest P/E ratios are excluded. In the case of TE Connectivity I have chosen to use an assumed P/E ratio of 15.10 in place of the historical median of 17.20 (similar to the average). The 15.10 is based on the historical low P/E ratio. I have done this to provide an idea of the impact on returns of the multiple decreasing significantly from present level.
- The actual P/E ratio at Feb. 21, 2020, share price, based on 2019 non-GAAP EPS. The logic here is the market peaked around February 21, 2020, before any significant impact from COVID-19 became apparent. This makes the P/E ratios at Feb. 21, 2020, reflective of most recent data before distortion of P/E ratios by the impact of the coronavirus pandemic.
Reliability of EPS estimates (line 17)
Line 17 shows the range between high and low EPS estimates. The wider the range, the greater disagreement there is between the most optimistic and the most pessimistic analysts, which tends to suggest greater uncertainty in the estimates. There are five analysts covering TE Connectivity through the end of 2024. In my experience, a range of 1.7 percentage points difference in EPS growth estimates among analysts is not outside normal range, suggesting a degree of certainty, and thus reliability.
Projected returns (lines 18 to 39)
Lines 25, 32 and 39 show, at a range of historical P/E ratio levels, TE Connectivity is conservatively indicated to show negative returns between (1.7)% and 2.1% average per year through the end of 2024. The (1.7)% return is based on analysts' low EPS estimates and the 2.1% on their high EPS estimates, with an 0.3% return based on consensus estimates. Those are the lowest of the returns under the consensus, low and high EPS scenarios, and assume a P/E ratio of 15.10 in 2024, based on the historical low for 2016 to 2023. At the high end of the projected returns for TE Connectivity, the indicative returns range from 6.4% to 10.6%, with consensus 8.6%. These returns assume a P/E ratio of 17.79 in 2024, based on the current P/E ratio of 17.46 increasing slightly to the historical average of 17.79 by end of 2024.
Checking TE Connectivity's "Equity Bucket"
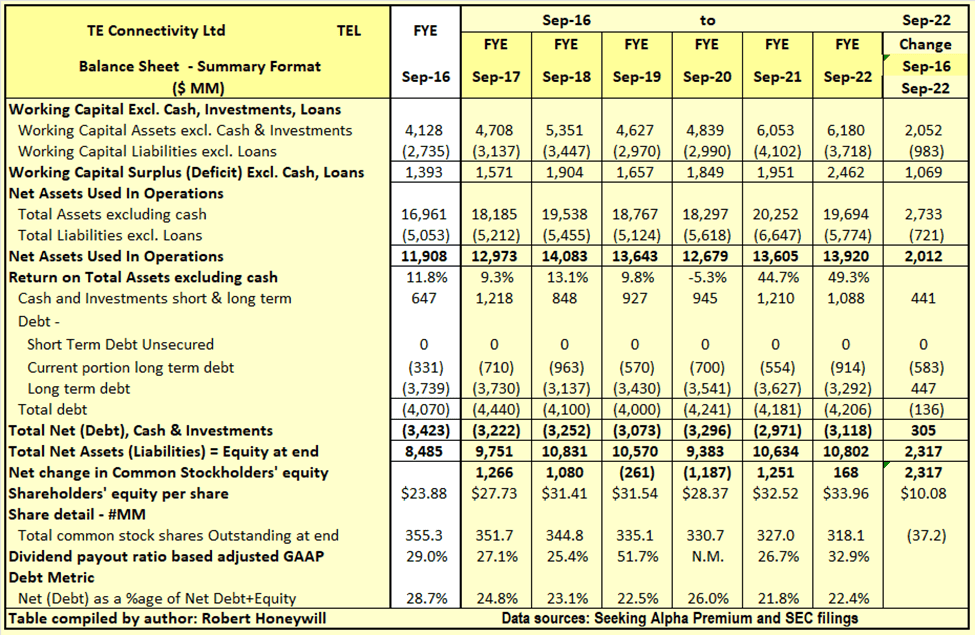
Table 3.1 TE Connectivity Balance Sheet - Summary Format
Over the 6 years end of Sep. 2016 to end of Sep. 2022, TE Connectivity has increased shareholders' funds by $2,317 million. This $2,317 million was used to increase net assets used in operations by $2,012 million and reduce debt net of cash by $305 million. Net debt as a percentage of net debt plus equity decreased from 28.7% at end of Sep. 2016 to 22.4% at end of Sep. 2022. Outstanding shares decreased by 37.2 million from 355.3 million to 318.1 million, over the period, due to share repurchases offset in part by shares issued for stock compensation. The $2,317 million increase in shareholders' equity over the last 6 years is analyzed in Table 3.2 below.
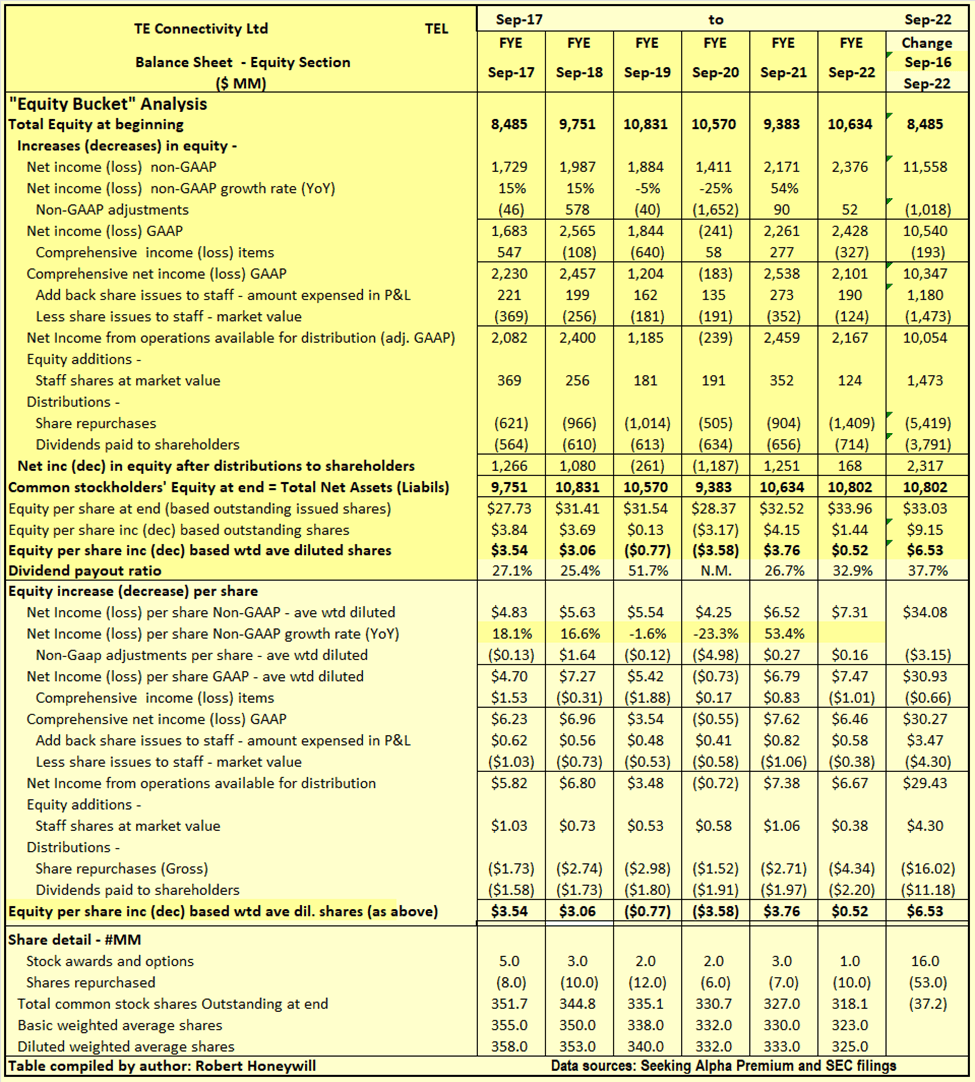
Table 3.2 TE Connectivity Balance Sheet - Equity Section
I often find companies report earnings that should flow into and increase shareholders' equity. But often the increase in shareholders' equity does not materialize. Also, there can be distributions out of equity that do not benefit shareholders. Hence, the term "leaky equity bucket." I look for evidence of this in my analysis of changes in shareholders' equity.
Explanatory comments on Table 3.2 for the period end FY-2016 to end Q1-2022
- Reported net income (non-GAAP) over the 6-year period totals to $11,558 million, equivalent to diluted net income per share of $34.08.
- Over the 6-year period, the non-GAAP net income excludes a significant $1,018million (EPS effect $3.15) of items regarded as unusual or of a non-recurring nature in order to better show the underlying profitability of TE Connectivity. In the case of TE Connectivity, the net total adjustment is primarily due to exclusion of a goodwill impairment charge of $900 million booked in FY 2020.
- Other comprehensive income includes such things as foreign exchange translation adjustments in respect to buildings, plant, and other facilities located overseas and changes in valuation of assets in the pension fund - these are not passed through net income as they fluctuate without affecting operations and can easily reverse in a following period. Nevertheless, they do impact on the value of shareholders' equity at any point in time. For TE Connectivity, these items were $193 million (EPS effect $0.66) negative over the 6-year period.
- The company has a stock compensation scheme. Amounts recorded in the income statement for stock compensation are less than the market value of shares used to settle equity awards. The effect is a reduction of $293 million (EPS effect $0.83) compared to reported income. This is not considered material in the context of total net income over the 6-year period.
- By the time we take the above-mentioned items into account, we find, over the 6-year period, the reported non-GAAP EPS of $34.08 ($11,558 million) has decreased to $29.43 ($10,054 million), added to funds from operations available for distribution to shareholders.
- Dividends of $3,791 million, and share repurchases of $5,419 million were covered by the $10,054 million generated from operations, leaving a $844 million net increase in equity from operations
- This net $844 million increase from operations, after dividends and share repurchases, and the $1,473 million from equity issues to staff, are the source of the $2,317 million increase in shareholders' funds per Table 3.1 above.
Summary And Conclusions
TE Connectivity's business is positioned to grow strongly with the move to hybrid and battery electric and fuel cell electric vehicles. It is a no-lose situation for the company, as its products are used in ICE vehicles and even more so in the new generation vehicles. Net debt to debt plus equity ratio is low at 22.4%. Current P/E multiple is slightly below historical average but SA analysts' estimates reflect anticipated EPS growth rates well below past EPS growth rates. This is consistent with TE Connectivity My assessment is TE Connectivity management's warning of a high US dollar weighing on earnings. I am not overly concerned about the exchange rate as this could correct itself without any action by the management. Swings in exchange rate are also not cumulative so an increase in one year does not mean a continuing increase in following years, unless the US dollar continues to strengthen indefinitely. Persistent cost inflation would be of more concern because that does have a cumulative effect. It is encouraging management indicate they expect to be able to maintain margins (before any exchange rate effect) by passing on cost increases in prices to customers. I still see a bright long term future for TE Connectivity and its businesses. My one concern would be the potential for adverse short term share price movements brought on by concerns about earnings flattening out or falling compared to prior periods.
For further details see:
TE Connectivity: May Be Fully Priced At Present (Rating Downgrade)