QQQ - TECB: More Evenly Diversified At The Cost Of Lower Performance
2024-01-12 00:08:53 ET
Summary
- iShares U.S. Tech Breakthrough Multisector ETF warrants a hold rating due to mixed factors impacting the fund's performance looking forward.
- TECB has a more evenly diversified approach compared to other technology ETFs, including weight in non-IT sectors, but has seen lower historical performance compared to XLK, VGT, and QQQ.
- The Fund has a higher expense ratio, lower dividend yield, and negative dividend growth compared to other big tech ETFs examined in this article.
Investment Thesis
iShares U.S. Tech Breakthrough Multisector ETF ( TECB ) warrants a hold rating due to multiple mixed factors for the fund. While it is a technology fund that is more evenly diversified than many other technology ETFs, its balanced approach has resulted in lower performance historically. Additionally, its higher expense ratio and lower dividend yield compared to other big tech ETFs are also downsides for the fund.
Fund Overview and Compared ETFs
TECB is an ETF that seeks to track the performance of U.S. companies that benefit from breakthrough robotics , AI, data tech, genomics, and financial technologies. With an inception in 2020, the fund has 175 holdings and $335.47M in AUM. TECB, as its name implies, includes holdings in multiple sectors including health care, IT, communication, and consumer discretionary. Other technology-focused ETFs examined for comparison purposes with TECB are the Technology Select Sector SPDR Fund ( XLK ), Vanguard Information Technology ETF ( VGT ), and Invesco QQQ ETF ( QQQ ).
XLK seeks the performance of the information technology within the S&P 500 Index. It is therefore heavy on Apple and Microsoft. Similarly, VGT seeks to track a benchmark index that follows the investment returns of the IT sector in general. Due to its increased volatility, VGT earns a "5" on Vanguard's risk versus reward scale. Finally, QQQ tracks the Nasdaq-100 Index.
The primary difference between TECB and these other compared ETFs is their weight distribution on big tech holdings. While VGT, XLK, and QQQ have the heaviest weights on mega cap, big tech companies, TECB takes a more evenly distributed weight approach. This strategy presents both advantages and disadvantages that I will discuss further in this article.
Performance, Expense Ratio, and Dividend Yield
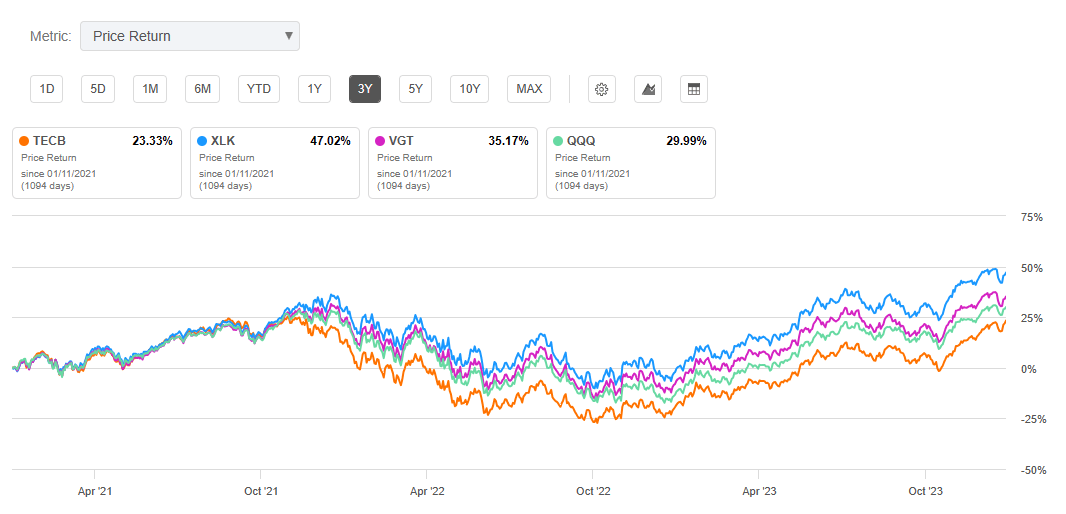
TECB has a 3-year CAGR of 7.33% since its inception in 2020. Because of big tech's strong returns over the past years, notably in 2023, the other compared ETFs have outperformed. Specifically, XLK has a 3-year CAGR of 14.90%, VGT has a 3-year CAGR is 11.85%, and QQQ has a 3-year CAGR of 9.47%. Another downside for TECB is its comparatively high expense ratio of 0.40%. While lower than the average ETF expense ratio of roughly 0.50%, TECB's expenses are higher than other big tech ETFs examined.
3-Year Total Price Return: TECB and Compared ETFs (Seeking Alpha)
While technology stocks are not known for their dividend yields, all ETFs compared, including TECB, offer a dividend. Unfortunately, TECB has the lowest dividend of all tech ETFs examined. Additionally, its dividend has been shrinking with a 3-year dividend growth CAGR of -29.05%. In contrast, XLK, VGT, and QQQ have seen positive dividend growth over the past few years.
Expense Ratio, AUM, and Dividend Yield Comparison
| TECB |
| XLK |
| VGT |
| QQQ |
| Expense Ratio |
| 0.40% |
| 0.10% |
| 0.10% |
| 0.20% |
| AUM |
| $335.47M |
| $55.93B |
| $69.35B |
| $229.49B |
| Dividend Yield TTM |
| 0.23% |
| 0.77% |
| 0.66% |
| 0.57% |
| Dividend Growth 3 YR CAGR |
| -29.05% |
| 6.85% |
| 2.35% |
| 10.14% |
Source: Seeking Alpha, 9 Jan 24
TECB Holdings and Its Competitive Advantage
Because of its evenly diversified strategy, TECB's holdings and respective weights are considerably different than traditional, big-tech ETFs. While XLK, VGT, and QQQ are heavy on Apple Inc. ( AAPL ) and Microsoft Corporation ( MSFT ), the funds are similar in weight for lower holdings like NVIDIA Corporation ( NVDA ), Alphabet Inc. ( GOOGL ), and Advanced Micro Devices, Inc. ( AMD ).
Top 10 Holdings for TECB and others (Noteworthy Differences Bolded)
| TECB - 175 holdings |
| XLK - 64 holdings |
| VGT - 315 holdings |
| QQQ - 101 holdings |
| MRK - 4.33% |
| MSFT - 22.69% |
| AAPL - 22.23% |
| AAPL - 8.95% |
| NVDA - 4.27% |
| AAPL - 21.49% |
| MSFT - 20.88% |
| MSFT - 8.68% |
| META - 4.22% |
| AVGO - 5.05% |
| NVDA - 4.16% |
| AMZN - 4.77% |
| GOOGL - 4.02% |
| NVDA - 4.88% |
| AVGO - 3.36% |
| AVGO - 4.02% |
| AMZN - 3.87% |
| ADBE - 2.93% |
| ADBE - 2.27% |
| META - 3.95% |
| CRM - 3.83% |
| CRM - 2.81% |
| CRM - 2.01% |
| NVDA - 3.85% |
| MSFT - 3.82% |
| AMD - 2.62% |
| ACN - 1.71% |
| TSLA - 3.63% |
| AAPL - 3.71% |
| ACN - 2.37% |
| CSCO - 1.61% |
| GOOGL - 2.55% |
| ADBE - 3.62% |
| CSCO - 2.26% |
| AMD - 1.61% |
| GOOG - 2.50% |
| AMD - 3.39% |
| INTC - 2.26% |
| ORCL - 1.57% |
| COST - 2.38% |
Source: Multiple, compiled by author on 9 Jan 24
All ETF investors know that the fund's future performance is tied to its individual holdings. TECB has both holdings that will likely propel and drag down the ETF looking forward. Merck & Co., Inc ( MRK ), for example, is one holding that may work against the fund in the year ahead while Meta Platforms, Inc. ( META ) and Salesforce, Inc. ( CRM ) may pull TECB upward. I will cover more on each of these in further detail below.
MRK - High Valuation and Unimpressive Growth
A key downside for TECB is its heaviest weight on MRK at 4.33%. First, Merck has seen an uninspiring 0.48% YoY revenue growth and a -40.26% YoY EBITDA growth. To add to its lackluster growth, its current valuation is high. This can be seen with its forward P/E GAAP of 175.07, or 482% higher than its sector. Additionally, its EV/EBITDA over the past twelve months is 66% higher than its sector median. These high valuation metrics in combination with low growth represent a headwind for TECB in comparison to other big tech ETFs that do not hold significant weight on MRK.
META - Strong Profitability and Initiatives
The second difference is META. TECB has a 4.22% weight on META, the highest of ETFs examined. Despite problems with the Metaverse in 2022, and a subsequent layoff of 13% of the company's workforce, META saw a stellar rebound in 2023. The company has demonstrated very strong fundamentals recently including a 23.4% net income margin, a 22.3% return on common equity, and a 24.4% YoY EBITDA growth. META has also successfully launched multiple AI-driven initiatives. One example is its Ray-Ban smart glasses which include Meta AI features. Due to its renewed focus on efficiency and AI projects, META will therefore likely propel ETFs that have it as a holding. Because META is in the communications services sector, many information technology ETFs do not include META as a holding. This represents a distinct strength for TECB, in comparison to VGT or XLK.
CRM - Solid Forward Growth
The third difference is CRM. TECB has the heaviest weight on CRM compared to big tech ETFs at 3.83%. The company has seen very strong indicators including a 102.7% YoY EBITDA growth and 824% YoY ROE growth. In addition, Salesforce has been very profitable with a 74.9% gross profit margin over the past twelve months and a 33.9% levered FCF margin. Despite a 77% increase in share price over the past year, CRM has a 4.20 forward price/book ratio, on par with its sector median. Therefore, I believe CRM represents another key favorable factor for TECB compared to other tech ETFs.
Valuation and Risks to Investors
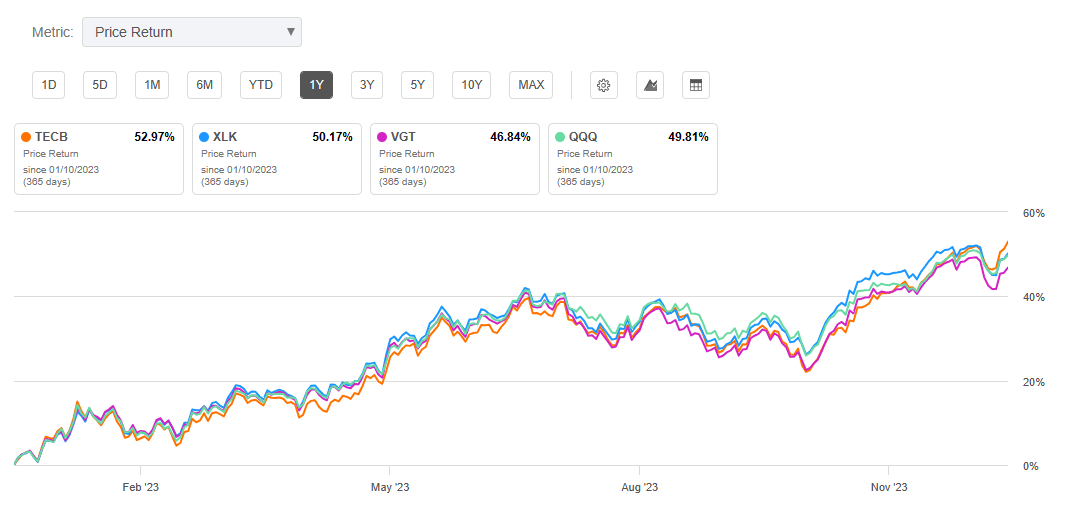
TECB is currently trading at $43.46 at the time of writing this article. This is near the upper limit of its 52-week price range of $27.90 and $43.54. It currently is also below its all-time high of $44.01 seen back in November 2021. Over the past year, TECB has predominantly underperformed, except in short times during big tech pullbacks. This has resulted in a total one-year price return of about 52%, slightly higher than the other tech ETFs. Therefore, a key upside for TECB is that it has seen better comparative performance when mega cap, big tech stocks experience a pullback. This is due to its smoother diversification, as previously discussed.
One-Year Price Return: TECB and Compared ETFs (Seeking Alpha)
While TECB has seen a one-year return slightly higher than the compared ETFs, I expect its long-term performance to be lower than XLK, VGT, and QQQ. This is predominantly due to the mix of holdings discussed earlier. Therefore, for long-term investors seeking gains from technology-focused stocks, I prefer the other peer ETFs.
Valuation Metrics for TECB and Peer Competitors
| TECB |
| XLK |
| VGT |
| QQQ |
| P/E ratio |
| 36.36 |
| 27.86 |
| 33.1 |
| 32.52 |
| P/B ratio |
| 6.78 |
| 9.45 |
| 8.0 |
| 16.58 |
Source: Compiled by Author from Multiple Sources, 9 Jan 24
While technology companies are well-known for their growth, a downside for these ETFs, including TECB, is volatility compared to "the market" overall. This volatility can be measured by looking at their beta values, which are all greater than 1.0. XLK has the greatest volatility with a 24-month beta value of 1.23. This is followed by VGT with a 3-year beta of 1.21, and QQQ with a 24-month beta of 1.20. Because of TECB's more evenly distributed weight on holdings, it has the lowest beta value at 1.17.
Concluding Summary
TECB warrants a hold rating due to multiple favorable and unfavorable factors for the fund. While TECB has the most evenly distributed weight on holdings compared to peer ETFs examined, it has the lowest historical performance. While previous performance is not always an indicator of future performance, TECB has the heaviest weight on overvalued MRK and lowest weights on MSFT and AAPL. Additionally, TECB has the highest expense ratio and lowest dividend yield among compared ETFs. For investors seeking a technology-focused ETF with strong growth, I prefer VGT due to its track record of performance and low expense ratio. However, I believe TECB is appropriate for investors seeking exposure to more than just the IT sector and with more even diversification among the big tech giants.
For further details see:
TECB: More Evenly Diversified At The Cost Of Lower Performance