TX - Ternium: Improving Fundamentals And Good Margin Of Safety
2023-10-16 07:00:00 ET
Summary
- Ternium S.A. has achieved revenue and profit growth through organic growth and acquisitions over the past 11 years.
- TX has a strong financial position and a good capital allocation plan, creating value for shareholders.
- Valuation based on the steel price cycle shows a sufficient margin of safety, making it an investment opportunity.
Investment Thesis
Ternium S.A. ( TX ) has doubled its revenue over the past 11 years through organic growth and acquisitions. It achieved a growing ROE with corresponding improvements in operating efficiencies.
My valuation of TX over the steel price cycle showed that there is more than a sufficient margin of safety. Together with its strong financial position, I would consider this an investment opportunity.
Business background
TX together with its subsidiaries, manufactures, processes, and sells various steel products mainly in South America.
Although it has some mining operations, these serve mainly in-house and are a small component relative to the steel output. For example, in 2022, its mining sales were only 3% of its total revenue.
TX also produces electricity and sells unused balances to the Mexican and Brazilian electric grids. But these external sales were small accounting for about 2% of the 2022 total revenue.
Accordingly, in my analysis and valuation of TX, I focused on steel. TX has a range of steel products covering slab, long, flat rolled, tubular, structural, and construction & cladding materials.
Since I am looking at TX from a high-level perspective, I will look at overall steel tonnage and revenue rather than product types.
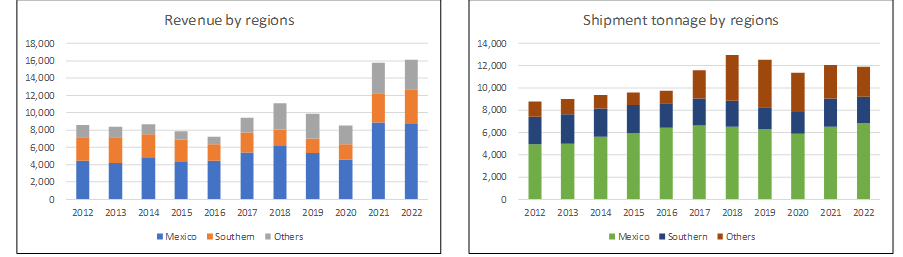
The bulk of TX revenue comes from Mexico. Chart 1 shows the revenue and shipment tonnage trends since 2012.
Chart 1: Revenue and Shipment Trends (Author)
Notes to Chart 1.
a) The Southern region covers Argentina, Bolivia, Chile, Paraguay, and Uruguay.
b) The US is part of the Others category and accounted for 6% of the shipment tonnage in 2022.
TX participates in the control group of Usiminas, a leading flat steel company in the Brazilian market. TX started to acquire significant shares in 2012 and as such, I looked at the performance of TX from 2012.
Cyclical sector
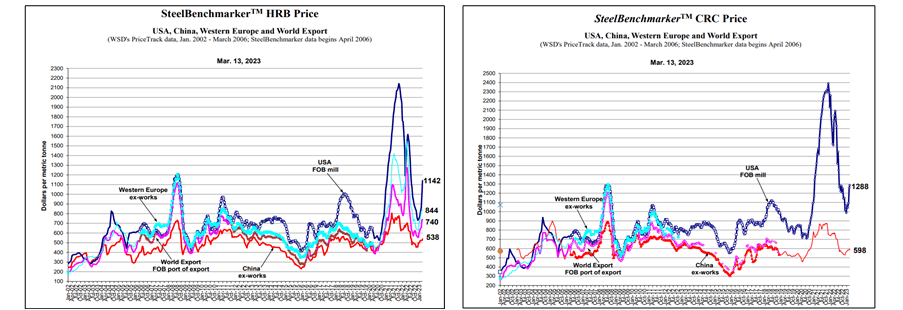
Steel is a cyclical commodity and there are close links with steel prices around the world as illustrated in Chart 2. From 2012 to 2022 covered by my analysis period, there were at least 2 peak-to-peak price cycles.
Chart 2: Steel Prices from Jan 2002 to Jan 2023. (Author from Steel Benchmarker)
You can see that the peak-to-trough prices for the past 2 years had been larger than those before 2020. Prices for the past 2 years were outliers when you look at both metal prices over the past 20 years. You should not be surprised that metal prices today are lower than those in 2022.
Valuation of cyclical companies
Damodaran opined that cyclical companies' performance depends on where they are in the cycle. Extrapolating the performance based on the current earnings and cash flows can lead to misleading valuations.
To overcome the cyclical issue, we have to normalize the performance over the cycle. To reflect the current size of the business, Damodaran suggested that we should take the current revenue and determine the earnings by multiplying it with the normalized margins.
I will develop my financial model of TX based on this approach.
- I took the average 2021 to 2022 tonnage to represent the latest shipment size. If you look at Chart 1, you can see that the shipments for these 2 years were about the same.
- The revenue for this shipment size would depend on the price assumptions.
- The normalized margins would also depend on whether I included the past 2 years' outlier prices.
Operating trends
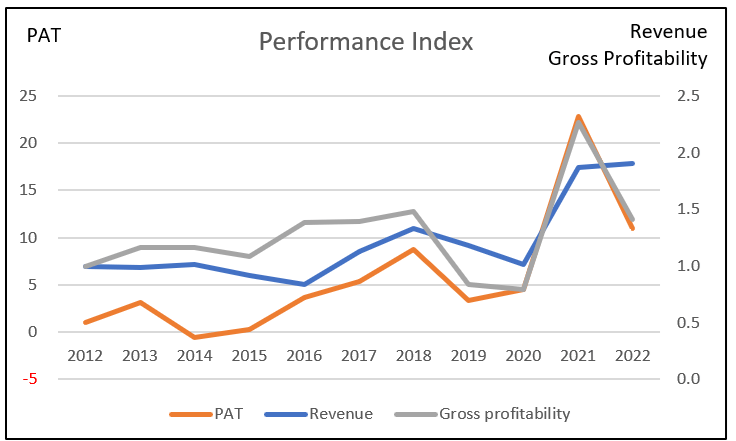
I looked at 3 metrics to get an overview of the overall performance - revenue, PAT, and gross profitability (gross profits / total assets). Refer to Chart 3.
Over the past 11 years, there were growth trends in the 3 metrics with a major hiccup in 2019/20. The dip in 2019 was due to lower steel prices while in 2020 we had Covid-19.
Note that the hiccup in the PAT growth in 2014 was due to the write-downs in the non-controlled entities (mainly Usiminas).
The strong PAT uptrend led to improving ROE from an average of 6 % in 2012/13 to an average of 25 % in 2021/22.
Chart 3: Performance Index (Author)
Note to Chart 3: To plot the various metrics on one chart, I converted the various metrics into indices. The respective index was created by dividing the various annual values by the respective 2012 value.
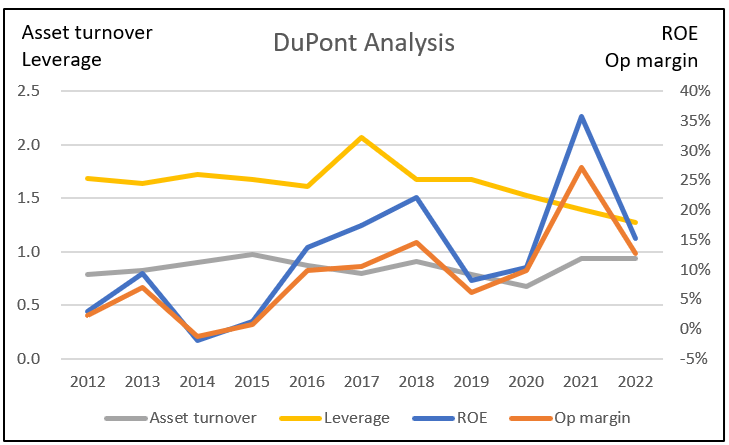
The other positive sign is the growth in gross profitability. This is an indication of improving capital efficiency. This is supported by improving asset turnover and reducing leverage over the past 11 years. Refer to the DuPont analysis in Chart 4.
Chart 4: DuPont Analysis (Author)
1H 2023
In the six months ended 30 June 2023, net sales decreased by 14 % compared to that for the same period in 2022. For the same period, PAT decreased by 33 % compared to that for the first six months of 2022.
This was despite an increase in the shipment of 2% comparing the first 6 months of 2023 with that of 2022.
The main reason for this can be attributed to the 16% reduction in the average selling prices for the first 6 months in 2023 compared to that for 2022.
In the context of long-term cyclical performance, I consider quarterly results as "noisy". I pay less attention to them compared to the longer-term trends.
Growth
Over the past 11 years, steel revenue grew at 6.5 % CAGR due to both acquisitions and organic growth. If nothing else this suggests that it is a mature sector. (Note that total revenue including the mining and electricity sales grew at 6.7% CAGR)
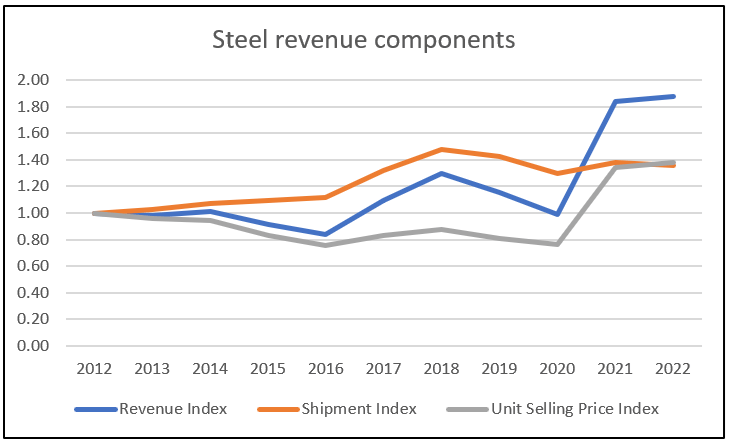
Steel revenue is made up of shipment tonnage and unit selling price. Chart 5 shows the steel revenue trend in terms of these components.
You can see that steel revenue growth was driven more by unit selling price growth than volume growth. From 2012 to 2022:
- Average selling price per ton grew at 3.3 % CAGR. There was a 0.89 correlation between the selling price per ton and steel revenue.
- Volume or shipment tonnage grew at 3.1 % CAGR. There was a 0.60 correlation between shipment tonnage and steel revenue.
The key takeaway is that in developing the financial model of TX, it is more appropriate to derive the steel revenue from shipment tonnage X unit selling price.
Chart 5: Revenue components (Author)
Note to Chart 5: To enable the trends to be seen clearly, I plotted the metrics in index format. The respective index was created by dividing the various annual values by the respective 2012 values.
Reinvestments
Over the past 11 years, the company spent about USD 6.9 billion on CAPEX and USD 3.9 billion on cash acquisitions. A back-of-envelope deduction, assuming proportionate contribution, is that acquisition accounted for about 1/3 of the growth.
Growth needs to be funded and one metric for this is the Reinvestment rate. This is defined as:
Reinvestment with acquisitions = CAPEX & Acquisitions - Depreciation & Amortization + Net Changes in Working Capital.
I then determined the Reinvestment rate = Reinvestment / after-tax EBIT.
Acquisitions are an integral growth driver for the company. As such I have included the annual acquisition expenditure as part of the CAPEX.
Over the past 11 years, the total Reinvestment amounted to USD 7. 0 billion. The after-tax EBIT for the same period came to USD 12.3 b. This resulted in a Reinvestment rate of 57 %.
There is another perspective on the Reinvestment rate that is derived from the fundamental growth equation.
Growth = Return X Reinvestment Rate
Return = EBIT(1-t) / TCE
TCE = Total capital employed = Total equity + total debt - cash - investment in non-controlled entities.
I estimated the annual return on this basis. The average return from 2012 to 2022 then came to 12.5 %.
Taking the historical growth as 6.7% and the Return as 12.5 %, the fundamental Reinvestment rate = 6.7 / 12.5 = 54 %.
Comparing the historical 57 % and the 54 %, I would conclude that the historical rate is close to the fundamental rate. Management had been a good capital allocator.
Did growth over the past 11 years create shareholders' value? For growth to create shareholders' value, the returns have to be greater than the cost of funds.
Over the past 11 years, the average return as measured by EBIT(1-t) / TCE was 12.5 %.
As can be seen from Table 1, this 12.5 % far exceeded the weighted average cost of capital of 10.2 %
Another positive for management - there was shareholders' value creation.
Table 1: Estimating the Cost of Capital (Various)
Note to Table 1: Based on the Google search for the term "Ternium S.A. WACC".
Financial position
I would assess TX as financially sound based on the following:
- It has a 0.08 Debt Capital ratio as of the end of Jun 2023. The steel sector Debt Capital ratio was 0.22 as per the Damodaran Jan 2023 dataset.
- Its average cash conversion cycle only increased slightly from 99 days in 2012/13 to about 106 days in 2021/22.
- As of the end of June 2023, it had USD 2.9 million in cash and short-term investments. This was only about 16 % of its total assets.
- Over the past 11 years, it generated positive cash flow from operations every year.
- It generated about USD 1.5 billion in cash flow from operations annually compared to an annual average PAT of USD 1.1 billion. This is a good cash conversion ratio.
- TX has a good capital allocation track record as can be seen in the following section.
Capital allocation
Over the past 11 years, TX generated about USD 16 billion of funds from cash flow from operations. Refer to Table 2.
You can see that the cash flow from operations was sufficient to fund the dividends & buybacks as well as CAPEX and acquisitions.
I would consider this a good capital allocation plan.
Table 2: Sources and Uses of Funds (Author)
Valuation
The value of a company depends on its expected future cash flow as per the following equation.
Free Cash Flow to the Firm (FCFF) = EBIT(1-t) X (1 - Reinvestment rate).
For a cyclical sector, the key is determining the normalized FCFF. This in turn depends on the normalized EBIT and Reinvestment rate.
Because of the past 2 years' outlier price situation, I broke down the valuation into 2 parts.
- The "normal price" situation as represented by the 2012 to 2020 performance. This is represented by Scenario 1 in Table 3.
- The "outlier price" situation is represented by the 2021 and 2022 performance. This is represented by Scenario 2 in Table 3.
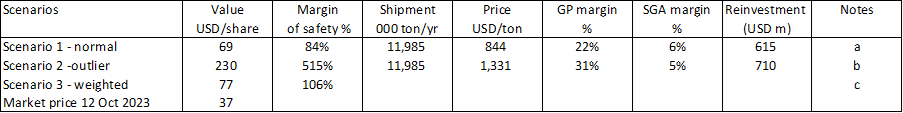
The long-term value of TX is that some probability-weighted scenario. This is represented by Scenario 3 in Table 3 where I assumed that there is a 95 % probability of Scenario 1 and a 5% probability of Scenario 2.
The results of the valuation and the key parameters are shown in Table 3.
There is more than a 30% margin of safety under all Scenarios. The positive sign is that there is even a good margin of safety under Scenario 1.
Table 3 Summary of valuation (Author)
Notes to Table 3:
a) 2021 to 2022 tonnage. For the other parameters, I took the 2012 to 2020 average values to represent the cyclical value.
b) 2021 to 2022 tonnage. For the other parameters, I took the 2021 to 2022 average values to represent the value during the outlier price situation.
c) Weighted average with 95% probability of Scenario 1 and 5 % probability of Scenario 2.
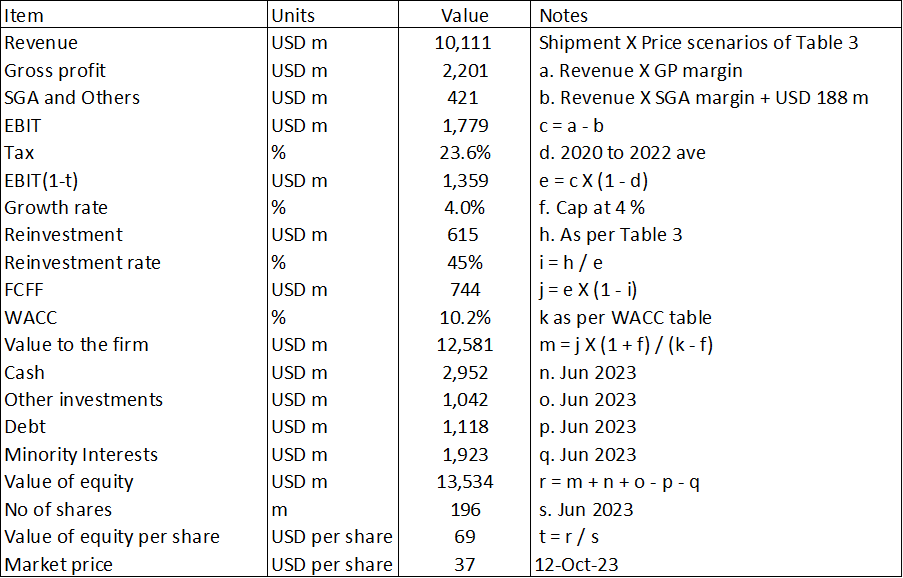
Valuation model
My valuation is based on the single-stage Free Cash Flow to the Firm model as illustrated in Table 4.
The critical parameters in my model are the margins and Reinvestments. These are derived as per the assumptions in Table 3.
Most of the items in Table 4 are self-explanatory except for the following:
Item b. Apart from the SGA, I also included USD 188 million for Others. The Others were to cover the past 11 years' write-offs for depreciation and amortization, forex, legal, and other unusual costs.
Item d. The tax rate was based on the past 3 years' average tax rate.
Item f. I assumed this based on Macrotrends. From 1961 to 2022, the average annual GDP growth rate for Latin America and the Caribbean was 3.5 %.
Risks and limitations
There are 2 critical assumptions in my valuation:
- Large non-operating assets.
- Historical political-economic scenario.
The value of TX comprises the value of the operating assets and the value of the non-operating assets.
The non-operating assets are made up of cash & marketable securities and investments in non-consolidated operations. As can be seen from Table 4, these accounted for about 30% of the equity value.
By convention, I have taken the book value of these items as the intrinsic value. These could be impaired in an economic downturn such as what happened in 2014.
One possible mitigation is to seek a higher margin of safety.
Secondly, my valuation is based on historical data. You may argue that the current geopolitical situation and the persistent high inflation may mean a different economic situation. Note that this will also affect the value of the non-operating assets.
I do not have a crystal ball to see what will happen over the next decade. I doubt anyone has one. The only way is to look for higher margins of safety. I think that the margins of safety shown in Table 3 should provide comfort.
Conclusion
TX has achieved revenue and profit growth over the past 11 years due to a combination of organic growth and acquisitions.
TX is fundamentally sound based on the following:
- There is an improving ROE accompanied by improving operating efficiencies.
- It is financially sound.
- It has a good capital allocation plan with a sustainable Reinvestment rate.
- It has been able to create shareholders' value.
My valuation of TX based on its performance over the steel price cycle showed that there is a sufficient margin of safety. I see this as an investment opportunity.
I am a long-term value investor and my analysis and valuation are based on this perspective. This is not an analysis for those hoping to make money over the next quarter or so.
Editor's Note : This article was submitted as part of Seeking Alpha's Best Value Idea investment competition , which runs through October 25. With cash prizes, this competition -- open to all contributors -- is one you don't want to miss. If you are interested in becoming a contributor and taking part in the competition, click here to find out more and submit your article today!
For further details see:
Ternium: Improving Fundamentals And Good Margin Of Safety