VWAPY - Tesla: From Hold To Buy - But Be Careful: Don't Overweight It (Upgrade)
Summary
- In this analysis, I will show you why I have changed my hold rating for Tesla, Inc. to a buy.
- One of the reasons why I have changed my rating for Tesla is the company's currently significantly lower valuation compared to the past.
- However, the risk of investing in Tesla continues to be high: therefore, I suggest not to overweight its stock in your investment portfolio.
Investment Thesis
Tesla, Inc.’s ( TSLA ) valuation has decreased significantly within the past 12 months: at this moment of writing, the company has a P/E [FWD] Ratio of 36.36, which is 72.29% below its Average P/E [FWD] Ratio over the past 5 years. My updated discounted cash flow ("DCF") Model indicates an annual rate of return of 12% for the company at its current stock price.
For this reason, I have changed my hold rating, which the company received in my analysis of Tesla back in November 2022, to a buy rating. In that same previous analysis, I discussed in more detail the company’s strong competitive advantages: I mentioned its artificial intelligence and culture of innovation, the company’s strong brand image and customer loyalty as well as its own supply chain.
In today’s analysis, the main focus will be on Tesla’s current valuation and the Risk Factors that come attached to an investment in the company. Even though I have changed my Tesla rating from hold to buy (particularly due to the company’s lower valuation), I still see a lot of risk factors for investors: these risk factors contribute to the fact that I recommend that you don't overweight TSLA stock in your investment portfolio.
Tesla’s Performance over the past 12 Months
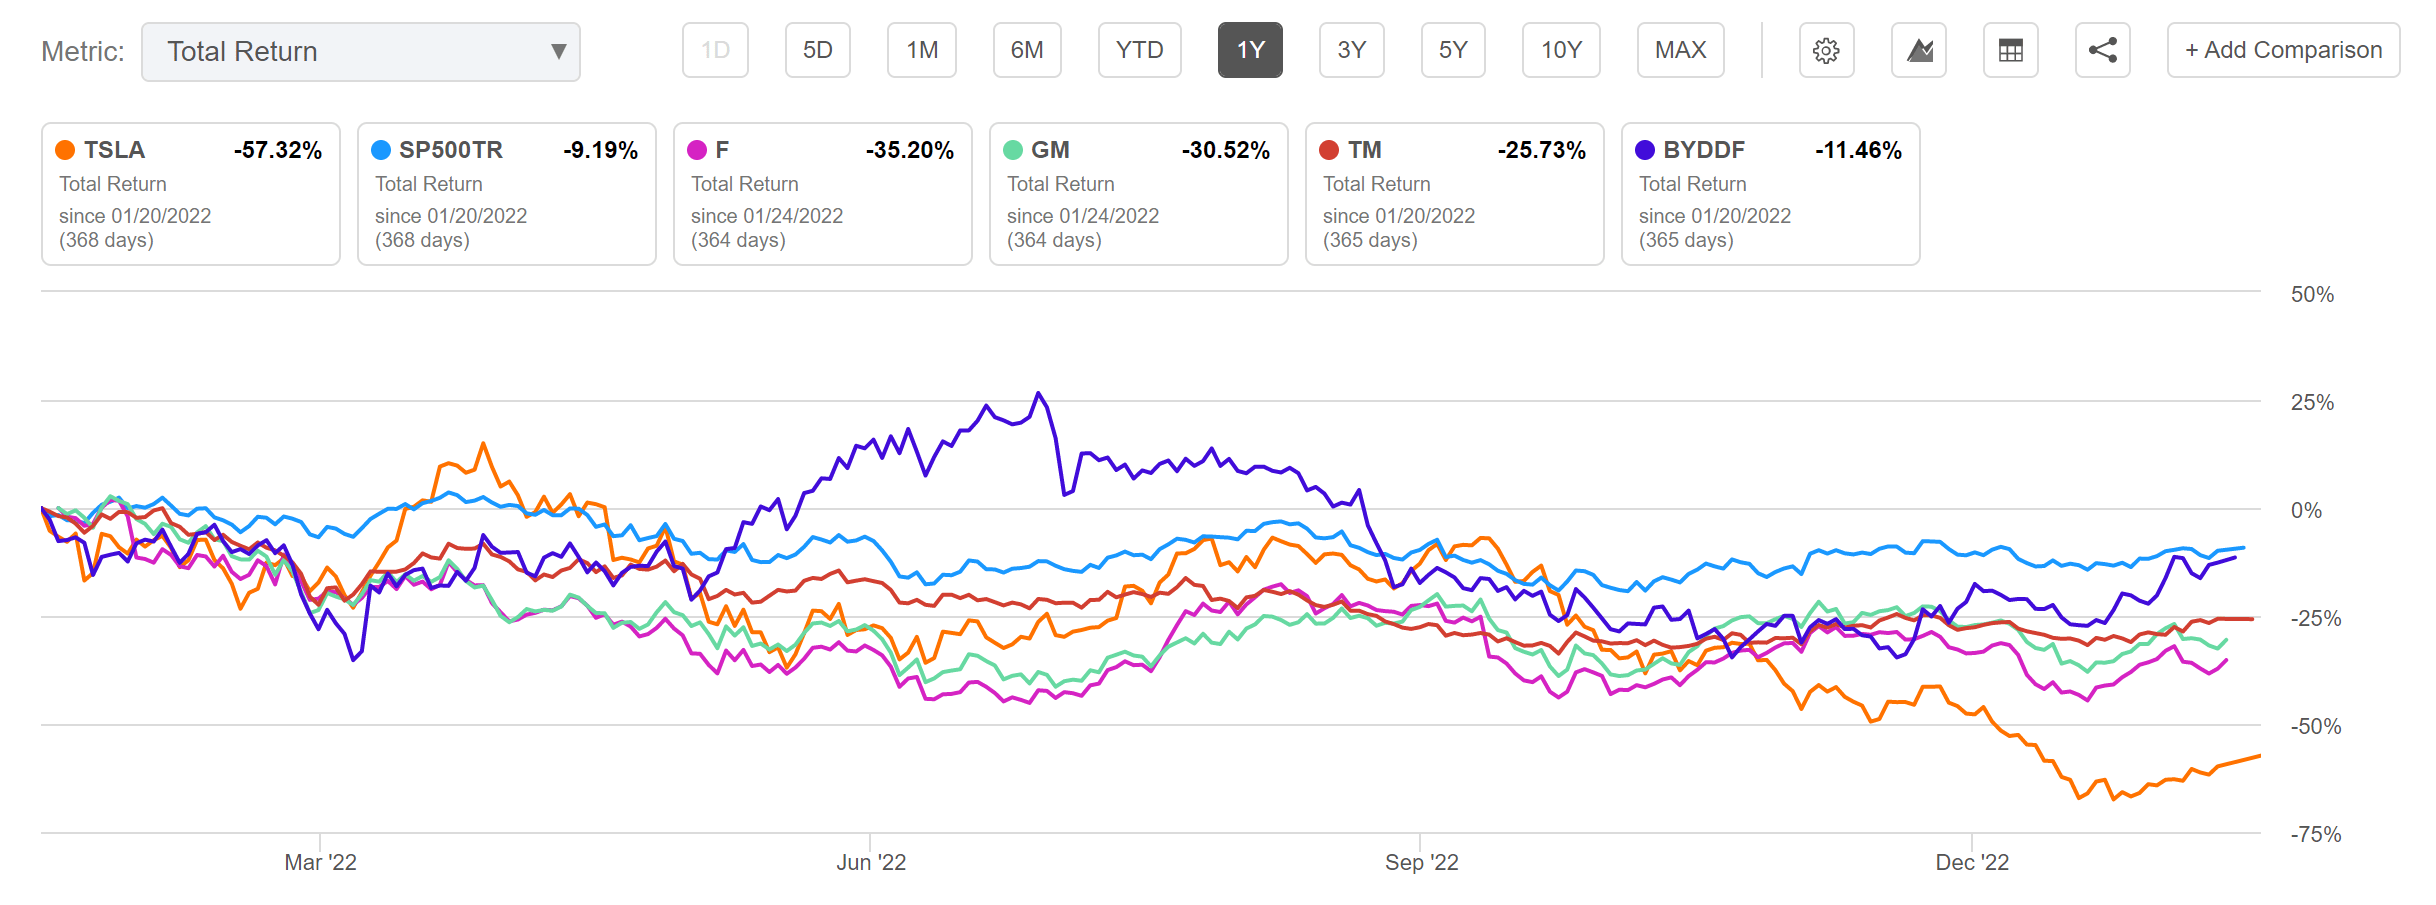
Tesla’s performance within the past 12 months has been far inferior to the performance of the S&P 500 (SP500) and compared to its competitors from the Automobile Manufacturers Industry: while the S&P 500 has been down 9.19% within one year, Tesla has shown a total return of -57.32%.
Tesla’s competitor BYD (BYDDY) has shown a performance of -11.46% over the same time period, while Toyota’s ( OTCPK:TOYOF , NYSE: TM ) total return has been -25.73%, General Motor’s (NYSE: GM ) -30.52% and Ford’s (NYSE: F ) -35.20%. In the graphic below you can find the total return of the Tesla stock within the past 12 months when compared to the S&P 500 as well as its competitors.
Tesla has reached a valuation that makes the stock worth buying from my point of view, even though I still consider the risk of an investment to be high, as I will show in the risk section of this analysis. Due to this risk, I recommend that you do not overweight the Tesla stock in your investment portfolio.
The Valuation of Tesla
Discounted Cash Flow [DCF]-Model
My DCF Model calculates a fair value of $147.67 for Tesla. At the time of writing, Tesla’s stock price is $144.00, which implies an upside of 2.6%. In the calculation below, I calculated with a Revenue and EBIT Growth Rate of 25% for Tesla in the following 5 years. Furthermore, I calculated with a Perpetual Growth Rate of 4% afterwards.
My calculations are based on these assumptions, as presented below (in $ millions except per share items):
| Tesla |
| Company Ticker |
| TSLA |
| Tax Rate |
| 11% |
| Discount Rate [WACC] |
| 11.25% |
| Perpetual Growth Rate |
| 4% |
| EV/EBITDA Multiple |
| 27.6x |
| Current Price/Share |
| $144.00 |
| Shares Outstanding |
| 3,158 |
| Debt |
| $5,874 |
| Cash |
| $21,107 |
| Capex |
| $7,119 |
Source: The Author.
Based on the above, I have calculated the following results for Tesla:
Market Value vs. Intrinsic Value
| Tesla |
| Market Value |
| $144.00 |
| Upside |
| 2.6% |
| Intrinsic Value |
| $147.67 |
Source: The Author.
Internal Rate of Return for Tesla
Below you can find the Internal Rate of Return as according to my DCF Model. I have assumed different purchase prices for the Tesla stock, which you can see in the table below (I would like to reiterate that I have assumed a Revenue and EBIT Growth Rate of 25% for the company for the upcoming five years and a Perpetual Growth Rate of 4% afterwards).
At Tesla’s current stock price of $144.00, my DCF Model indicates a compound annual rate of return of approximately 12% for the company. (In bold you can see the Internal Rate of Return for Tesla’s current stock price of $144.00.)
| Purchase Price of the Tesla Stock |
| Internal Rate of Return as according to my DCF Model |
| $120.00 |
| 16% |
| $125.00 |
| 15% |
| $130.00 |
| 14% |
| $135.00 |
| 14% |
| $140.00 |
| 13% |
| $144.00 |
| 12% |
| $150.00 |
| 11% |
| $155.00 |
| 10% |
| $160.00 |
| 9% |
| $165.00 |
| 9% |
| $170.00 |
| 8% |
| $175.00 |
| 7% |
Source: The Author.
Tesla’s Fundamentals in comparison to its competitors
Besides the fact that Tesla’s stock price has fallen significantly within the past 12 month period, the company’s market capitalization is still far higher than most of its competitors: at this moment of writing, Tesla’s market capitalization of $453.93B is about 2x higher than the one of Toyota (market capitalization of $196.80B), more than 4x higher than BYD’s ($103.71B), more than 5x higher than Volkswagen’s ( OTCPK:VWAGY , OTCPK:VWAPY ) ($79.52B) and more than 8x higher than Ford’s ($51.46B) or General Motors’ ($51.77B). At the same time, however, Tesla’s Revenue [TTM] of $74.86B is still far inferior to the Revenue of rivals such as Volkswagen (Revenue of $261.24B), Toyota ($232.21B), Ford ($151.74B) or General Motors (147.21B).
However, looking at the Growth Rates of the companies, it becomes clear why Tesla has such a high Valuation in comparison to its competitors: the company has shown a Revenue Growth Rate [CAGR] of 47.41% over the past 5 years, which is significantly higher than the Revenue Growth Rate of opponents such as BYD (Revenue Growth Rate [CAGR] of 26.48% over the past 5 years), Toyota (3.19%), Volkswagen (3.23%), General Motors (-0.08%) or Ford (-0.31%).
The same is proven when comparing the companies’ EBIT Growth Rates [CAGR] over the past 3 years: Tesla’s EBIT Growth Rate [CAGR] of 333.75% over the past 3 years is far superior to the likes of Ford (EBIT Growth Rate [CAGR] of 25.07%), BYD (23.30%), General Motors (13.31%), Volkswagen (4.28%) or Toyota (-2.90%). This indicates that Tesla has raised its earnings to a much higher degree than its opponents have.
Tesla is also clearly ahead of its competitors when it comes to Profitability: while Tesla has an EBITDA Margin of 21.39%, the EBITDA Margin of General Motors is 12.24%, Toyota’s is 11.91%, Volkswagen’s is 11.34%, Ford’s is 10.99% and BYD’s is only 7.66%.
Proof of Tesla’s high Profitability is also found in the company’s Return on Equity of 32.24%, which is clearly superior when compared to competitors Ford (Return on Equity of 22.49%), General Motors (14.55%), BYD (10.46%), Volkswagen (10.19%) or Toyota (9.29%).
Tesla’s higher Growth Rates and the company’s higher Profitability when compared to its competitors contribute significantly to my current buy rating on the Tesla stock.
The High-Quality Company [HQC] Scorecard
“The aim of the HQC Scorecard that I have developed is to help investors identify companies which are attractive long-term investments in terms of risk and reward.” Here you can find a detailed description of how the HQC Scorecard works.
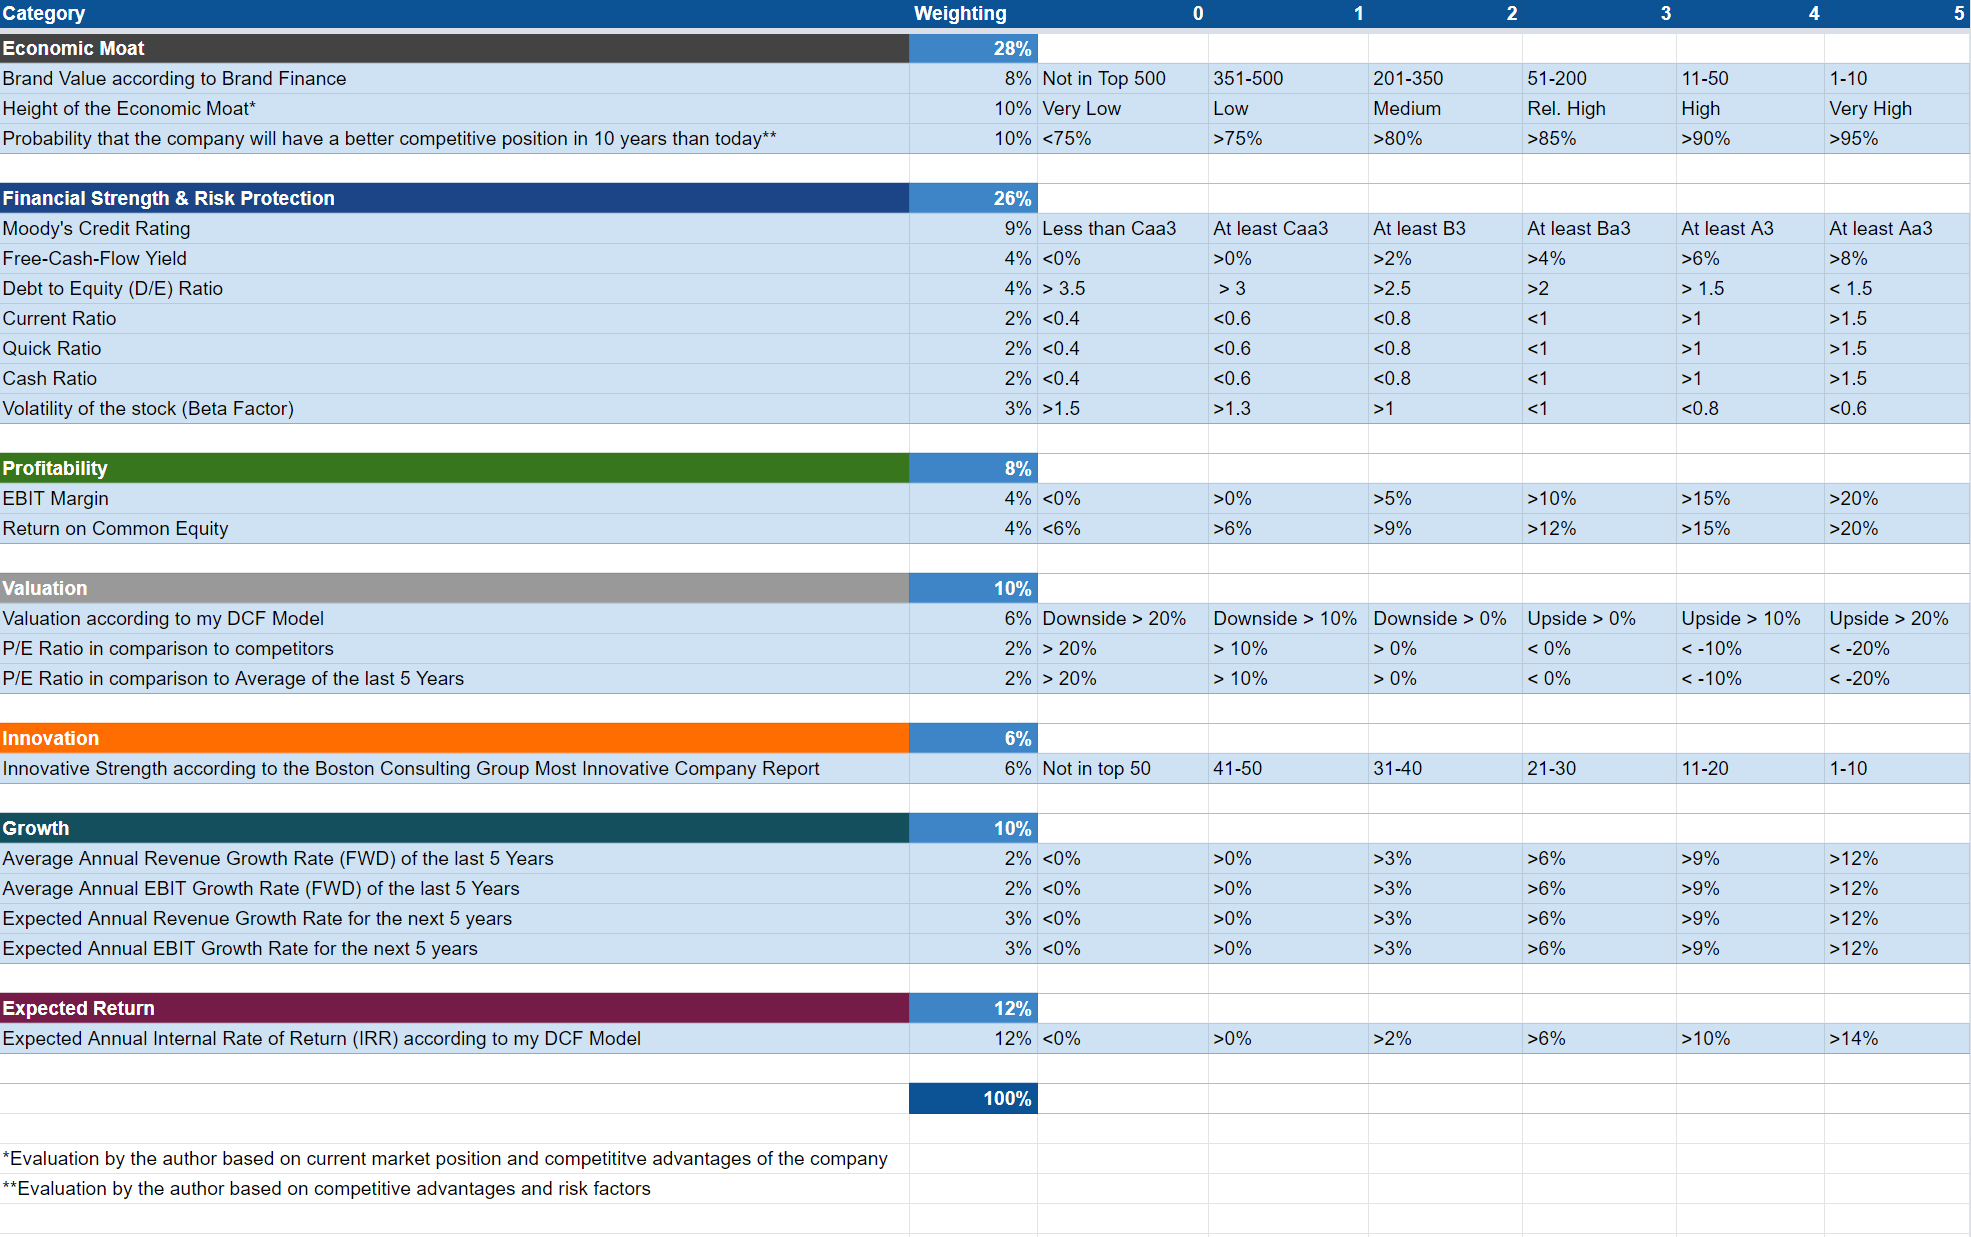
Overview of the items on the HQC Scorecard
“In the graphic below, you can find the individual items and weighting for each category of the HQC Scorecard . A score between 0 and 5 is given (with 0 being the lowest rating and 5 the highest) for each item on the Scorecard. Furthermore, you can see the conditions that must be met for each point of every rated item.”
Tesla According to the HQC Scorecard
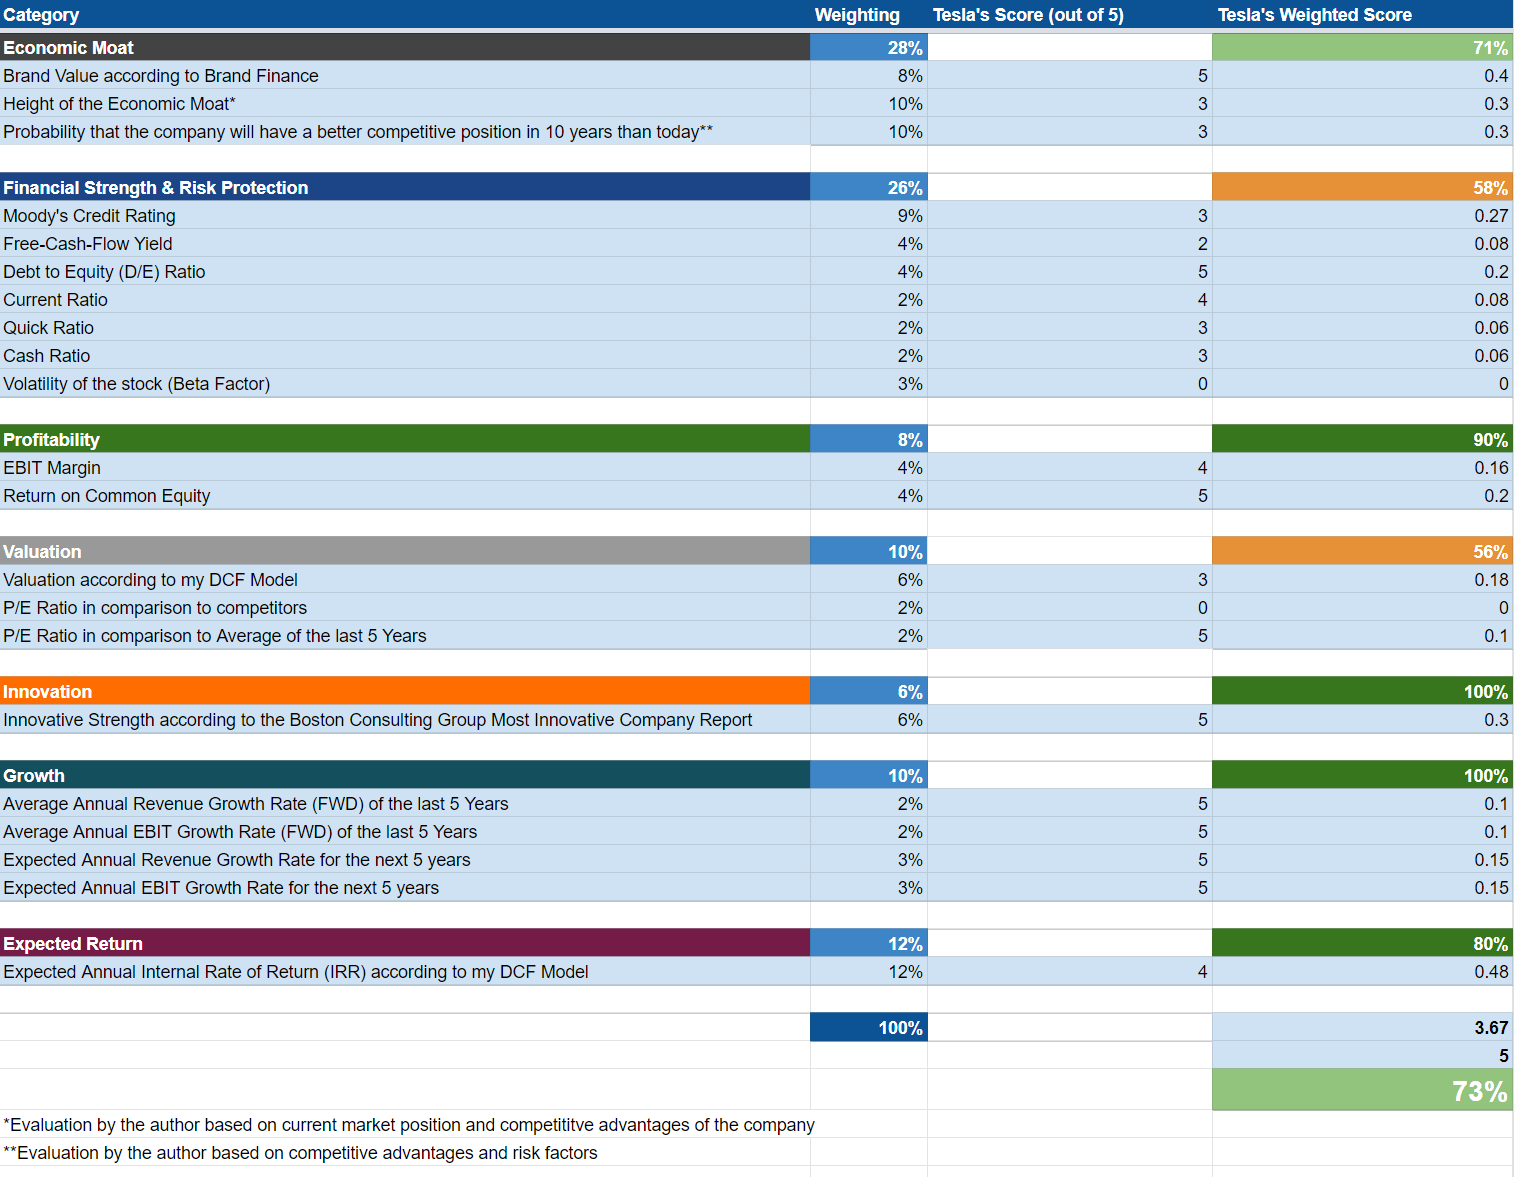
According to the HQC Scorecard, Tesla receives an attractive rating in terms of risk and reward, achieving 73 out of 100 possible points.
The company is rated as very attractive in the categories of Innovation (100/100), Growth (100/100), Profitability (90/100) and Expected Return (80/100).
In the category of Economic Moat, Tesla receives 71/100 points, which implies an attractive rating.
Only in the categories of Financial Strength (58/100) and Valuation (56/100), is the company rated as moderately attractive.
Tesla’s attractive overall rating in terms of risk and reward as according to the Scorecard strengthens my confidence to classify the company as a buy.
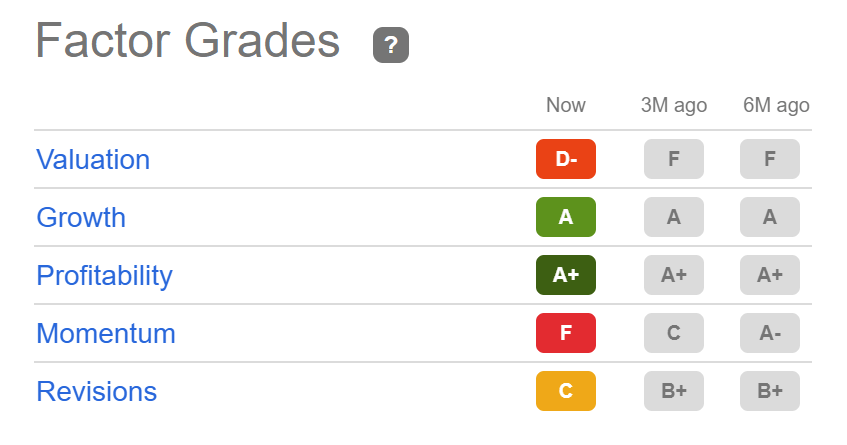
Tesla According to the Seeking Alpha Quant Factor Grades
According to the Seeking Alpha Factor Grades, Tesla shows excellent results in the categories of Growth (A rating) and Profitability (A+ rating). In addition to that, Tesla’s rating in terms of Valuation is better today than it was 3 months ago: today Tesla receives a D- rating for Valuation, while it received a F rating 3 months ago. This underlines my theory that Tesla’s Valuation is currently more attractive than it has been in the past.
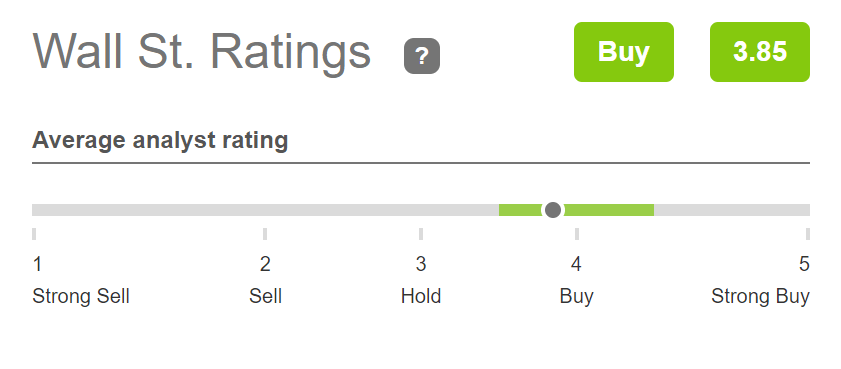
Tesla According to the Wall Street Analysts Rating
According to the Wall Street Analysts Rating, Tesla is currently a buy, which reinforces my own buy rating for the Tesla stock.
Risks
I still see a lot of different risk factors for Tesla investors.
One of the main risk factors I continue to see for Tesla investors is if the company was not able to reach its targets in terms of Growth. In my DCF Model, which indicates a compound annual rate of return of 12% for Tesla, I have calculated with an Average Revenue and EBIT Growth Rate of 25% for the company in the coming 5 years. If both this Revenue and EBIT Growth Rate were not to be reached, investors would likely see much lower compound annual rates of return for the company. This risk factor of high Growth Rates being already priced into Tesla’s stock price, contributes significantly to the fact that I recommend you don’t overweight its stock in your investment portfolio. Overweighting the Tesla stock would imply the risk that your investment portfolio could lose too much value in a relatively short amount of time if the company was not able to reach its Growth targets.
Furthermore, Tesla’s P/E [FWD] Ratio is still much higher than the P/E Ratio of its competitors; even though it is much lower than it has been on Average over the past 5 years. While Tesla’s P/E [FWD] Ratio is currently 36.36, Ford’s is 6.45 and General Motors’ is 5.10. Tesla’s high P/E [FWD] Ratio in comparison to its competitors is another indicator that the company’s stock price could drop significantly if it was not able to reach its Growth targets.
In my previous analysis on Tesla , I also mentioned that I see a possible declining brand value as a risk factor for investors:
“In addition to that, I also see other events that could cause Tesla's brand value to decline as being risk factors for investors. This is because the valuation of Tesla is also based on its high brand value and a lower brand value could cause lower customer loyalty, have an impact on the profits of the company and could cause the price of the Tesla stock to drop significantly.”
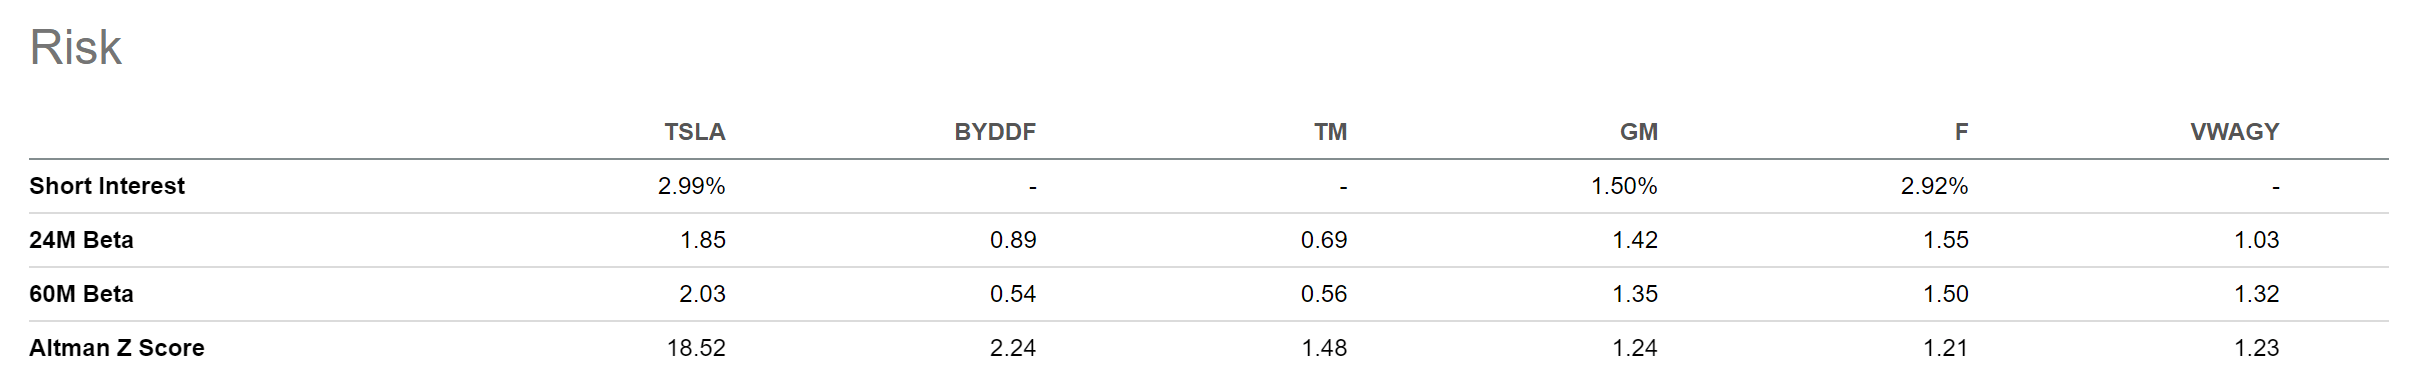
When taking a closer look at the company’s Beta Factor, we get further proof that an investment in Tesla comes attached with a high level of risk: the company’s 60M Beta is 2.03. This implies that if the broader stock market were to decrease by 5%, the Tesla stock could decrease by approximately 10%, providing evidence that an investment in the company is related with high risk factors.
Below you can find Tesla’s 24M and 60M Beta compared to competitors such as BYD, Toyota, General Motors, Ford and Volkswagen, demonstrating that the volatility of the Tesla stock is extremely high.
Tesla’s high volatility supports my theory to recommend that you don't overweight the company’s stock in your investment portfolio. In my opinion, the performance of your investment portfolio should not depend too much on the performance of such a volatile stock as Tesla.
The Bottom Line
In the past, Tesla’s Valuation was so high, that it only received my hold rating. Today, Tesla has a P/E [FWD] Ratio of 36.36. This is still not cheap, but its current Valuation is 72.32% below its Average P/E [FWD] Ratio over the past 5 years (which is 131.34).
At the same time, my DCF Model indicates a compound annual rate of return of 12% for Tesla. In my opinion, this makes the company a high risk / high reward stock and this is the main reason for which I have changed my Tesla rating from hold to buy.
However, due to the elevated risk factors that still come with an investment in Tesla, I would like to reiterate that I recommend you do not overweight its stock in your portfolio: In case you were to overweight the stock, the performance of your portfolio would depend too much on a very risky and volatile stock.
By underweighting Tesla’s stock in your investment portfolio, you can benefit from the excellent growth opportunities the company offers, but don't let the risk that comes with a Tesla investment become too big.
Thank you for reading! I would love to hear your opinion on this Tesla analysis and to know if you consider the Tesla stock to currently be a buy, hold or sell!
For further details see:
Tesla: From Hold To Buy - But Be Careful: Don't Overweight It (Upgrade)