DRIV - Tesla Is In Charging Mode (Technical Analysis)
2023-07-28 11:00:57 ET
Summary
- Tesla, Inc. stock has formed a rally and could be entering its last wave of an uptrend, but there is a possibility of a bearish scenario.
- The U.S. technology and consumer cyclical sectors have shown strong leadership in the stock market rally, with auto manufacturers performing particularly well.
- In this technical article, I show important price levels and metrics that investors could consider for gaining an edge on the stock’s likely price action.
- I continue to rank Tesla stock as a hold position, while I would consider scaling into the stock when the described pivot point would form.
Tesla, Inc. (TSLA) stock has bottomed and formed a rally that projected the stock out of its downtrend. The stock is facing an important technical situation that could lead to forming its last wave of the ongoing uptrend, while investors should also prepare for the possibility of seeing the stock failing in its attempt and dropping into a more bearish scenario. In this article, I discuss technical elements that underscore the increasingly high chances of seeing the stock performing positively, while the uncertainty around the actual retracement is leading me to continue qualifying the stock as a hold position.
A quick look at the big picture
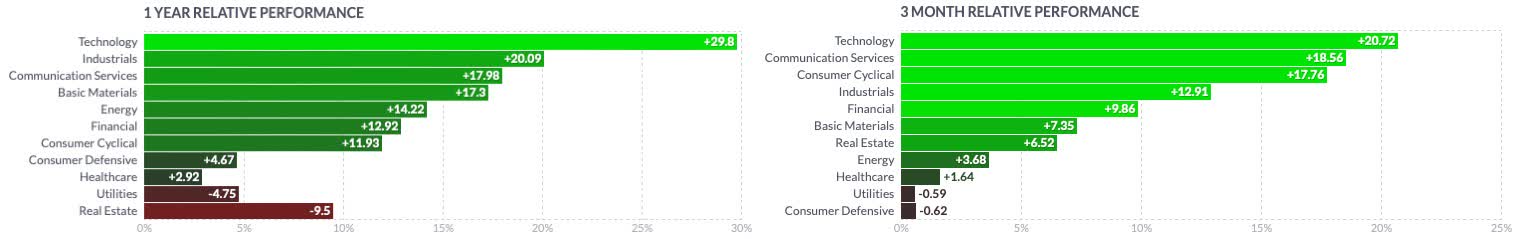
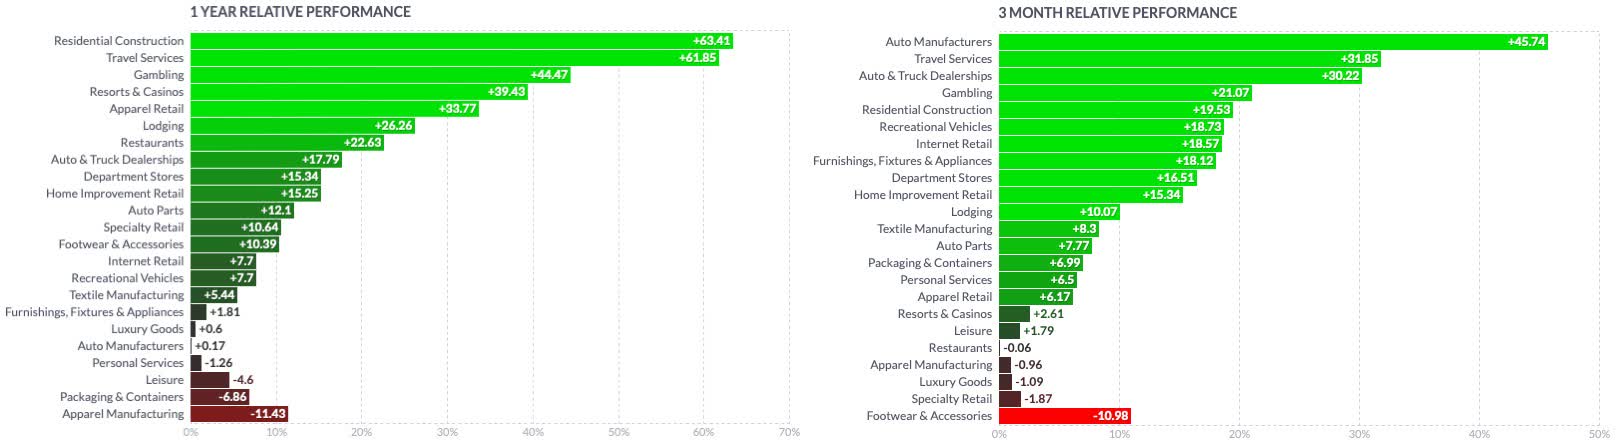
The U.S. technology sector together with the U.S. consumer cyclical sector has demonstrated particularly strong leadership during the ongoing rally in the U.S. stock market. While on a yearly time frame technology companies have massively outperformed all sectors, companies offering cyclical products have started to recover more recently, after an extended period of negative performance. Although footwear and accessories, luxury goods, and apparel manufacturers continue to struggle, companies in the auto manufacturing industry have reported a stellar performance in the current year, leading the sector with over 45% performance in the past 3 months, being supported by tailwinds such as the normalization of global supply chains and the improved consumer confidence.
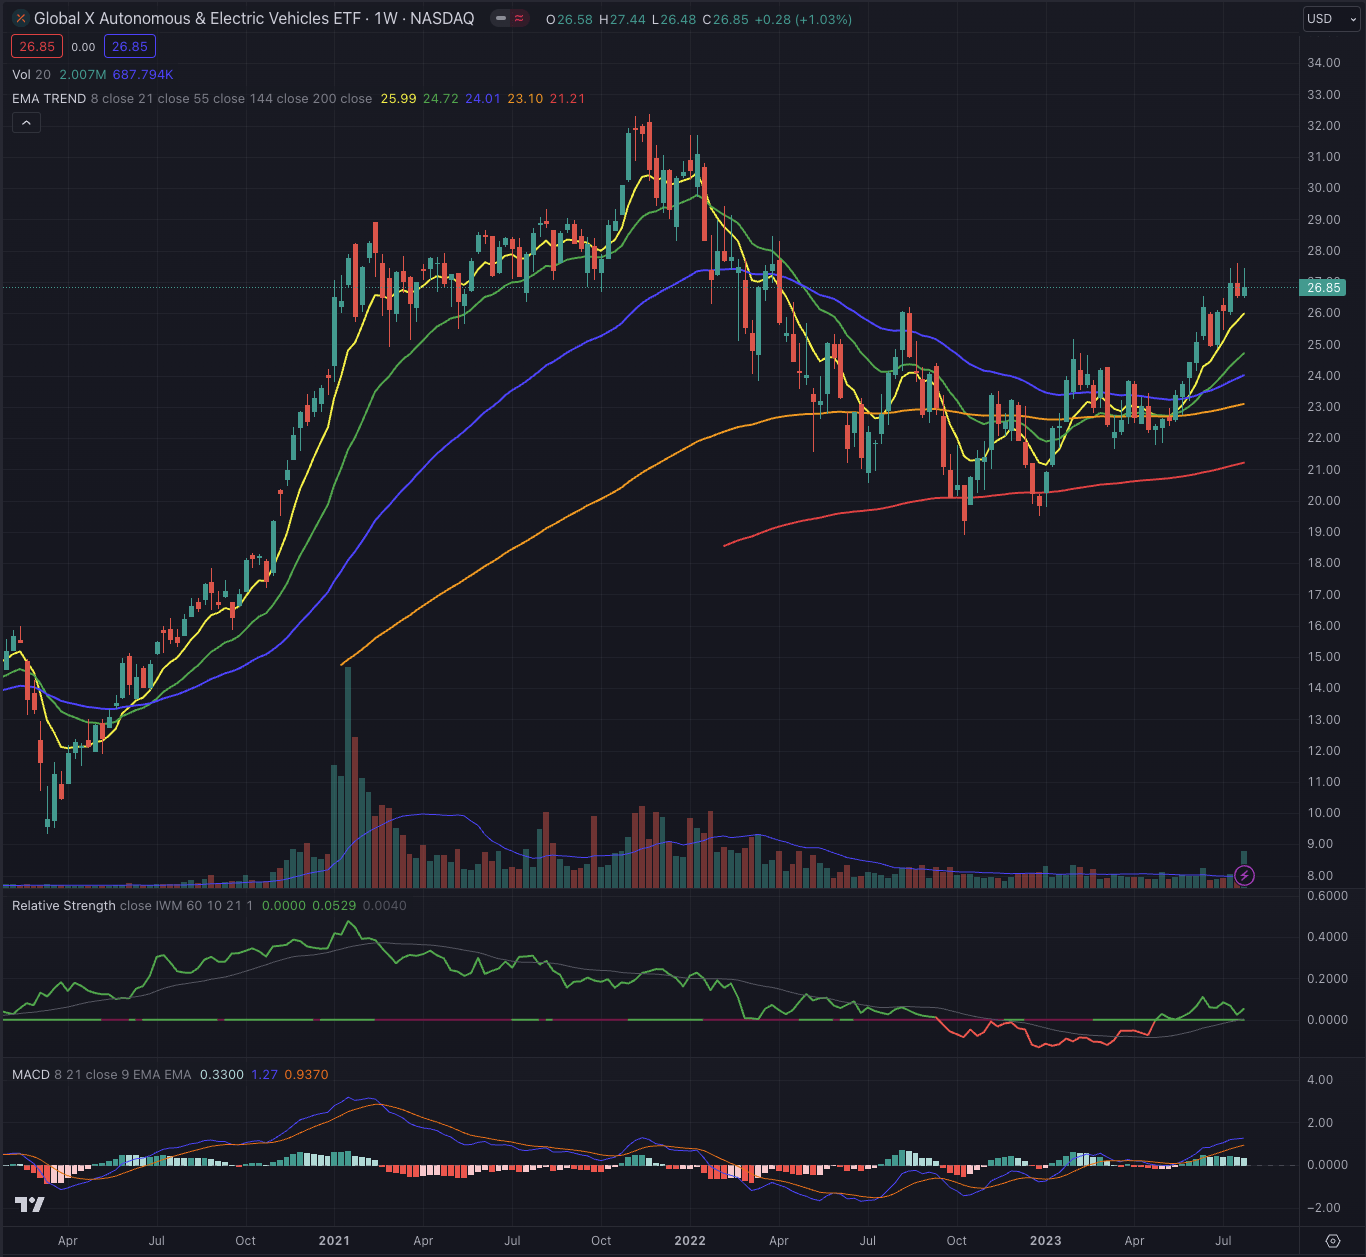
The Global X Autonomous & Electric Vehicles ETF (DRIV) has abandoned its medium-term downtrend after having bottomed in October 2022. The industry benchmark has started a new strong uptrend, after confirming the breakout from its EMA55 on its weekly chart, while its EMA8 has since been acting as trailing support. It's also important to note that the benchmark is building some relative strength when compared to the broader stock market, the iShares Russell 2000 ETF (IWM). Overall, DRIV could be set for more strength, while it would not surprise me to see it retracing towards its EMA21 before continuing in its ascension.
Where are we now?
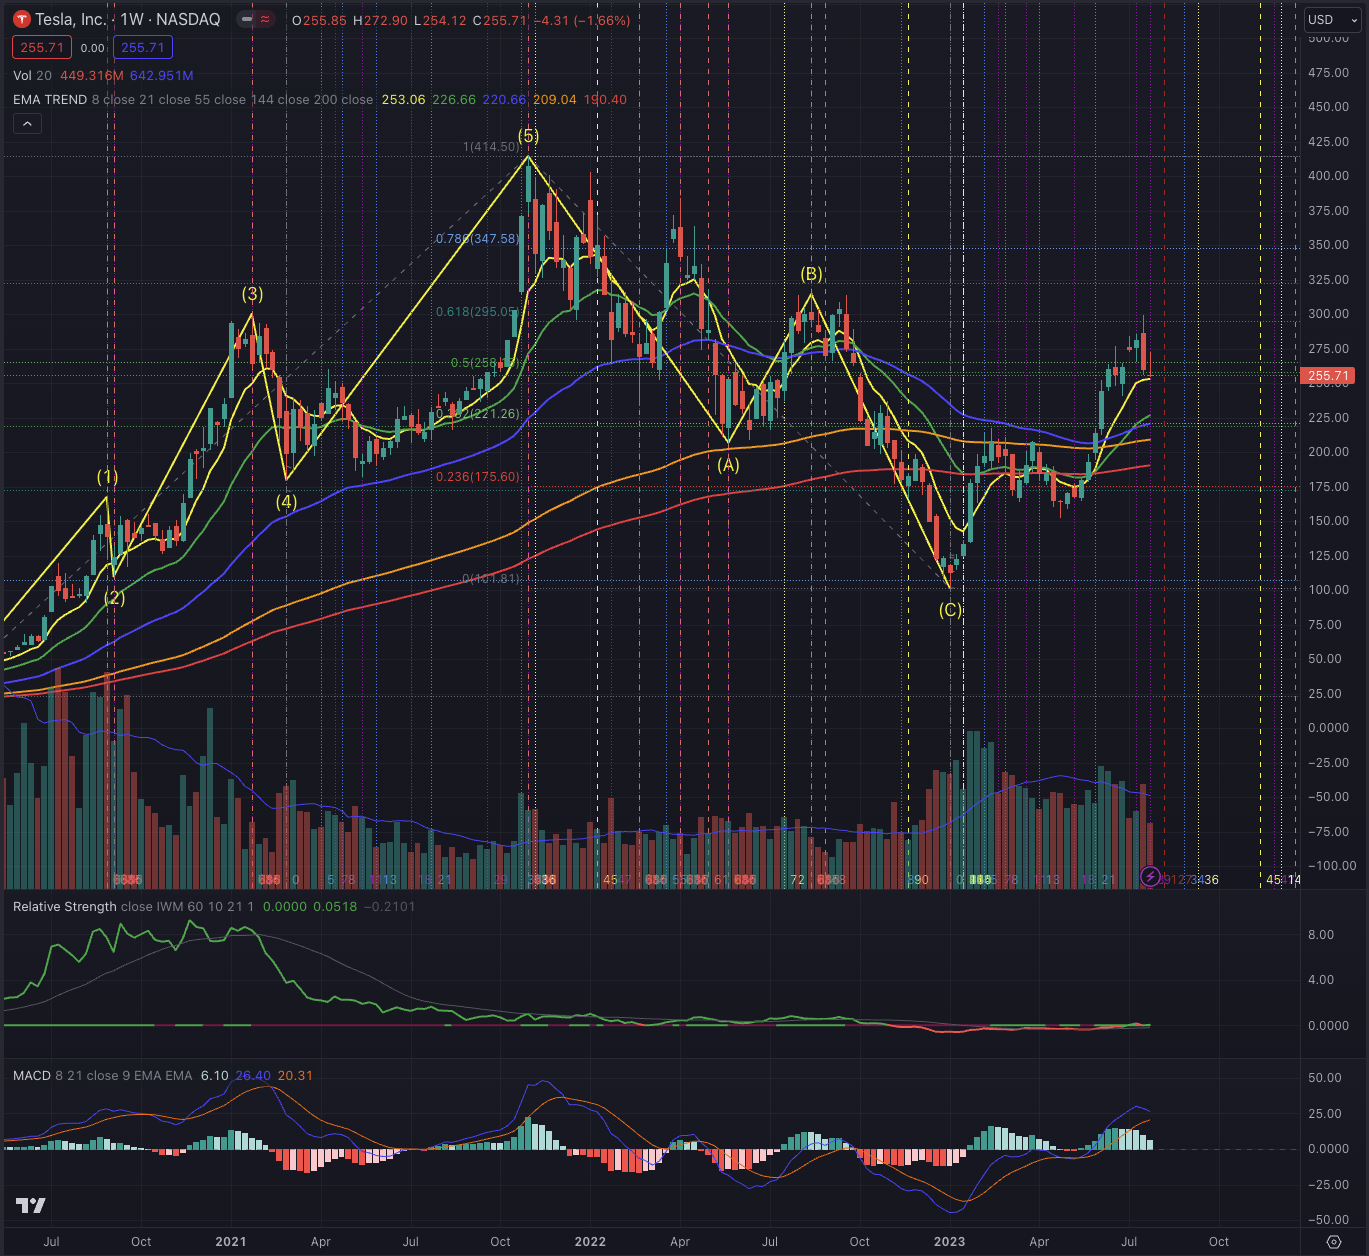
In my article " Tesla Is Running Low In Power " published on February 27, 2023, I discussed the uncertainty of the stock's situation, hinting at two scenarios I considered the most likely. While my assumption of a successful completion of a downward impulse sequence has been invalidated, TSLA's price action has developed into my alternative scenario.
Here, the downward movement should be considered as a corrective sequence and the recent surge could be the beginning of a new upward sequence. Investors interested in the stock could then scale in progressively, while bearing in mind that very often a stock will fall back once it broke out, testing its support and confirming the breakout. That's usually a great opportunity to load up more shares, but only if the stock shows resilience in its price action.
The corrective sequence shows a proportion of waves A and C of 0.641, a measure I retain as significant to validate the inverted Fibonacci quotient of 0.618. TSLA bottomed on January 6, 2023, at $101.81 and has since overcome its most important resistances with important shake-offs around the EMA200, which allowed the stock to run even further to almost $300. A massive performance of almost 200% in only 6 months.
Despite the recent rally and breaking out from its downtrend, on its weekly chart, TSLA hasn't been able to build relative strength and is hovering along with the broader equity market. I certainly welcome the breakout, which has been characterized by surging volume and massive accumulation days, but the actual price action seems to miss some conviction, and it's worth exploring further likely scenarios and being prepared for multiple outcomes.
What is coming next?
After observing TSLA's weekly chart, it's now important to focus on the daily chart, a time frame I often use to define the next tactical steps in my investment strategy.
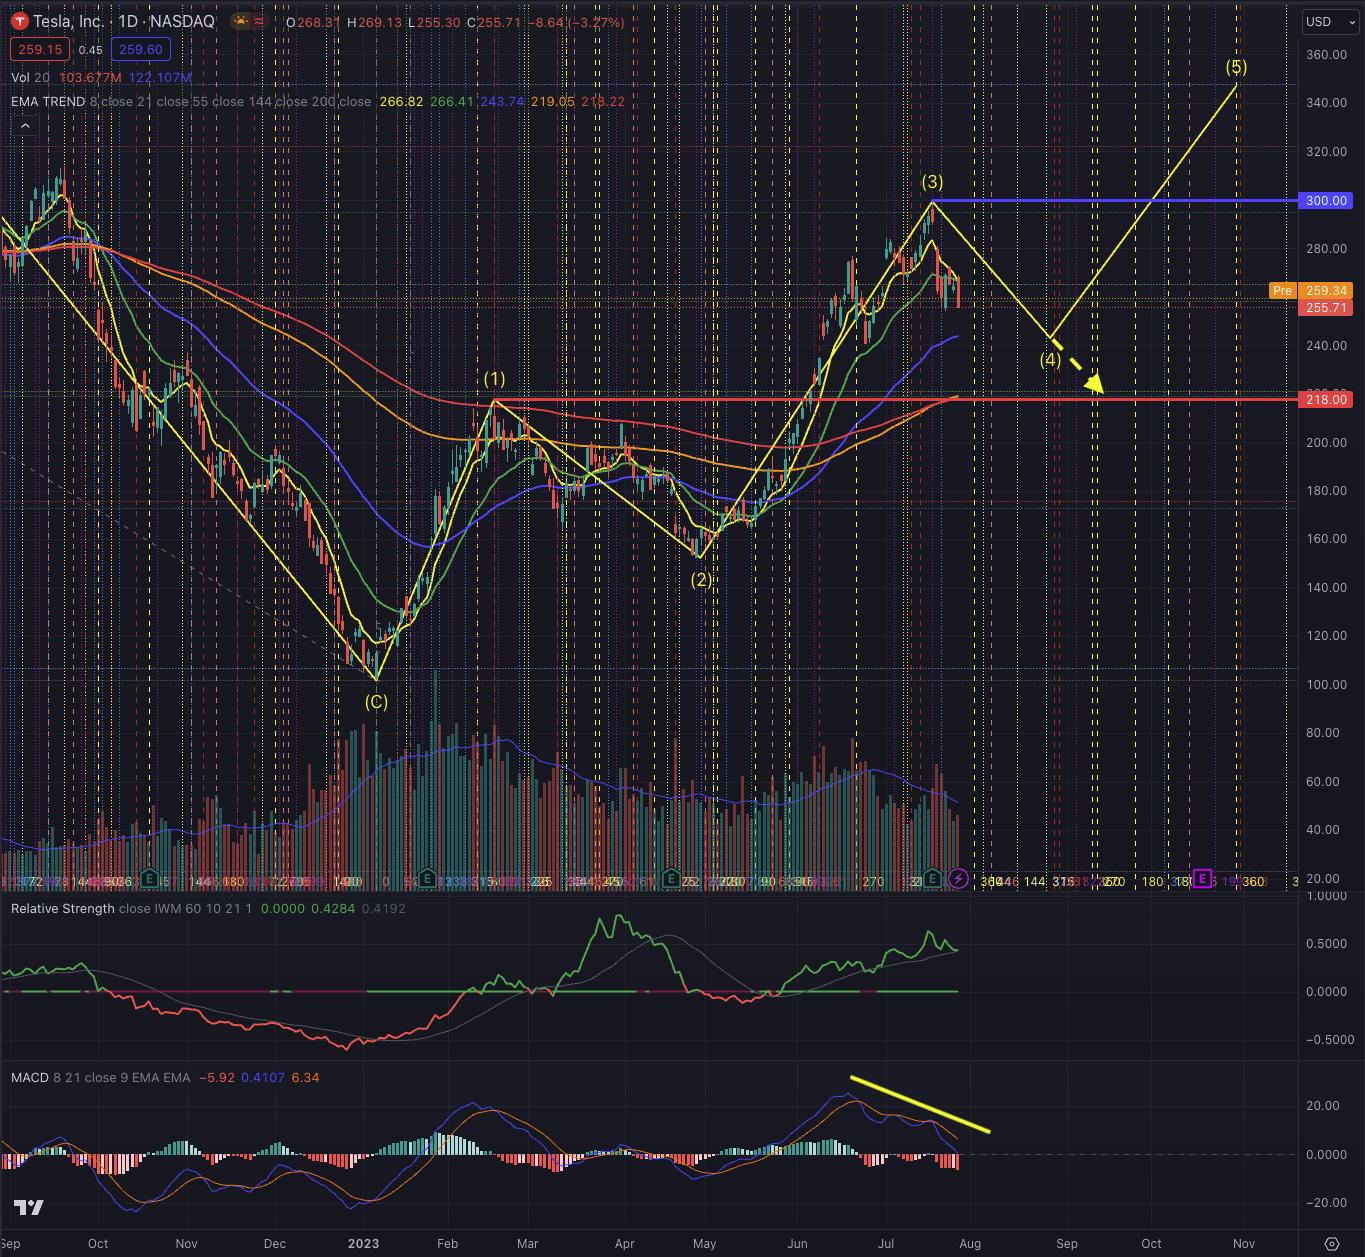
On its daily chart, TSLA has been forming what could be a new upward impulse sequence, now running into wave 4. This assumption would see TSLA falling further in the short term, to likely $243, but no more than $217.66. The completion of wave 4 would give investors the chance to scale into the stock while it forms wave 5. At this point, it's too early to estimate the outcome of this wave, but as a rule of thumb, the deeper wave 4 will fall, the higher the chance to see wave 5 extending.
My assumption of wave 4 forming is also sustained by the bearish divergence TSLA has formed with the MACD, which hints to further downside risk, and the decreasing buy volume, observed since the recent peak.
As a shareholder, I would certainly hold TSLA until the chart shows me a clearer picture of the price action, but I would sell the stock if it falls under $218 and break into the territory of wave 1, as this would imply a more bearish scenario and would invalidate my assumption of a new impulse sequence.
Shareholders or new investors interested in adding shares could take the chance to wait until the stock has bottomed in its wave 4 formation, to scale in and take part in the likely run of wave 5. This scenario will see the MACD forming an inversion in a bullish setup. To see wave 5 extending, the stock will have to overcome the strong resistance at around $295-300. If it fails, a new trading range would form between $218 and $300. This scenario would then be of particular interest to swing and momentum traders.
Investors should pay particular attention to the relative strength of TSLA and confirm their entry point by observing the volume. Wave 5 will most likely need a significant increase in buy-side volume and ideally the stock would show an important buildup in relative strength.
The actual situation of uncertainty around the bottom of wave 4, and the possibility of seeing the stock falling back more than assumed, lead me to continue to rate TSLA as a hold position; while I would consider buying the stock if a pivot into wave 5 is confirmed.
The bottom line
Technical analysis is not an absolute instrument, but a way to increase investors' success probabilities and a tool allowing them to be oriented in whatever security. One would not drive towards an unknown destination without consulting a map or using a GPS. I believe the same should be true when making investment decisions. I consider techniques based on the Elliott Wave Theory, as well as likely outcomes based on Fibonacci's principles, by confirming the likelihood of an outcome contingent on time-based probabilities. The purpose of my technical analysis is to confirm or reject an entry point in the stock, by observing its sector and industry, and most of all its price action. I then analyze the situation of that stock and calculate likely outcomes based on the mentioned theories.
Both the consumer cyclical and the technology sectors have recorded significant strength after a long period of weakness, while auto manufacturers are by far leading the rally in the past 3 months. Some industry-related headwinds have eased and stronger consumer spending, as well as less price pressure, are helping the industry to recover fast and consistently. Some potential risks are instead still in the picture, such as the U.S.-China trade war, the war in Ukraine, or a possible recessionary scenario in the major economies worldwide, where especially Europe seems to struggle to recover significantly. Investors should also consider the possibility of a retracement of the recent rally and prepare for the eventuality of the stock dropping as described in my bearish scenario. Despite the fact that I favor the scenario that sees TSLA forming wave 5, in the actual situation, I still rate Tesla, Inc. stock as a hold position until a better picture will gives significant signs to scale into the stock.
For further details see:
Tesla Is In Charging Mode (Technical Analysis)