IWM - Tesla Is Running Low In Power (Technical Analysis)
Summary
- TSLA has formed a massive 114% short-term rally which is now giving signs of exhaustion.
- The stock is likely heading into more weakness while investors could wait and see if support may build up.
- In this technical article, I show important price levels and metrics that investors could consider for gaining an edge on the stock’s likely price action.
- By considering multiple outcomes and setting up an adequate contingency plan, investors are less inclined to act driven by emotions, as this could come at a higher cost.
- I continue to rank TSLA as a hold position, while I would still avoid any new or further exposure to the stock.
Tesla, Inc. stock ( TSLA ) is facing an important technical situation that could lead to forming a new uptrend or instead seeing the stock retracing dangerously into new lows. The recent rally gives signs of exhaustion, while it is a moment of high uncertainty before the expected investor’s day. In this article I discuss technical elements that underscore the increasingly high chances of seeing the stock performing poorly, leading me to continue qualifying the stock as a hold position, while I would certainly still not enter or add exposure in TSLA until the discussed positive scenario would be confirmed.
A quick look at the big picture
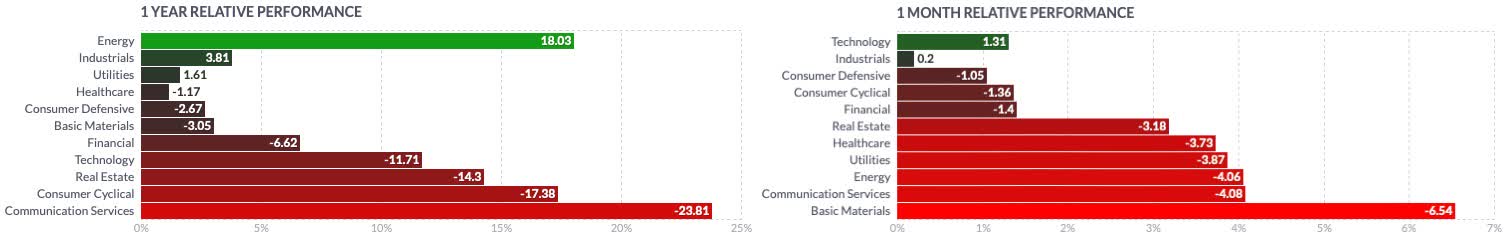
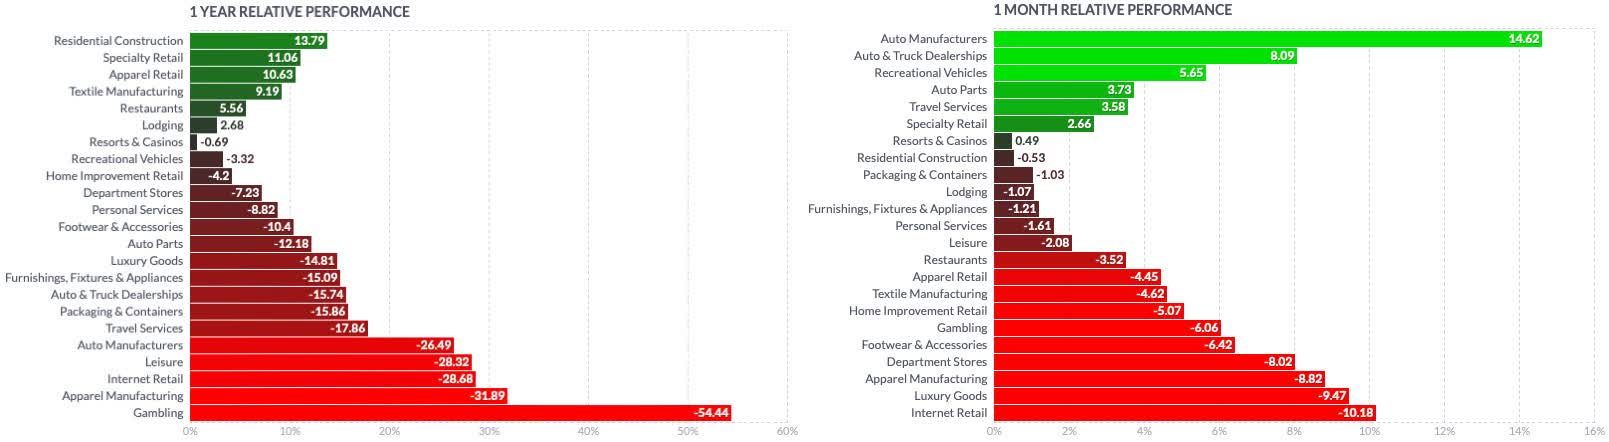
The US consumer cyclical sector has been a strong leader during the recent rally in the US stock market, after a year of severe sell-off that affected most of the industries across the sector. More recently, also this sector has slowed down, mostly affected by the internet retail industry, luxury goods, and apparel manufacturers. Auto manufacturers could record a strong positive momentum in the past month, followed by other related industries. Auto manufacturers have been particularly positively affected by the relief in the global supply chain bottlenecks, while some headwinds still affect the global industry. Although it is expected to progressively improve, the semiconductor shortage will most likely persist in 2023, and rising interest rates, inflationary pressures, and geopolitical uncertainty will result in a softening demand.
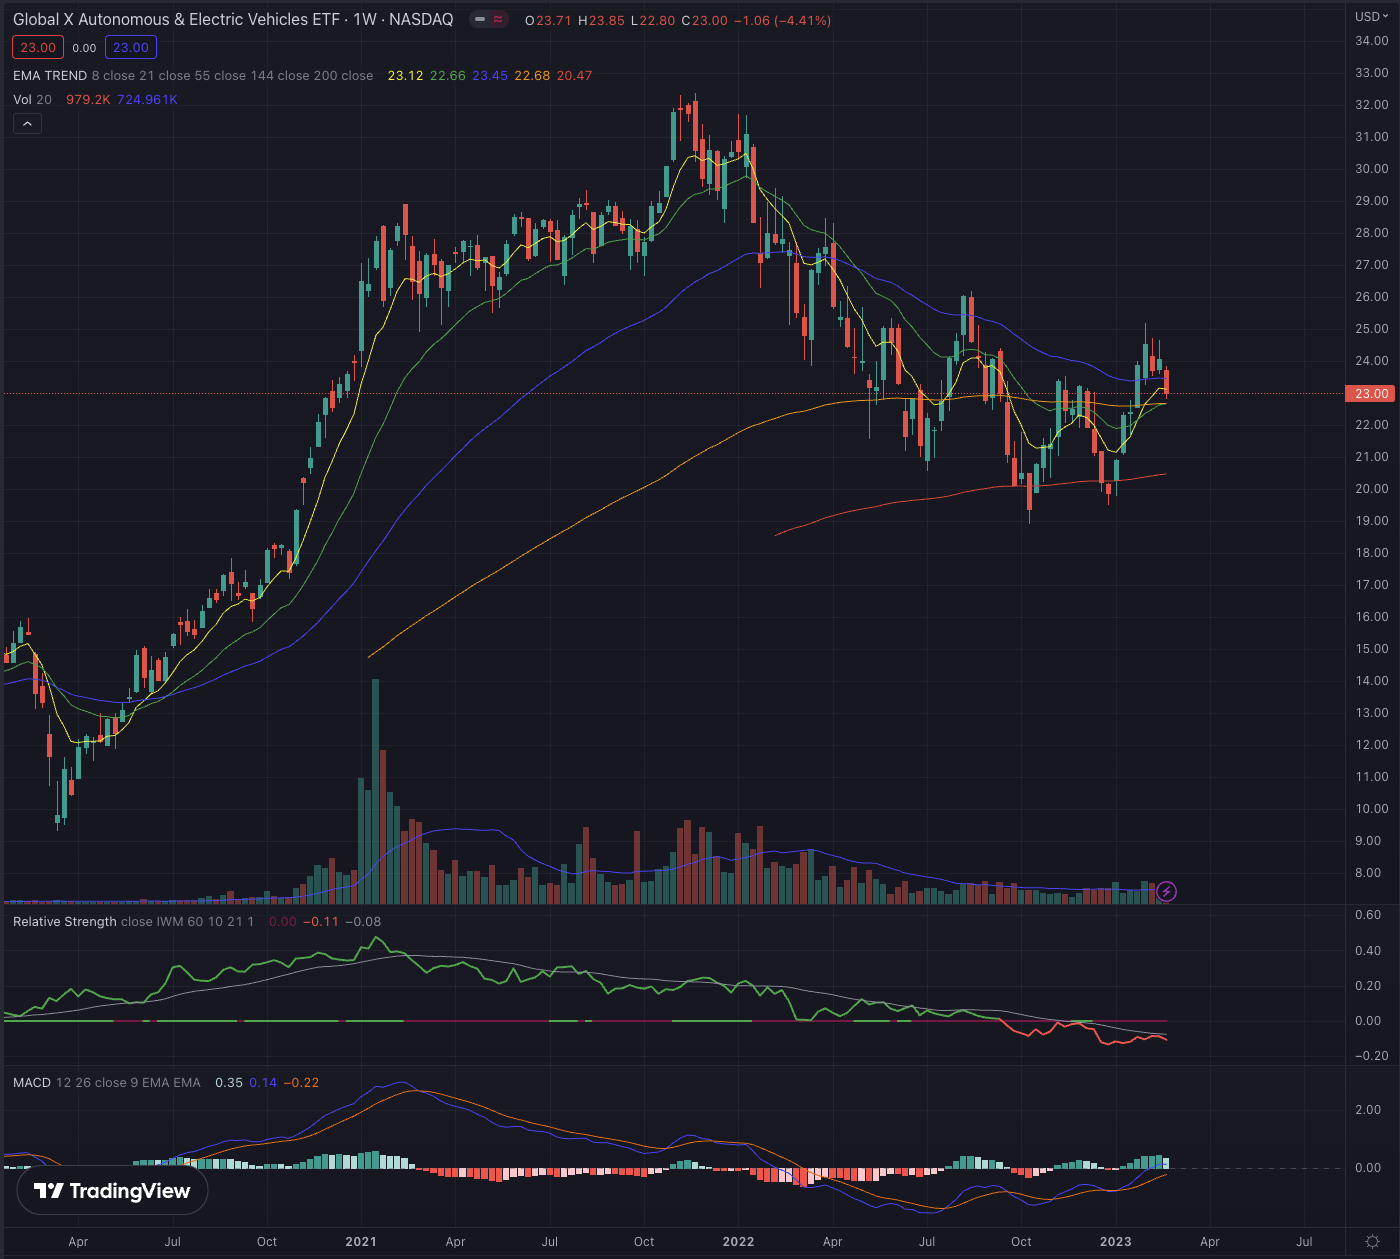
The Global X Autonomous & Electric Vehicles ETF ( DRIV ) is still in its medium-term downtrend after having been rejected at its EMA55, while the industry benchmark could recover from its bottom and avoid falling back into a long-term downtrend, it seems still struggling to build relative strength when compared to the Nasdaq Composite (IXIC), or the broader stock market, the iShares Russell 2000 ETF ( IWM ). Despite the most recent positive momentum, DRIV would need significantly more conviction, and persistent relative strength, in order to set up a new uptrend. The coming weeks will be of utmost importance, as the benchmark is now at risk of falling back under its EMA144 which could lead to a re-test of the EMA200.
Where are we now?
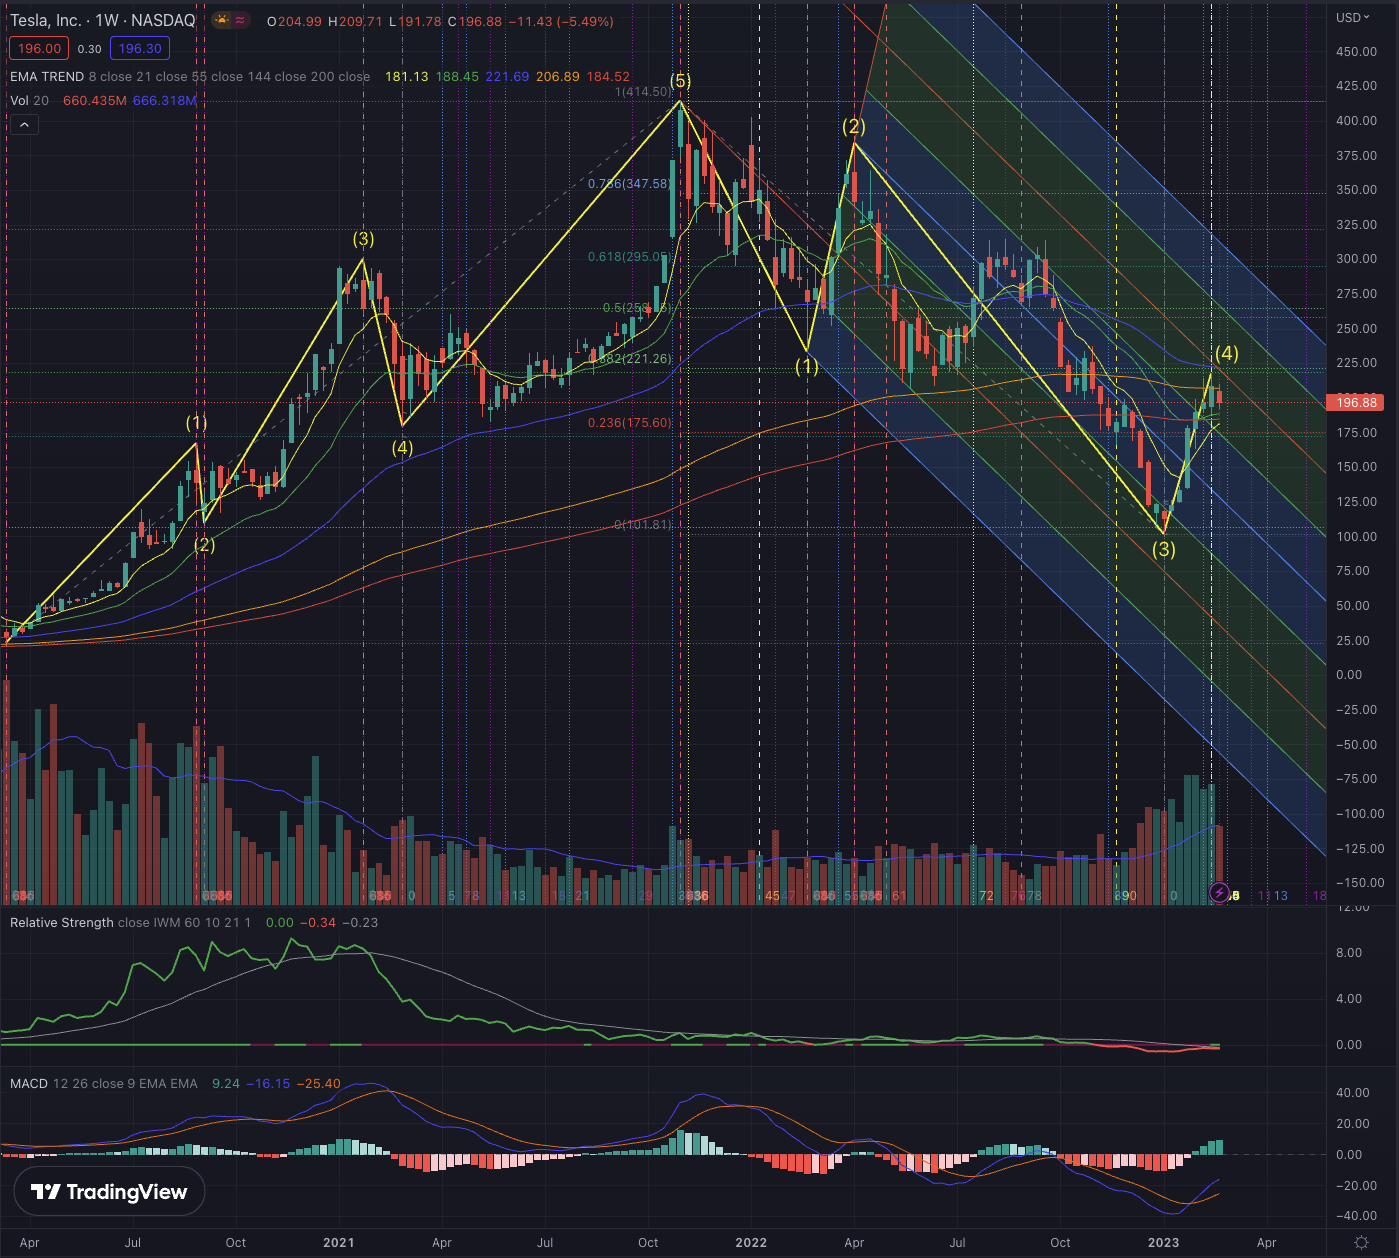
TSLA has formed an Elliott upward impulse sequence set from the pandemic low, with wave 5 extending in a steep final rally, and immediately after began its downtrend, while sporadically reporting relative strength when compared to the broader US stock market until the end of 2022, when the stock reported significant relative weakness. In my article “Tesla Vs. General Motors: Which Stock Is The Better Investment?” published on December 19, 2022, I discussed the fundamentals of Tesla and valued the company based on three scenarios. My analysis suggested a fair valuation of TSLA at $164, with the most optimistic scenario valuing the stock at $207 and the worst case at $95, and I rated the stock as a hold position. TSLA successively bottomed at $101.81 on January 6, 2023, and could form a short term-rally, characterized by strong accumulation days, that leads to testing the EMA55 on its weekly chart on February 16.
Despite TSLA recently surging from its stage four, which was overdue for negative extension, the stock will need to build up significant relative strength for a consistent reversal. The major issue in this kind of situation is the massive technical, but also psychological, overhead resistance that the stock has to overcome before possibly setting up a new lasting uptrend.
The stock is still tracing the downtrend channel and the whole negative movement could form a new downward impulse sequence, which would be in its wave 4 formation right now. In the next paragraph, I will discuss the implications of such formation, as well as multiple scenarios that I would consider in my contingency plan.
What is coming next?
While I made my observations on TSLA's weekly chart, it's now important to zoom in and confirm my assumptions on the daily chart, a time frame I used to define the next tactical steps in my investment strategy.
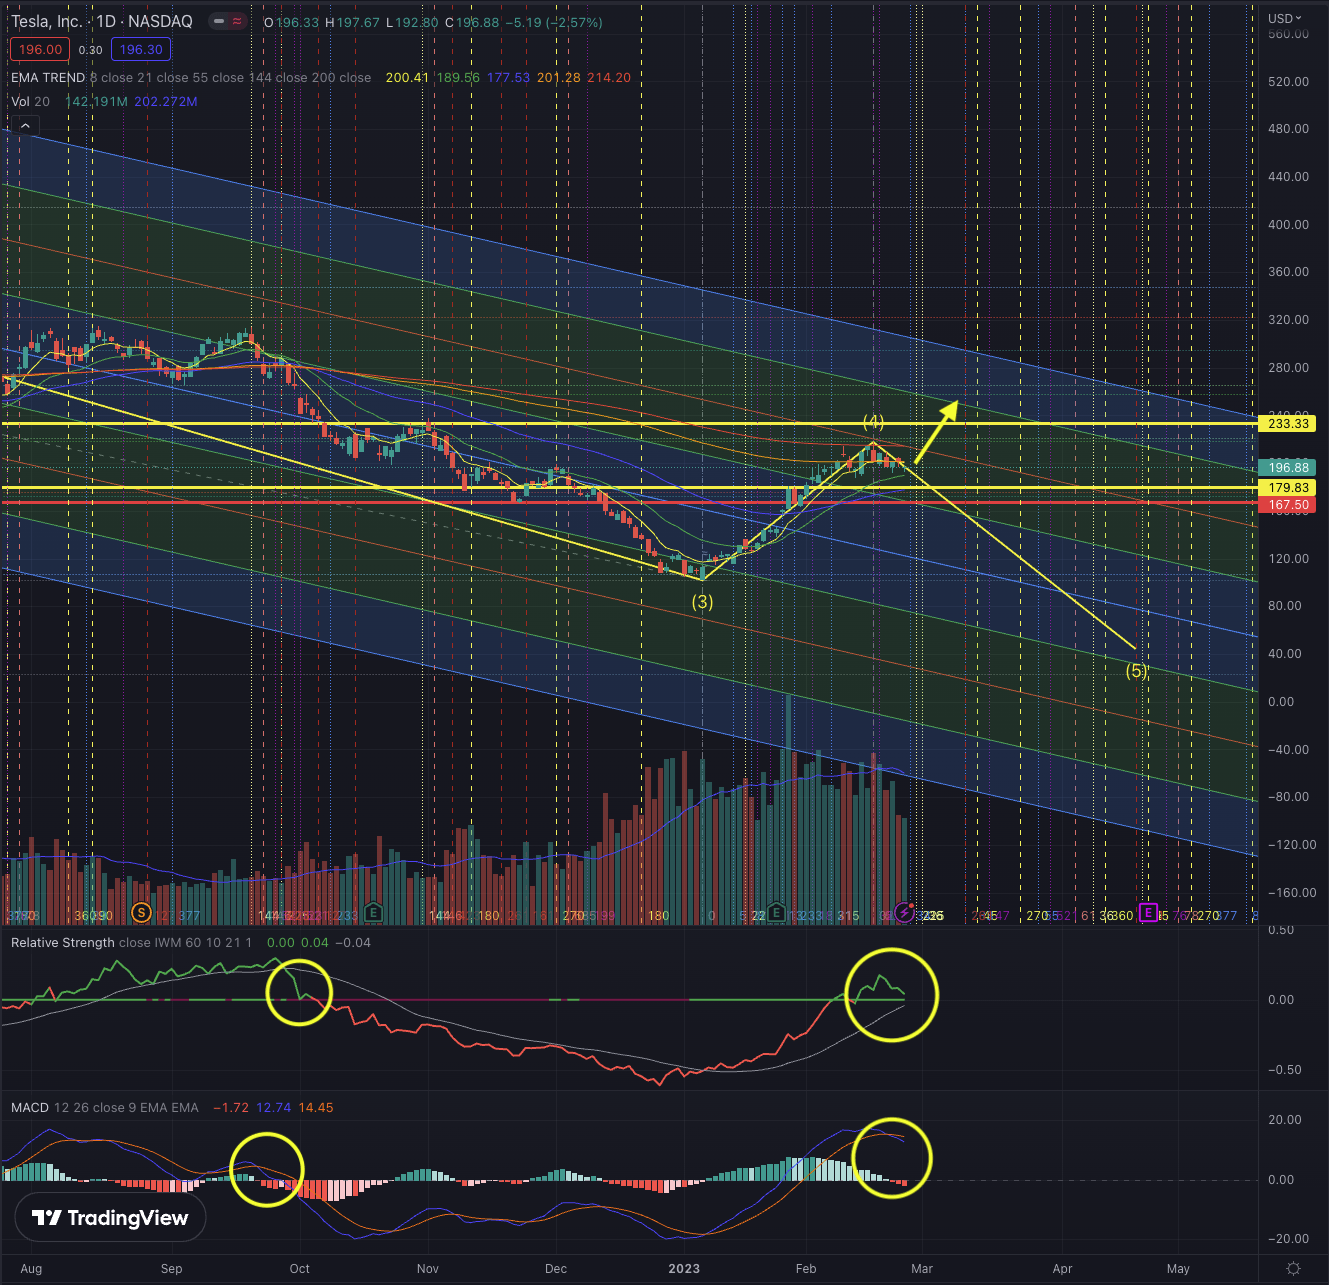
On its daily chart, TSLA has been testing its EMA200 during the past few weeks, while now hovering under it in search of support at the EMA8 and the EMA144. If the stock is effectively forming wave 4 of its downtrend, this has two major implications. First, the stock’s rally, if not already exhausted, would be limited at $233.32, as TSLA would otherwise cross into the territory of wave 1 and break one of Elliott Wave Theory’s cardinal rules. Second, investors should expect wave 5 forming and this could signify more pain ahead. Wave 5 would lead TSLA toward the bottom of wave 3, or extend further toward $77, along the downtrend channel until the extreme scenario at around $30.
I don’t consider this last extreme scenario as particularly likely, but the probability of seeing lower lows when considering the downward movement and the stocks’ inverting MACD, as well as the dropping relative strength in the daily chart, has to be acknowledged. Wave 4 is likely still ongoing, and it is too early to confirm the completion of this formation. However, as a shareholder, I would not want to be invested in TSLA if the stock is backtracking into wave 5, and would set a trailing stop loss slightly under the EMA21 or the EMA55, but not further than between $179 and $167, as under that price range, the risk of seeing TSLA significantly dropping would be too high.
An alternative scenario I consider would see TSLA breaking out consistently from its EMA200 in the near term, and invalidating my assumption of a downward impulse sequence. Here, the downward movement should be considered as a corrective sequence and the recent surge could be the beginning of a new upward sequence. Investors interested in the stock could then scale in progressively, while bearing in mind that very often a stock will fall back once it broke out, testing its support and confirming the breakout. That's usually a great opportunity to load up more shares, but only if the stock shows resilience in its price action, confirmed by the discussed indicators, and the volume is confirming the rebound, with decreasing sell-side volume while approaching the support, and significantly higher buy-side volume while rebounding.
TSLA’s short interest has more recently surged from a bottom recorded at the end of 2022, while overall the short interest of about 3% has to be considered relatively low. The upcoming investor’s day, scheduled on March 1, 2023, could give more hints on which scenario would become more likely. Investors should closely observe the price action in the near term, while TSLA could also continue to move sideways, and consolidate until it finds enough interest from investors to build up strength and break out from the strong overhead resistance. Although, the bottoming process can extend over a significant amount of time, and even after an initial rally, long-term investors underwater tend to sell the stock as soon as it recovers to their break-even price or any price that psychologically seems a justified trade-off, while longing for relief of their massive loss. From a short-term perspective, this could lead to an interesting trading range between $233 and $170, but I would want to see the bottom of these levels confirmed and positive momentum building up, before considering a swing-trade position.
The high uncertainty at this price level, and the risk of seeing TSLA falling back into wave 5, while always being able to scale into the stock if a new uptrend is confirmed, lead me to continue to rate TSLA as a hold position.
The bottom line
Technical analysis is not an absolute instrument, but a way to increase investors' success probabilities and a tool allowing them to be oriented in whatever security. One would not drive towards an unknown destination without consulting a map or using a GPS. I believe the same should be true when making investment decisions. I consider techniques based on the Elliott Wave Theory, as well as likely outcomes based on Fibonacci's principles, by confirming the likelihood of an outcome contingent on time-based probabilities. The purpose of my technical analysis is to confirm or reject an entry point in the stock, by observing its sector and industry, and most of all its price action. I then analyze the situation of that stock and calculate likely outcomes based on the mentioned theories.
Both the consumer cyclical and the technology sector are losing strength, while the auto manufacturing industry still has overhead resistance to mitigate before setting up for a new strong uptrend. Companies in this industry are facing cyclical headwinds while also the macroeconomic framework is adding pressure on valuations. In stock market downturns, some historical leaders revert, while others struggle to recover and new leaders rise in the industry. TSLA is still struggling to emerge from its sell-off and the stock could head for more weakness, while its upside potential is still too limited in order to justify a position. It’s not the time for investors to be exposed to the company until the stock isn’t able to confirm a new uptrend, which will then offer a great entry point. Under the discussed technical aspects I would not take any new exposure, and I would also wait before deciding to sell the stock, leading me to continue to rank TSLA as a hold position.
For further details see:
Tesla Is Running Low In Power (Technical Analysis)